Article

Heat Transfer and Pressure Drop Characteristics in Straight Microchannel of Printed Circuit Heat Exchangers

1
Department of Mechanical Engineering, Korea University, Seoul 136-713, Korea
2
Samsung Electronics Co., Ltd., Maetan 3-dong, Yeongtong-gu, Suwon 443-742, Korea
3
Department of Mechanical Engineering, Korea National University of Transportation, Chungbuk 380-702, Korea
*
Author to whom correspondence should be addressed.
Entropy 2015, 17(5), 3438-3457; https://doi.org/10.3390/e17053438
Submission received: 11 January 2015 / Revised: 11 May 2015 / Accepted: 13 May 2015 / Published: 18 May 2015

Abstract

:
Performance tests were carried out for a microchannel printed circuit heat exchanger (PCHE), which was fabricated with micro photo-etching and diffusion bonding technologies. The microchannel PCHE was tested for Reynolds numbers in the range of 100‒850 varying the hot-side inlet temperature between 40 °C–50 °C while keeping the cold-side temperature fixed at 20 °C. It was found that the average heat transfer rate and heat transfer performance of the countercurrrent configuration were 6.8% and 10%‒15% higher, respectively, than those of the parallel flow. The average heat transfer rate, heat transfer performance and pressure drop increased with increasing Reynolds number in all experiments. Increasing inlet temperature did not affect the heat transfer performance while it slightly decreased the pressure drop in the experimental range considered. Empirical correlations have been developed for the heat transfer coefficient and pressure drop factor as functions of the Reynolds number.

1. Introduction

A printed circuit heat exchanger (PCHE) is fabricated by diffusion-bonding thin metal plates which were previously engraved with flow channels using chemical erosion techniques. As illustrated in Figure 1, the PCHE appears solid and seamless as the diffusion-bonding technique promotes growth of crystal grains between metallic surfaces that are compressed at a high temperature below the melting point [1], allowing for light weight and high structural strength. The micro photo-etching technique—which has been developed with the progress of MEMS technology—enables the processing of sophisticated microchannels on the metal surface. Additionally, development in the MEMS field has also allowed for easy mass production, reliability and economic efficiency [2,3].
Generally, for a conventional heat exchanger, the brazing technique—where bonding occurs by melting a binder—is widely used. A microchannel PCHE created through diffusion bonding has superior heat resistance and bonding strength than one created by the brazing technique. Because there is almost no thermal resistance, nor reduction or clogging of the microchannels at the time of bonding, excellent production properties and thermal performance can be achieved. Because of these advantages, it is possible to use this microchannel PCHE—created through diffusion bonding—in various fields such as fuel cell systems, chemical reaction processes, marine and terrestrial plants, and refrigeration and air conditioning systems, and the potential fields of use continue to expand [4,5].
Among the previous studies on micro heat exchangers, Peng et al. [6] conducted a study on the effect of the convection heat transfer coefficient on laminar and turbulent flows by using a rectangular microchannel. They determined that the degree of influence on the convective heat transfer coefficient is different, but the hydraulic diameter of each channel, and the gap between aspect ratio and channel under laminar and turbulence flow are important factors. Lee et al. [7] studied the local convective heat transfer characteristics of the rectangular microchannel through a numerical analysis. They found that as the Reynolds number is increased, the heat transfer performance was improved. Also, through comparison of numerical analysis and experimental results, Qu et al. [8] concluded that there is no difference in the macro-sized channel heat exchanger in terms of the flow in the rectangular microchannel. Shen et al. [9] conducted a study on Poiseuille number, local Nusselt number and the surface roughness in a rectangular microchannel. They reported that the friction factor in the microchannel of laminar flow was measured larger than predicted, and the local and average Nusselt number was smaller than the predicted value. In addition, they suggested experimental correlations as functions of the Reynolds number for friction factor and the Nusselt number. Rachkovskij et al. [10] conducted a study on a cross-flow heat exchanger with laminated layers of 20 sheets and the aspect ratio of the microchannel, and in this experiment, air-air was used as the working fluid. From their research results, they suggested an optimal temperature proximity and volume heat transfer coefficient. Kang et al. [11] suggested a theoretical model which can be used to predict the heat and fluid properties of a micro-cross-flow heat exchanger. Nikitin et al. [5] experimentally investigated the heat transfer and pressure drop characteristics of supercritical CO2. They also proposed empirical correlations for the local heat transfer coefficient and the pressure drop factor as functions of the Reynolds number. Ngo et al. [12] have manufactured a new PCHE with an s-shaped pin by improving Nikitin et al.’s [5] straight channel PCHE and conducted experiments on this new PCHE. In addition, they evaluated the thermal hydraulic performance through a numerical analysis. Tsuzuki et al. [13] performed a numerical analysis for s-shaped and various zigzag-shaped PCHEs. They evaluated the thermal hydraulic performance by calculating the heat transfer and pressure drop. Ma et al. [14] performed a numerical analysis for the offset bubble and the offset-strip fin configurations. In this study, a cross-flow pattern was employed for the offset-bubble configuration pattern while the offset-strip fin’s flow direction involved dispersion of the working fluid. Ma et al.’s [14] numerical analysis model focused on one region of the repeated small channels, using symmetric and periodic boundary conditions. The numerical analysis method assumed an incompressible fluid and used a governing equation while using Nusselt number and friction factor to analyze and compare results for both configurations. Ma et al. [15] manufactured a PCHE—through a photo-chemical etching method—with thermal plates of an airfoil channel configuration. This PCHE was then analyzed using a numerical analysis method, followed by a grid test which corresponded with experimental data. In order to analyze the effect of the fin-endwall fillet, Ma et al. [15] then varied the pitch of the airfoil fins and analyzed the Nusselt number and friction factor results. Ma et al [16] performed a numerical analysis for a PCHE with a zigzag channel configuration. The pitch, length, and angle of the zigzag channels were varied and heat transfer characteristics for a laminar flow region of a Reynolds number range of 400–2000 were studied. This numerical analysis assumed a working fluid of air and helium with an inlet temperature of 900 °C. The numerical method results were analyzed using Nusselt number, Colburn j-factor and Fanning friction factor (f-factor). Baek et al. [17] investigated flow maldistribution and axial conduction in regards to PCHE header configuration. Using a numerical analysis method, the flow direction of the working fluid for both vertical and horizontal configurations was considered. Through the NTU method, the effectiveness was obtained and a Nusselt number correlation for microchannels was proposed. Bartel et al. [18] studied PCHEs within advanced nuclear reactors. Within these PCHEs, wavy channel and offset strip fin configurations were compared and analyzed. Furthermore, a Colburn j-factor and fanning friction factor (f-factor) was proposed. Figley et al. [19] researched PCHEs utilized in reactors with high-temperature regions. Using a flow analysis program—Fluent Software—numerical results were acquired. Correlation of the pressure drop results was compared with the numerical analysis, allowing for the validity to be confirmed. Through comparison of the mass flow rate and NTU, the performance effectiveness was calculated. Kim et al. [20], after manufacturing a PCHE heat transfer plate and creating a 3D model of this plate, performed a numerical analysis. By changing the geometric parameters of the fin arrangement, the pressure drop and heat transfer characteristics were investigated in regards to geometric properties. Through these heat transfer characteristics results, the Colburn j-factor, Nusselt number and Euler number were expressed. Kim et al. [20] also compared the Fanning friction factor in accordance with Reynolds number. Koo et al. [21] investigated the flow characteristics of a PCHE inlet through a 3-D Reynolds-averaged Navier-Stokes analysis. Two other surrogate models—the Krigin and radial basis neural networks—were also employed. Additionally, in accordance to the flow rate increase and channel number, the flow characteristics were compared and analyzed. Mylavarapu et al. [22] conducted a numerical analysis based on a model of a PCHE for high-temperature gas-cooled reactors. Using a Reynolds number region of less than 2300, existing formulas were compared with the proposed correlation and analyzed, with the results of the cold and hot sides considered independently of each other. According to the Reynolds number, the Fanning friction number and Nusselt numbers were calculated, and experimental data was compared with the circular pipe correlation. Xu et al. [23] conducted a study on the optimization of fin arrangement and channel configuration for PCHEs using supercritical CO2 as a working fluid. The fin dimensions were varied, involving an airfoil fin type and differing fin thickness, length, and width. The average Nusselt number and pressure drop results were analyzed, in accordance to the increasing Reynolds number. Yoon et al. [24] analyzed four PCHE configurations; straight, zigzag, s-shape and airfoil channel. A numerical analysis method was used, employing a 3D model of the minimum unit structure which removed the need for numerical construction of the entire PCHE. This allowed for the hydraulic diameter, Nusselt number and pressure drop to be compared. The two working fluids used were helium and CO2, with the Fanning for each of the two working fluids calculated and compared. In addition, as part of a cost analysis, the total cost of each of the three different channel configurations was calculated. Yoon et al. [25] conducted a study focusing on crossflow PCHEs within advanced small modular reactors. After confirming a design model, the MATLAB program was used to analyze through mathematical methods. First, a single-pass crossflow was designed and then partial differential equations were obtained by employing the Laplace transform and inverse transform. This allowed for solutions for each variable to be obtained. Yoon et al. [25] then calculated results for the thermal design process, cost estimation methodology, effectiveness and crossflow PCHE analysis. Jeong et al. [26] proposed enhancements to the plate fin type heat exchanger after modelling a fin type and louver fin heat exchanger configuration. Subsequently, in order to evaluate the grid reliability, friction factor and convergence grid tests were performed. The effective area factor was determined through calculation of the non-dimensional factor, Colburn j-factor, and Fanning friction factor (f-factor), and this performance of the commercial-fin configuration was compared with the proposed enhanced fin configuration. Kim et al. [2729] conducted a numerical analysis for PCHEs with wavy channels of variable angles and with a hot-side double-banking heat plate arrangement. Kim et al. [2729] proposed a heat transfer and pressure drop correlation for a working fluid of helium and a Reynolds number of 3000 or lower. Furthermore, Kim et al. [2729] considered the cost of the system power loss, in regards to the stacked thermal plate layers, and analyzed the results to propose an improved PCHE design method.
Aside from these previous studies, research on PCHEs is rather limited, especially when considering the significant amount of research that has been conducted on other types of commercial heat exchangers. Furthermore, within the body of heat exchanger research there are few studies examining microfluidics and pressure drop characteristics and with most employing a Reynolds number less than 1000 in conjunction with an average and unchanging Nusselt number.
In this study, the authors have fabricated PCHE heat exchangers with straight-tube-shaped microchannels and obtained heat transfer and pressure drop data by varying the Reynolds number and the operating temperature. From the results, empirical correlations have been proposed for the heat transfer coefficient and friction factor, which can be used as the basic data for heat exchanger design.

2. Experimental Setup and Data

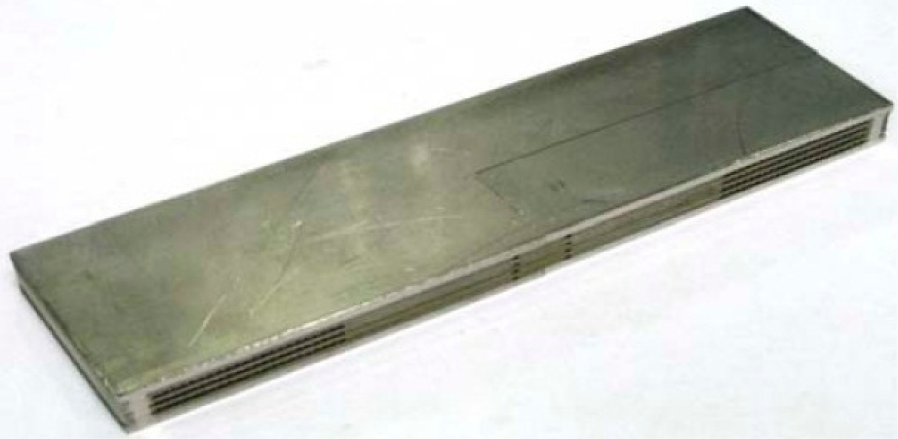
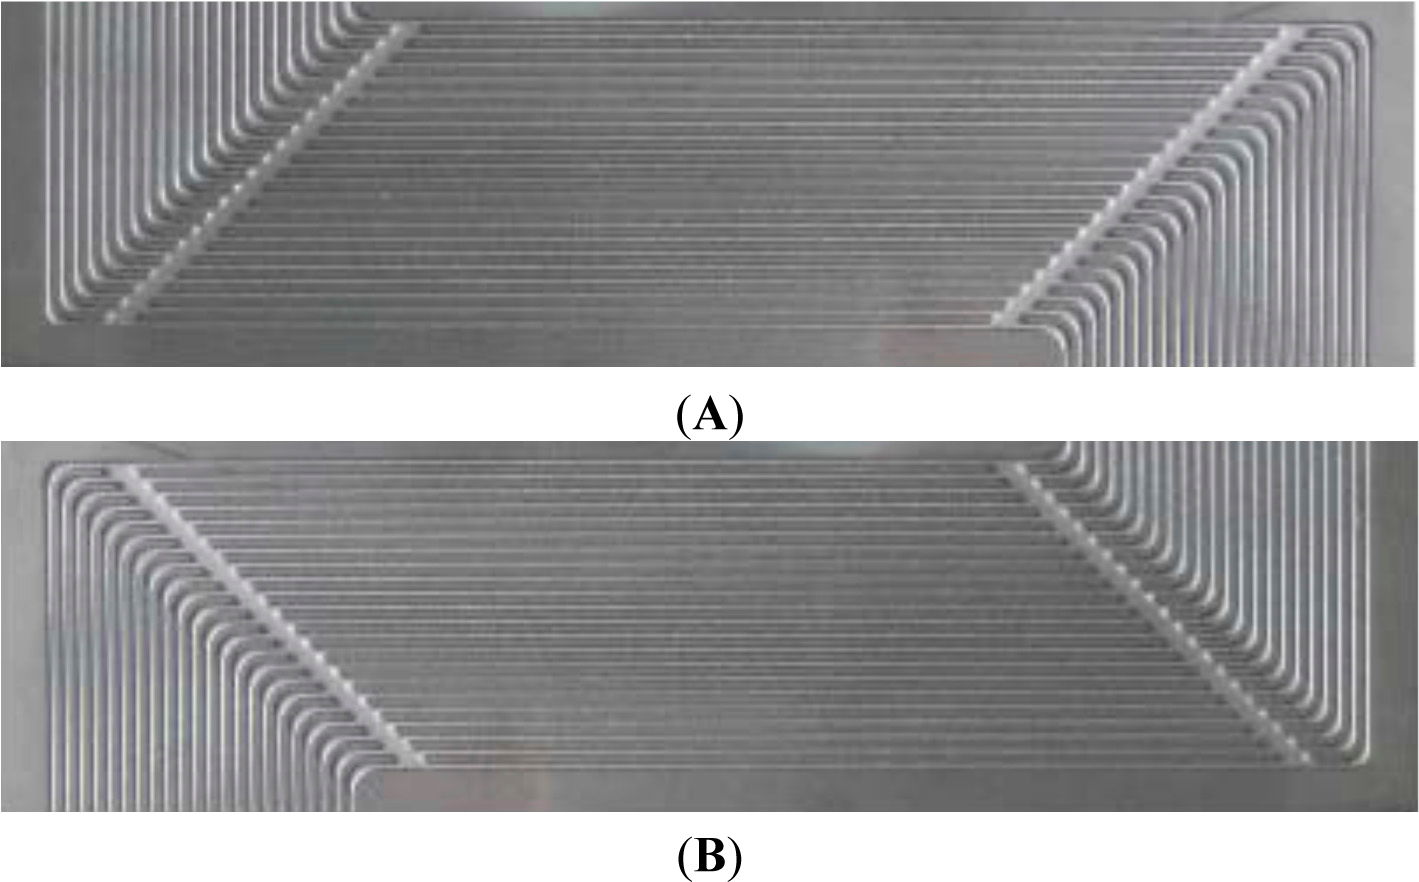
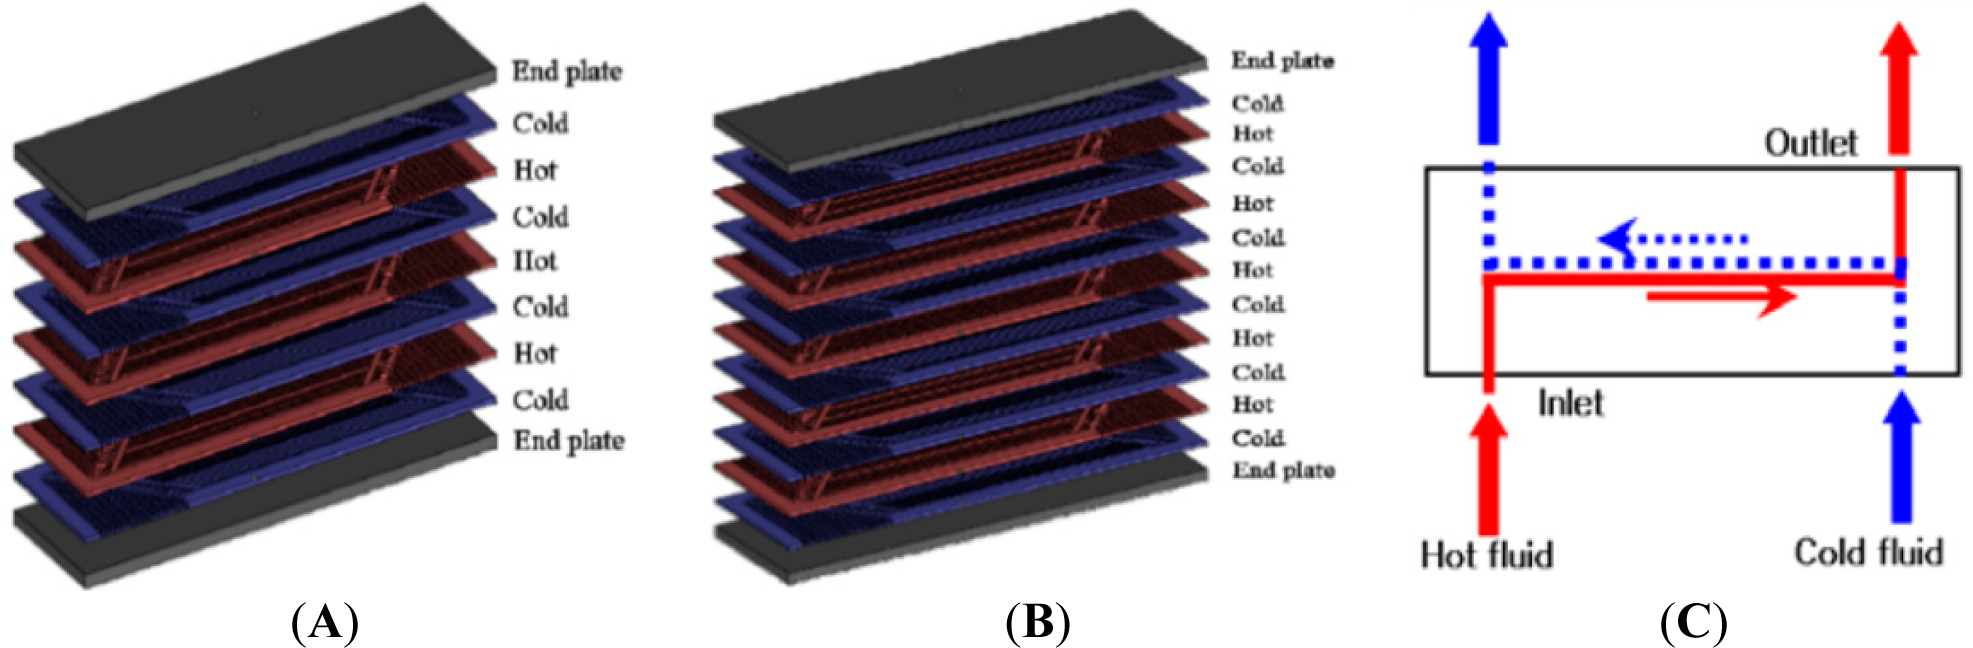
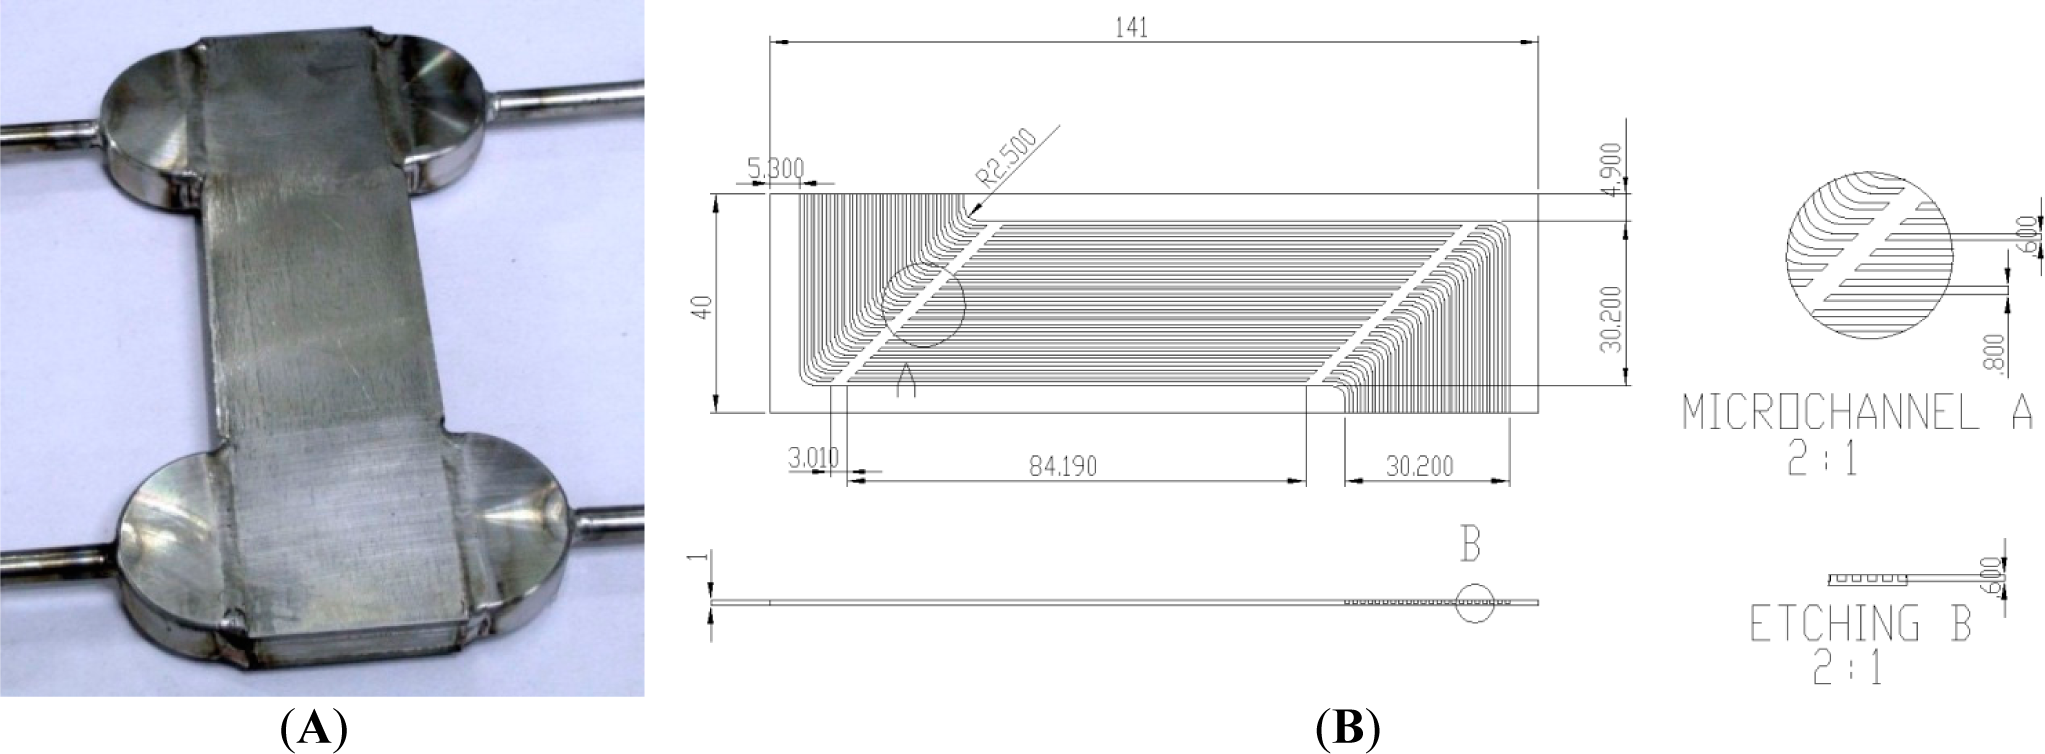
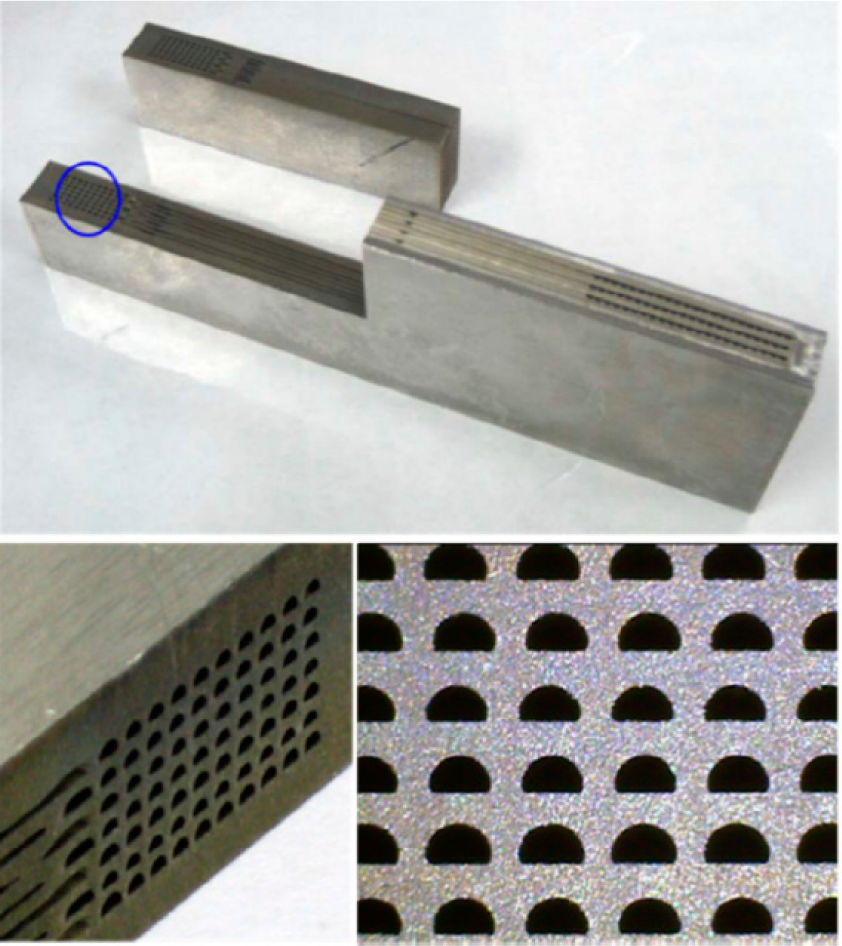
2.1. Microchannel PCHE

The microchannels were formed using photo-etching technology on the cold and hot sides of the heat transfer plates, as shown in Figure 2. Each channel consists of an inlet, a straight middle and an outlet section, all having a half-moon shaped cross section. Two types of heat exchangers were fabricated with different structures. One (PCHE#1) has three hot-side plates and four cold-side plates, and the other (PCHE#2) has five hot-side and six cold-side plates, each with the hot and cold-side plates alternately layered. On the top and bottom of the layered heat transfer plates, extra (end) plates were bonded in order to increase structural strength. The structure and flow configuration are shown in Figure 3. The flow configuration was set for a counterflow to obtain a smaller approach temperature. Once the heat transfer plates were bonded, inlet and outlet ports were attached using electric welding. Due to a lack of gasket and the close distance between the hot fluid and cold fluid, the manufactured PCHEs have a high heat transfer rate.
Figure 4 shows the microchannel PCHE used, and detailed specifications are listed in Table 1. One-quarter of the PCHE was cut out in order to confirm the shape of the internal channels and the bonding condition of heat transfer plates. The cut PCHE and the cross-sectional pictures of channel are shown in Figure 5. The cross-section shows half-moon shaped channels, characteristic of the micro photo-etching process employed. The entrance area (Ac) and the effective heat transfer (As) area were calculated considering the half-moon profile. Furthermore, as shown in the figure, the bonding conditions of the plates were excellent.

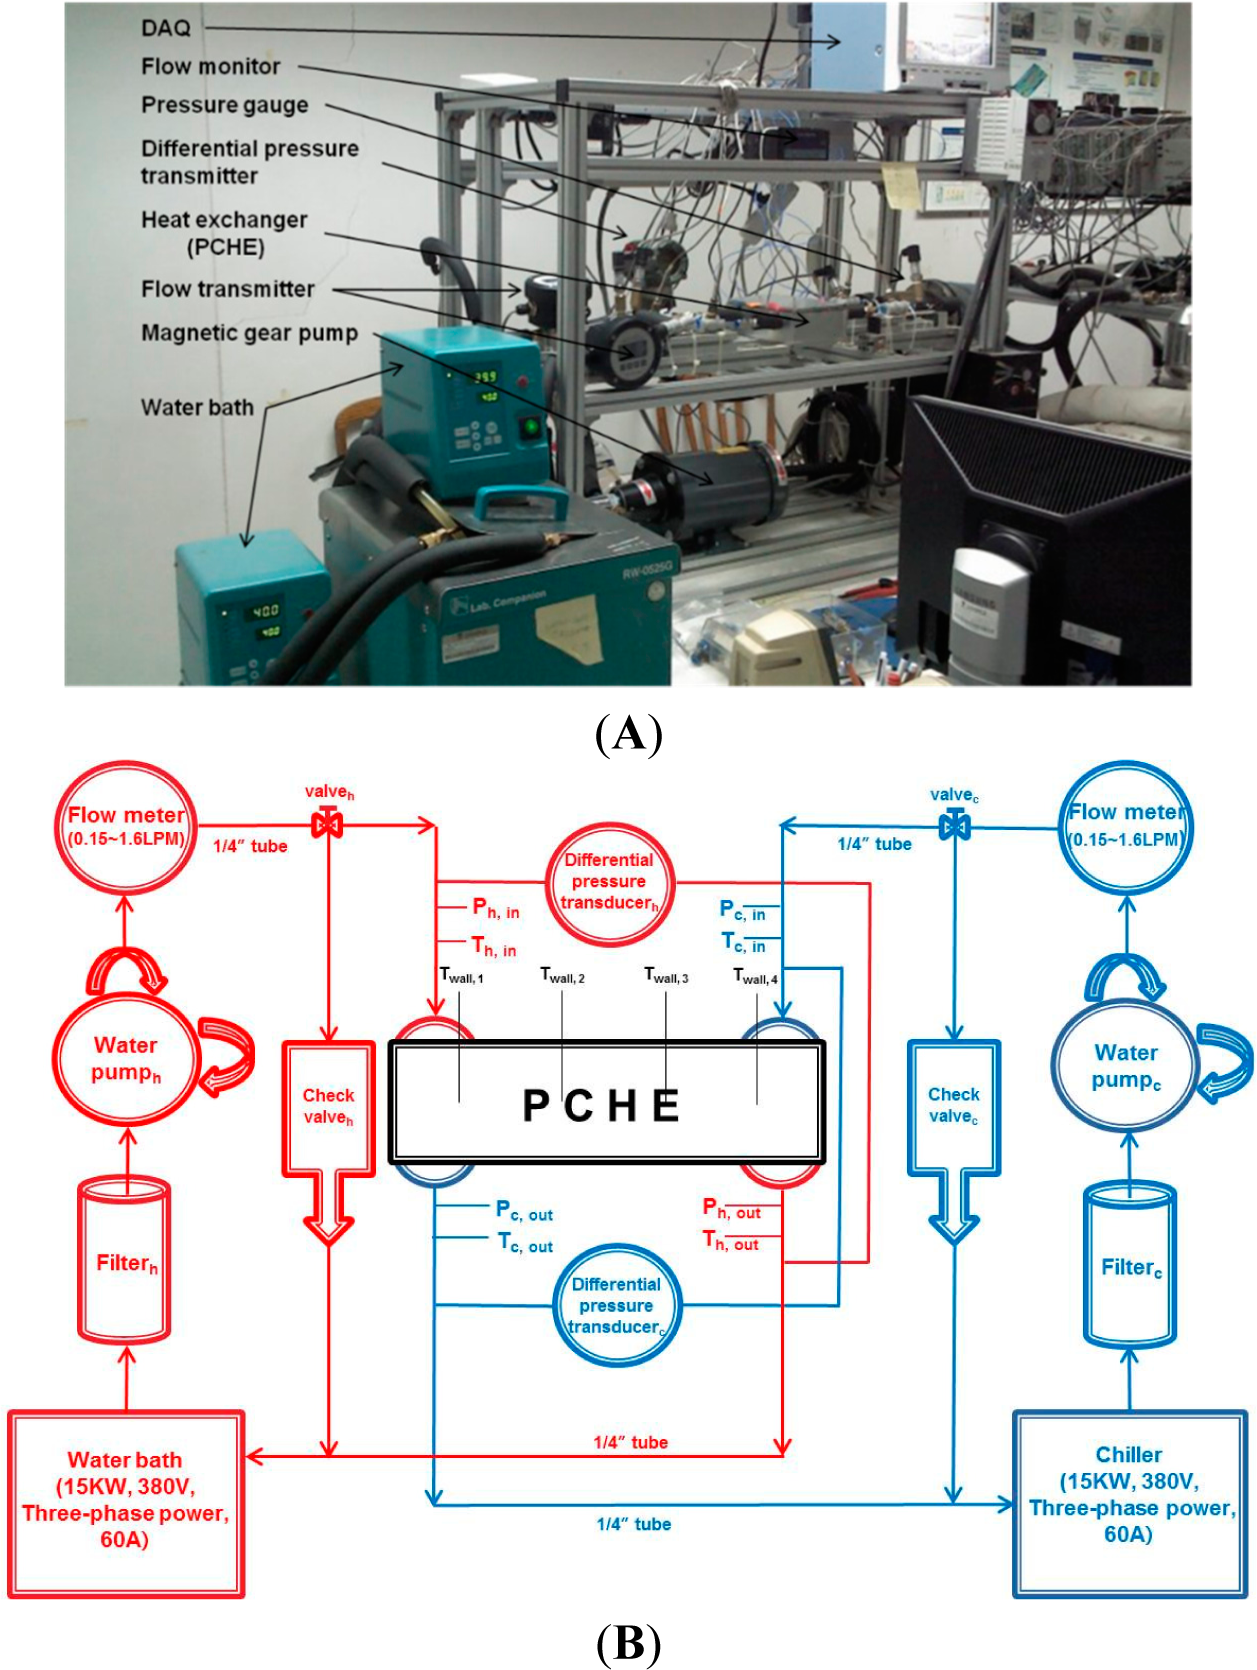
2.2. Experimental Setup

Figure 6 shows the experimental setup. It consists of two sections, one circulating the hot fluid and the other circulating the cold fluid. In order to maintain constant inlet temperature and flow rate, each section has a thermostatic bath, a controllable magnetic gear pump, and a volumetric flowmeter. A filter was installed at the inlet of each flowmeter to remove foreign matter in the fluid and to prevent fluctuations in, and rusting of, the flow meter. Insulation has been provided all across the sections in the experimental setup in order to minimize heat loss. Thermocouples, as well as absolute and differential pressure gauges, were installed at all inlets and outlets. Prior to performing experiments, each measuring device was calibrated. Thereafter, the data of flow rate, temperature, pressure, differential pressure etc. were stored on a computer by using a data acquisition unit (DAQ). After the experimental setup had reached a pre-designated steady-state operating condition, all the measurements were stored at 5 s intervals.

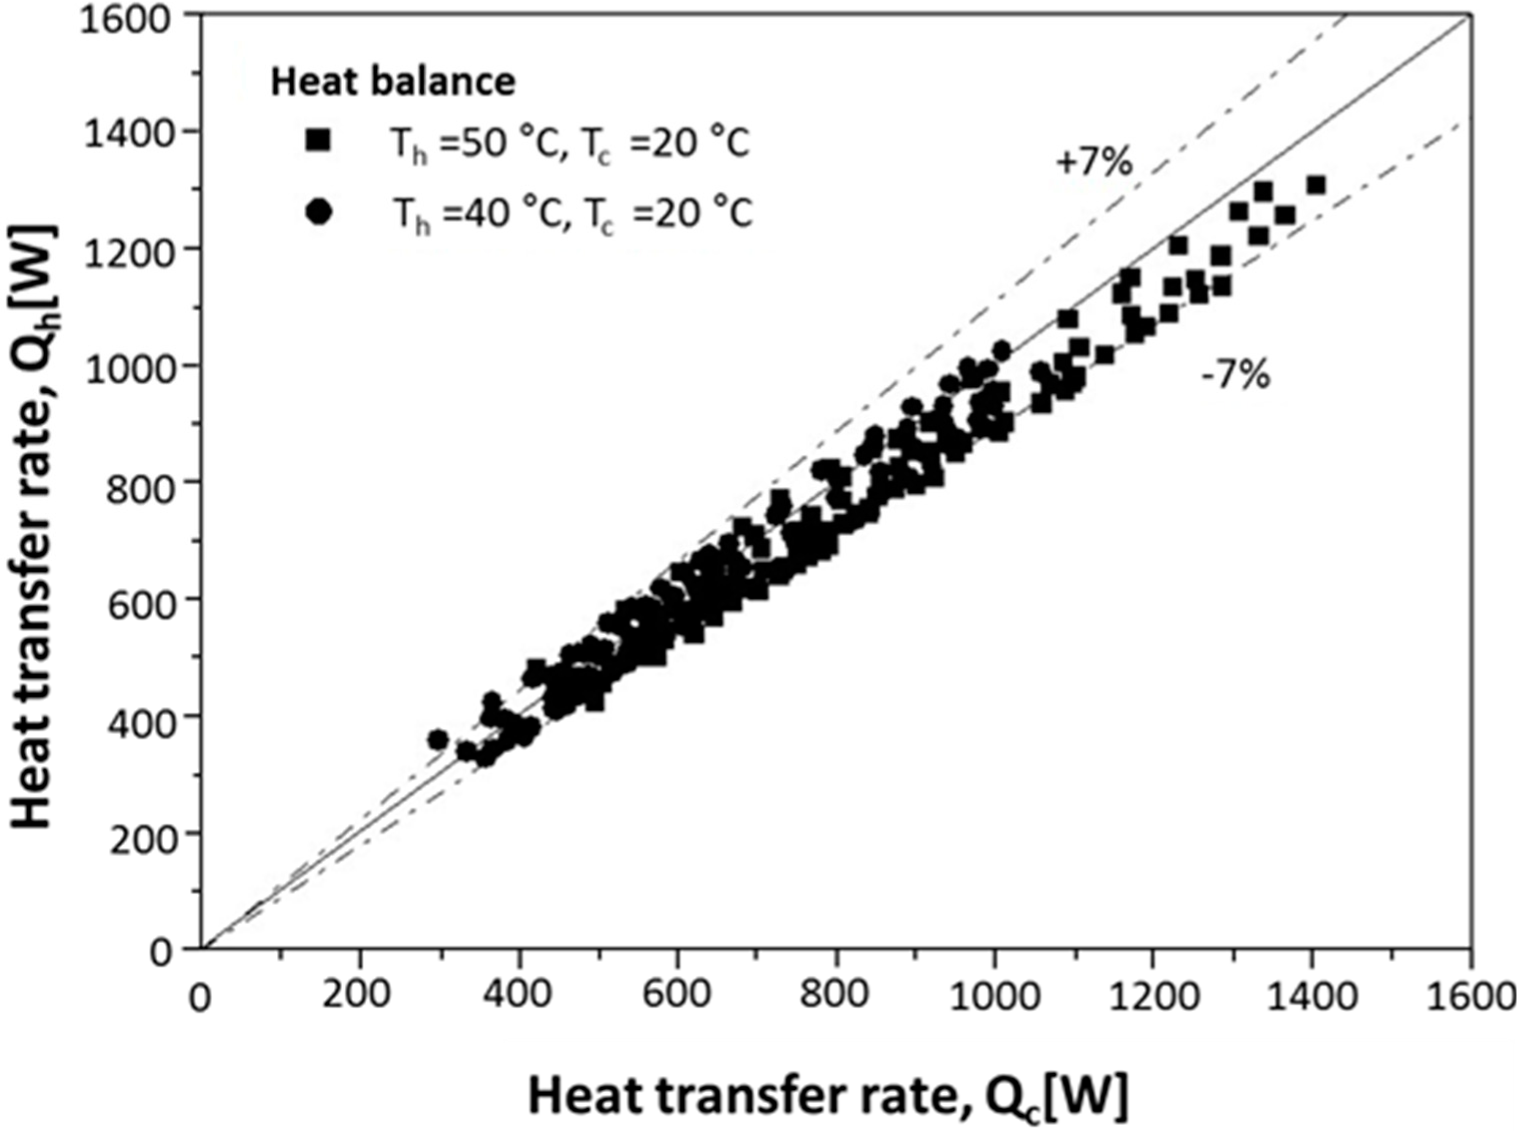
2.3. Experimental Conditions and Results Analysis

Water was used as the hot and cold fluid. The inlet temperatures for the hot fluid were 40 °C and 50 °C. The experiment was performed while keeping the cold fluid’s inlet temperature constant at 20 °C. The hot and cold flow rates were measured in a range of 0.377‒1.391 L/min, where the flow and pressure drop were both stable. The Reynolds number was calculated in a range from 100‒850.
The hydraulic diameter and Reynolds number are calculated using the method suggested by Cowell [30] as:
D h = 4 A c L f A s
Re h = ρ V D h μ = m ˙ D h μ A c
where Ac is the free flow area, As is the total heat transfer area and Lf is the length of the flow stream in a channel. On the hot side, Ac is 31.7 mm2 and As is 26,037 mm2. On the cold side, Ac is 42.2 mm2 and As is 34,716 mm2. Lf is 137 mm and Dh is 0.6685 mm on both sides.
The heat transfer rate in the hot and cold fluids passing through the test section can be obtained using Equations (3) and (4):
Q h = m ˙ h C p , h ( T h , i T h , o )
Q c = m ˙ c C p , c ( T c , o T c , i )
The heat performance (UA) value can be obtained by using the logarithmic mean temperature difference (LMTD) and the average heat transfer rate, as represented by Equation (7):
Δ T L M T D = ( T h , i T c , o ) ( T h , o T c , i ) 1 n [ ( T h , i T c , o ) ( T h , o T c , i ) ]
Q m = Q h + Q c 2
U A = Q m Δ T L M T D
Generally, the overall heat transfer coefficient can be calculated from the sum of the thermal resistances as in:
1 U A = 1 h h A h + 1 h c A c + t k A m
where t, k, and Am denotes the gap between the hot and cold side channels—which is 0.4 mm—the thermal conductivity of the heat transfer plate is 16.2 W/m·K, and the average heat transfer area respectively. The hot-side heat transfer coefficient, hh and the cold-side heat transfer coefficient, hc were obtained by using the modified Wilson plot method [31]. The measurement error was calculated using Equation (9):
Q l o s s ( % ) = | Q h Q c | Q h
Only the results within 7% error boundaries were selected as shown in Figure 7. The total pressure drop of the microchannel PCHE may be expressed as:
Δ P = 1.5 G p 2 2 ρ i + 4 f L G 2 2 D h ( 1 ρ ) m G p = 4 m ˙ π D p 2
where (1/ρ)m is the average density across the flow path and Gp denotes the mass flux at the inlet port. Note that the effect of hydrostatic pressure is neglected. The pressure drop was the measured sum of the microchannel, the inlet ports, and the outlet ports [32]. Experimental uncertainty was calculated by using ASME PEC 19.1 [33] and NIST Technical Note 1297 [34]. The total uncertainty consists of bias error and precision error as shown in Equation (11). When propagating errors, Equation (12) gives the uncertainty of the calculated parameters based upon the measured variables:
Π = 2 ( B 2 ) 2 + ( S N ) 2
Π p = i = 1 n ( p S i u s i ) 2
In Equations (11) and (12), Π is the total uncertainty, B is Bias error, S is a standard deviation, N is the number of measurements, and p is the computational variable. The experiments were conducted by repeating each measurement three times (N = 3). The detailed results for the uncertainty analysis in this experiment are presented in Table 2.

3. Experimental Results and Discussion

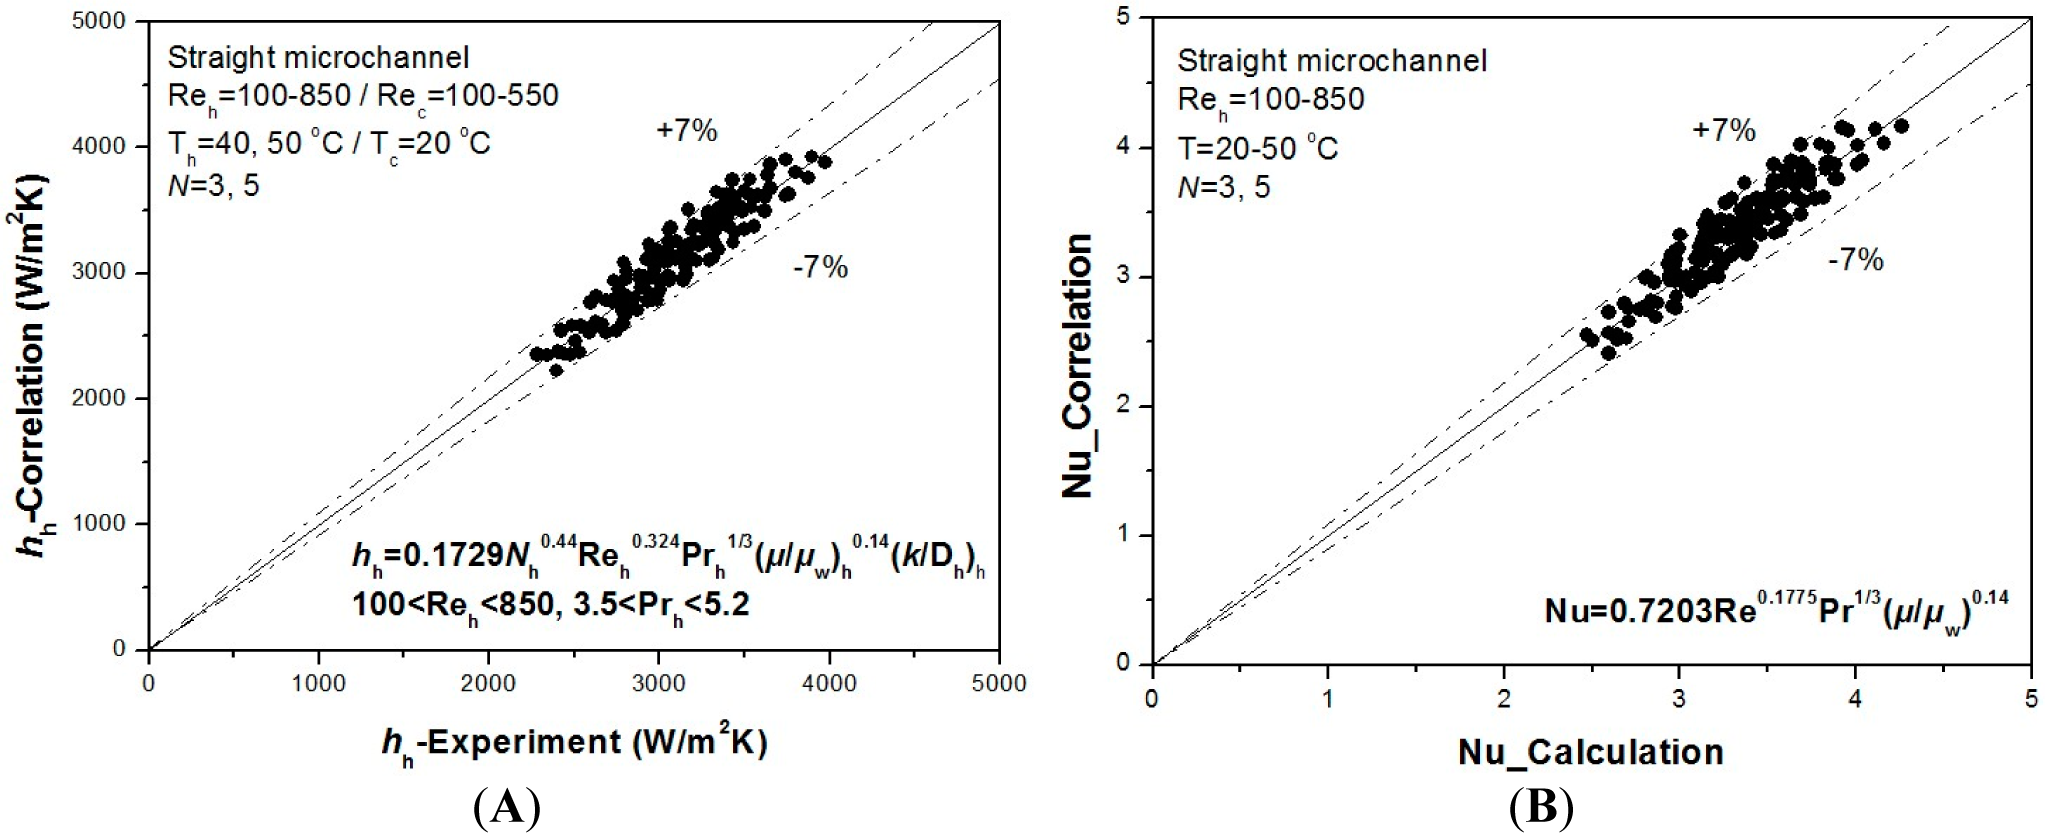
3.1. Heat Transfer Characteristics

Figures 810 show the heat transfer characteristics of the two types of heat transfer exchangers, i.e., PCHE#1 and PCHE#2 in Figure 3, measured for various Reynolds number conditions on the hot and cold sides. Figure 8A shows the average heat transfer rates measured keeping the same Reynolds numbers on both sides. Note that the flow rate of the cold fluid is larger than that of the hot fluid to maintain the same Reynolds number as there is one more plate (channel) on the cold side in the PCHEs (see Figure 3). Two cases of hot-side inlet temperature, i.e., 40 and 50 °C, were measured while cold-side inlet temperature was fixed at 20 °C. The heat transfer rate is larger for PCHE#2 than PCHE#1 as the same hot-side inlet condition and the influence of hot-side inlet temperature is also larger for PCHE#2.
Figure 8B shows the corresponding UA values. The figure shows that the UA increases very slowly with an increasing Reynolds number and the UA value of PCHE#2 is larger—by about 1.8 times—than that of PCHE#1, which is expected from Figure 8A. It seems that the influence of the inlet temperature is minimal as the UA is practically the same for the different inlet conditions considered. In comparison with PCHE#1, PCHE#2 has more plates, having a larger free flow and heat transfer area. Since the flow conditions, i.e., Reynolds numbers, are the same, it may be assumed that U is the same in both heat exchangers. Then, the difference between the two heat exchangers’ UAs in Figure 8A is attributable to the difference in heat transfer area.
In order to see the influence of flow direction, PCHE#1 was additionally tested in a parallel configuration for 40 °C hot-side inlet condition. The results were compared with the corresponding countercurrent results in Figure 9. The average heat transfer rate of countercurrent configuration is about 6.8% larger than that of parallel flow. The UA of the countercurrent flow is approximately 10%–15% larger than parallel flow. In the case of the countercurrent flow, logarithmic mean temperature difference is smaller than the parallel flow by ca. 0.3–1.0 K.
The same heat exchangers were measured again, varying only the hot-side Reynolds number while fixing the cold-side Reynolds number at 200, 250, and 300. The hot- and cold-side inlet temperatures were fixed at 40 °C and 20 °C, respectively. Figure 10 shows the results.
The experiment shows the tendency that the more the Reynolds number of the hot and cold sides increases, the more the average heat transfer rate and heat transfer performance increases. However, as the Reynolds number of the hot side is increased, the increase range in heat transfer rate and heat transfer performance narrows. This narrowing is the change of the hydrodynamic entry region as it becomes fully developed due to the increase in the mass flow rate of the hot side. Figure 10A shows that the Reynolds number of the cold side was 200, 250, and 300, and that the average heat transfer rate in PCHE#2 was 1.5 times more than that of PCHE#1. The heat transfer performance of PCHE#2, as indicated in Figure 10B, was approximately 1.6 times higher than PCHE#1.
In order to obtain a new heat transfer coefficient from a single-phase experiment, the UA value that previously represented the heat transfer performance was used to determine the correlation of heat transfer coefficient in this experiment. The Wilson plot method [35] is known as the method which, after calculating the overall heat transfer coefficient from a heat exchanger, obtains each heat transfer coefficient of the hot and cold sides using those values. Currently the modified Wilson plot method, used in various experimental ranges, is widely used. In this study, the modified Wilson plot method was used in order to obtain the heat transfer coefficient of the hot and cold sides, respectively. The heat transfer coefficient can be expressed as Equation (13) for the heat resistance balance of the hot and cold sides by using Re and Pr of power-law form:
[ 1 U A ( 1 k A m ) ] [ k D h Re a Pr 1 / 3 A ] h = 1 C h + 1 C c [ k D h Re a Pr 1 / 3 A ] h [ k D h Re a Pr 1 / 3 A ] c 1
where coefficients C h and C c and Re index were calculated using iterative multiple linear-regression analysis [36].
Figure 11 shows the results of the heat transfer experiments of the cold side, obtained by using the modified Wilson plot method. N represents the number of lamination layers which are the cold side. The convective heat transfer coefficient correlation of the cold side in the Reynolds number range is the same as Equation (14):
h c = 0.1706 N c 0.44 Re c 0.324 Pr 1 / 3 ( μ c / μ w ) 0.14 ( k / D h ) c , 100 < Re c < 550
The heat transfer coefficient of the hot side can be obtained by using the heat transfer coefficient correlation proposed for the cold side. N indicates the number of lamination layers of the hot side. Equation (15) expresses the proposed convective heat transfer coefficient correlation:
h h = 0.1729 N h 0.44 Re h 0.324 Pr 1 / 3 ( μ h / μ w ) 0.14 ( k / D h ) h , 100 < Re h < 850
Figure 12A shows an error range within 7% when comparing the experiment’s results and Equation (15). Figure 12B shows the results of comparing the difference between the Nusselt number, which is non-dimensional form, and the proposed correlation (Equation (15)) by using the calculated convective heat transfer coefficient. If these results are represented in the form of a new correlation, including the variable of the number of lamination layers, it can be expressed as Equation (16):
N u h = 0.7203 Re h 0.1775 Pr 1 / 3 ( μ h / μ w ) 0.14
The accuracy of the correlation within the range of 7% and the Reynolds number range from 100–850 were proposed for the range of this experiment.

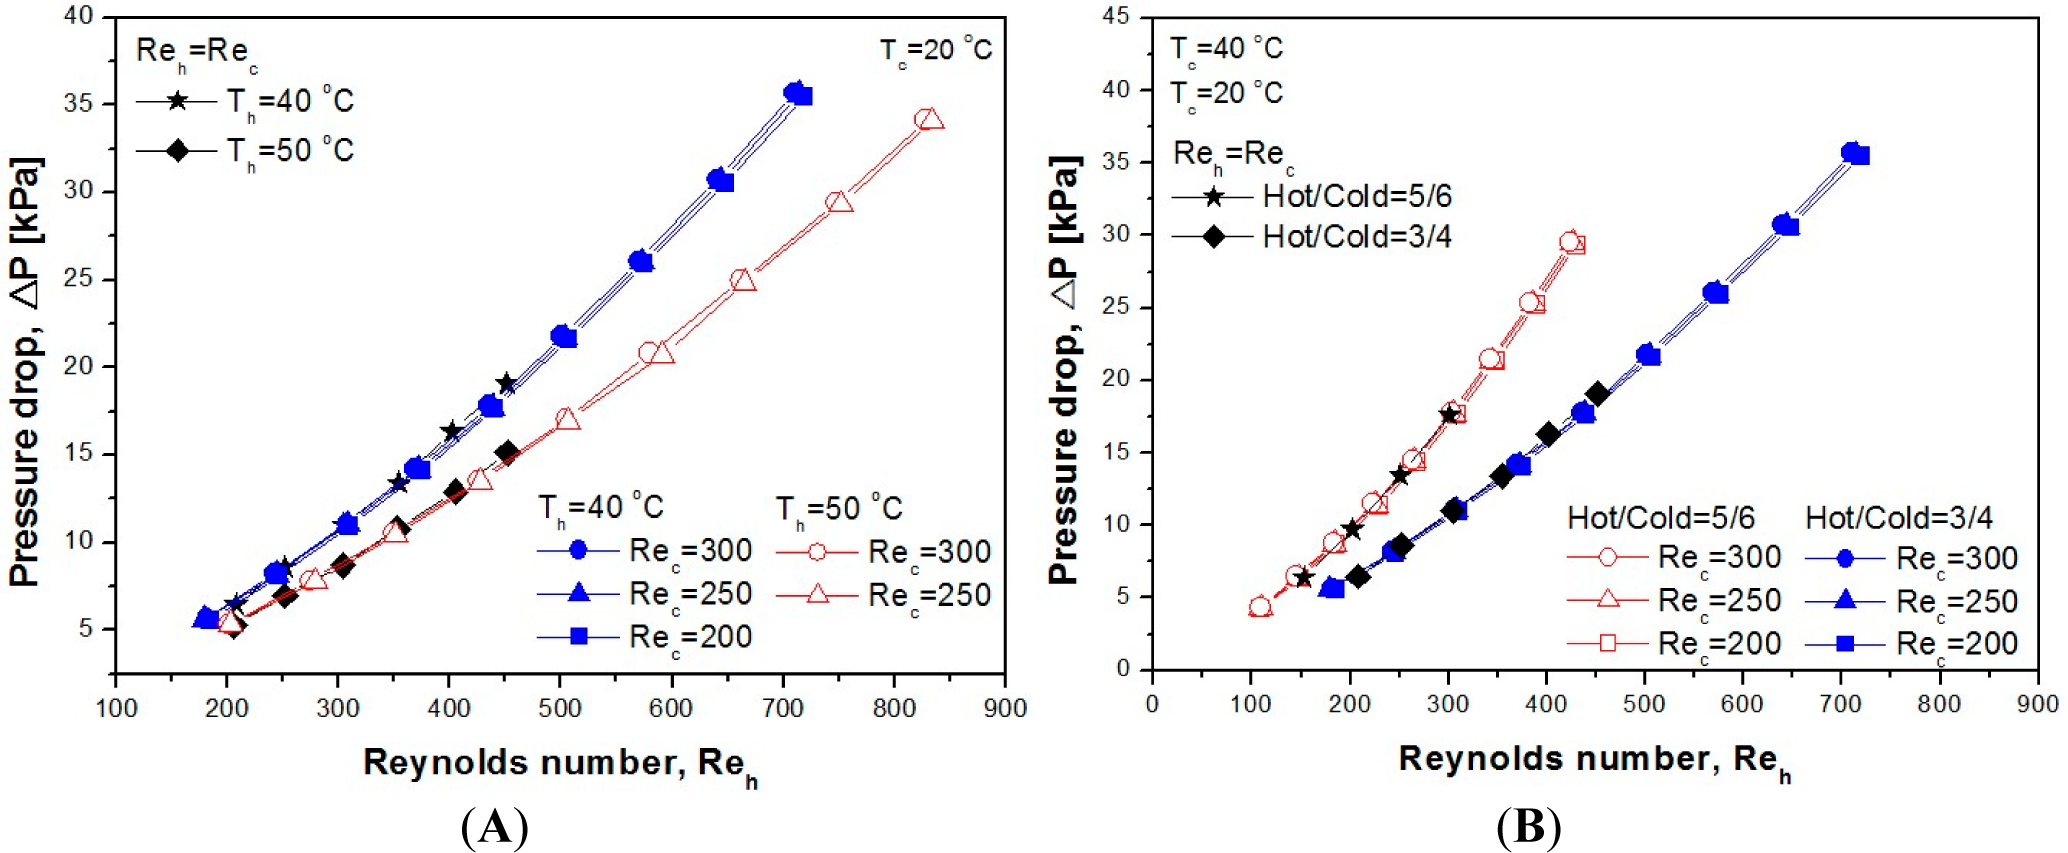
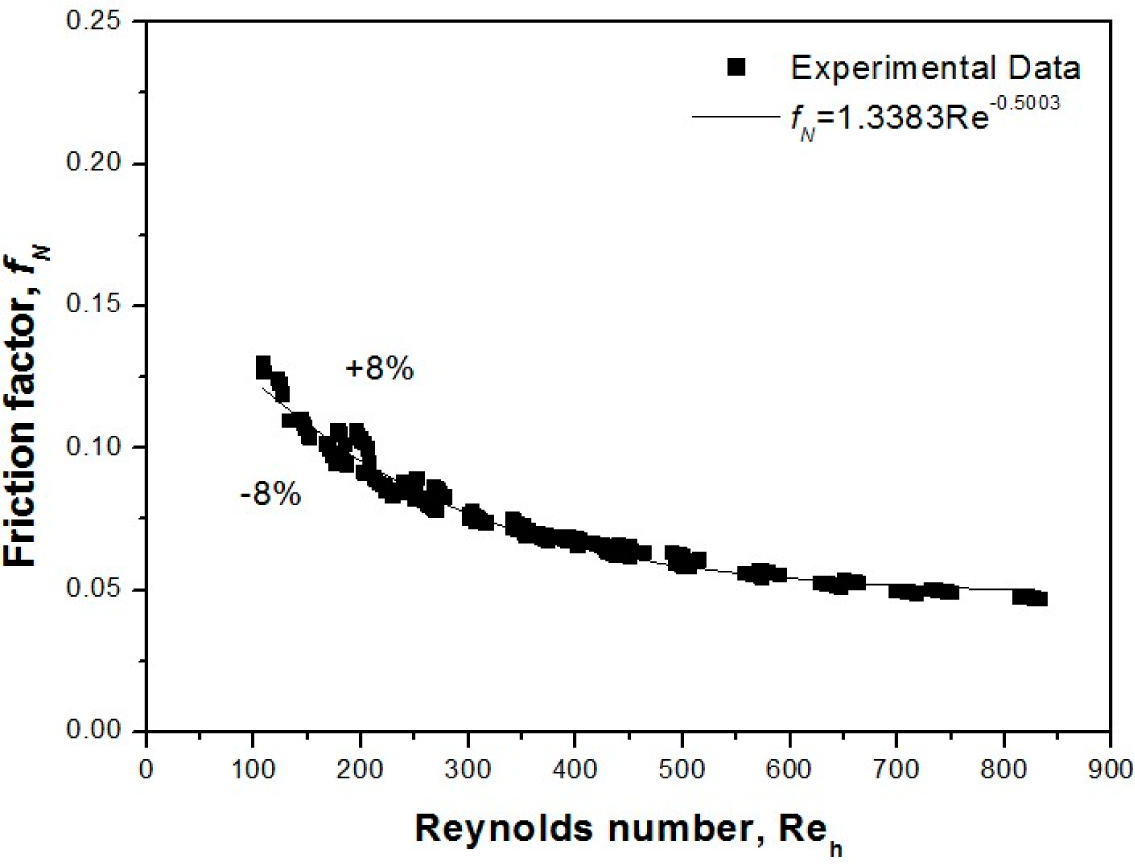
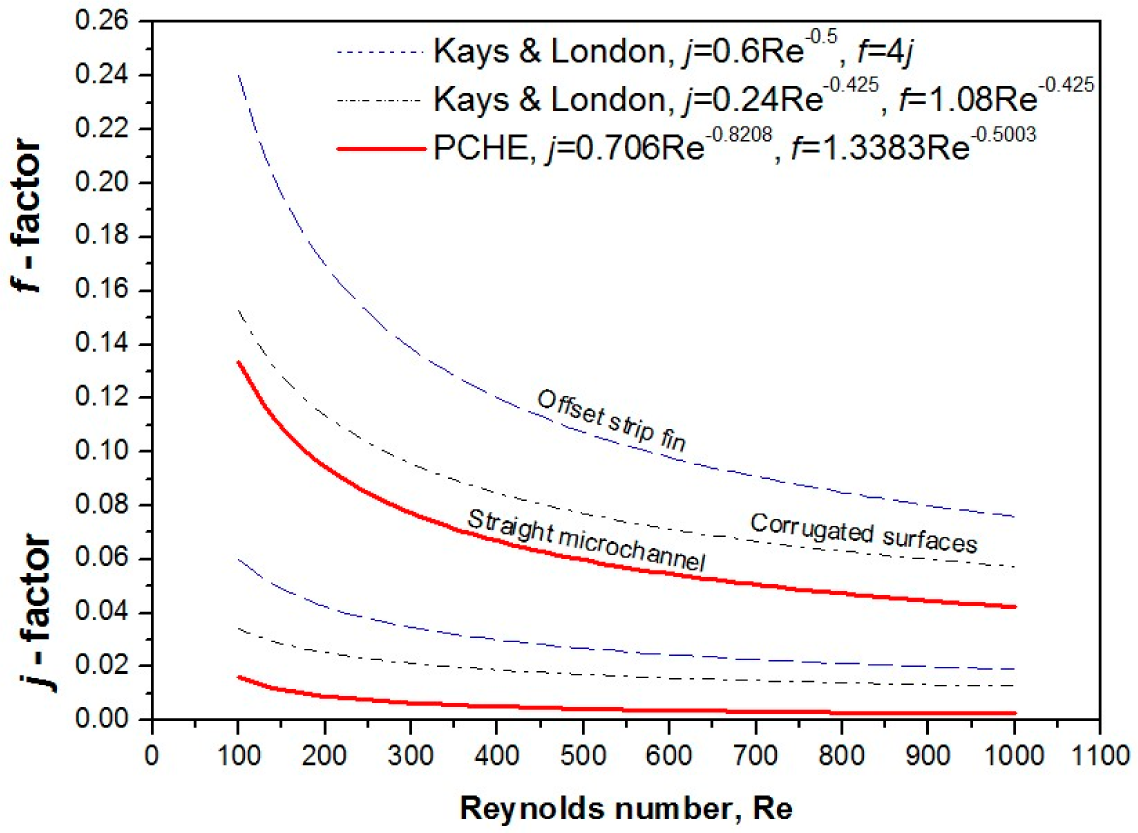
3.2. Pressure Drop Characteristics

Figure 13 shows the pressure drop according to the change of the Reynolds number and temperature of the hot and cold sides. As the Reynolds number increases, the figure shows the tendency of the pressure drop to also increase. The increase of the Reynolds number represents the increase of the mass flow rate in the microchannel. This increase causes an increase in flow resistance, and as a result, the pressure drop will also increase. When the temperature of the hot and cold sides are 40 °C and 20 °C, respectively, the pressure drop, according to the change of the cold fluid’s Reynolds number, shows that the Reynolds number for the hot and cold fluids increases equally as the pressure drop increases. In the range of this experiment, the pressure drop of the hot side, according to the change of the mass flow rate of the cold side, is not significantly influenced. If the inlet temperature of the hot side is increased to 50 °C, Figure 14A shows a slight pressure drop. This change results from the influence of viscosity and density according to the change of the inlet temperature of the hot fluid. As the inlet temperature increases, density and viscosity are reduced. On the other hand, the UA indicating the heat transfer performance shows almost the same performance and is not affected by the inlet temperature.
Figure 14 shows a graph using Equation (10), which is the theoretical equation that represents the pressure drop. Equation (16) expresses the friction factor fN, which is the result value of the pressure drop according to Reynolds number. N indicates the number of lamination layers of the hot side. The total pressure drop was divided by the number of lamination layers. The friction factor correlation is represented by the function of the Reynolds number, and is as follows:
f N = 1.3383 Re 0.5003 , 100 < Re < 850
The exponent of the Reynolds number was calculated using the least squares method. The accuracy of the correlation and the experimental results are within ±8%, and the coverage of the Reynolds number is 100–850.
Figure 15 shows comparison of the proposed non-dimensional form, Colburn j-factor, and friction factor. The proposed correlation was compared with the Kays and London correlation [37] for the corrugated surface and offset strip fin configuration, which utilized a Reynolds number range of 400–3000. Within the flow direction of these two improved channel configurations, the working fluid is disturbed, resulting in a higher heat performance than the straight channel configuration. It was found that the offset-strip-fin configuration had the highest heat performance, followed by the corrugated-surface configuration. Inversely, the straight microchannel exhibited the lowest friction factor, followed by the corrugated surface and with the offset strip fin configuration having the highest friction factor.

4. Conclusions

In this study, the single-phase experiment for the characteristics of the heat transfer and the pressure drop of the microchannel PCHE was carried out. Based on this single-phase experiment, the following values and characteristics of the heat transfer coefficient and friction coefficient correlation were proposed.
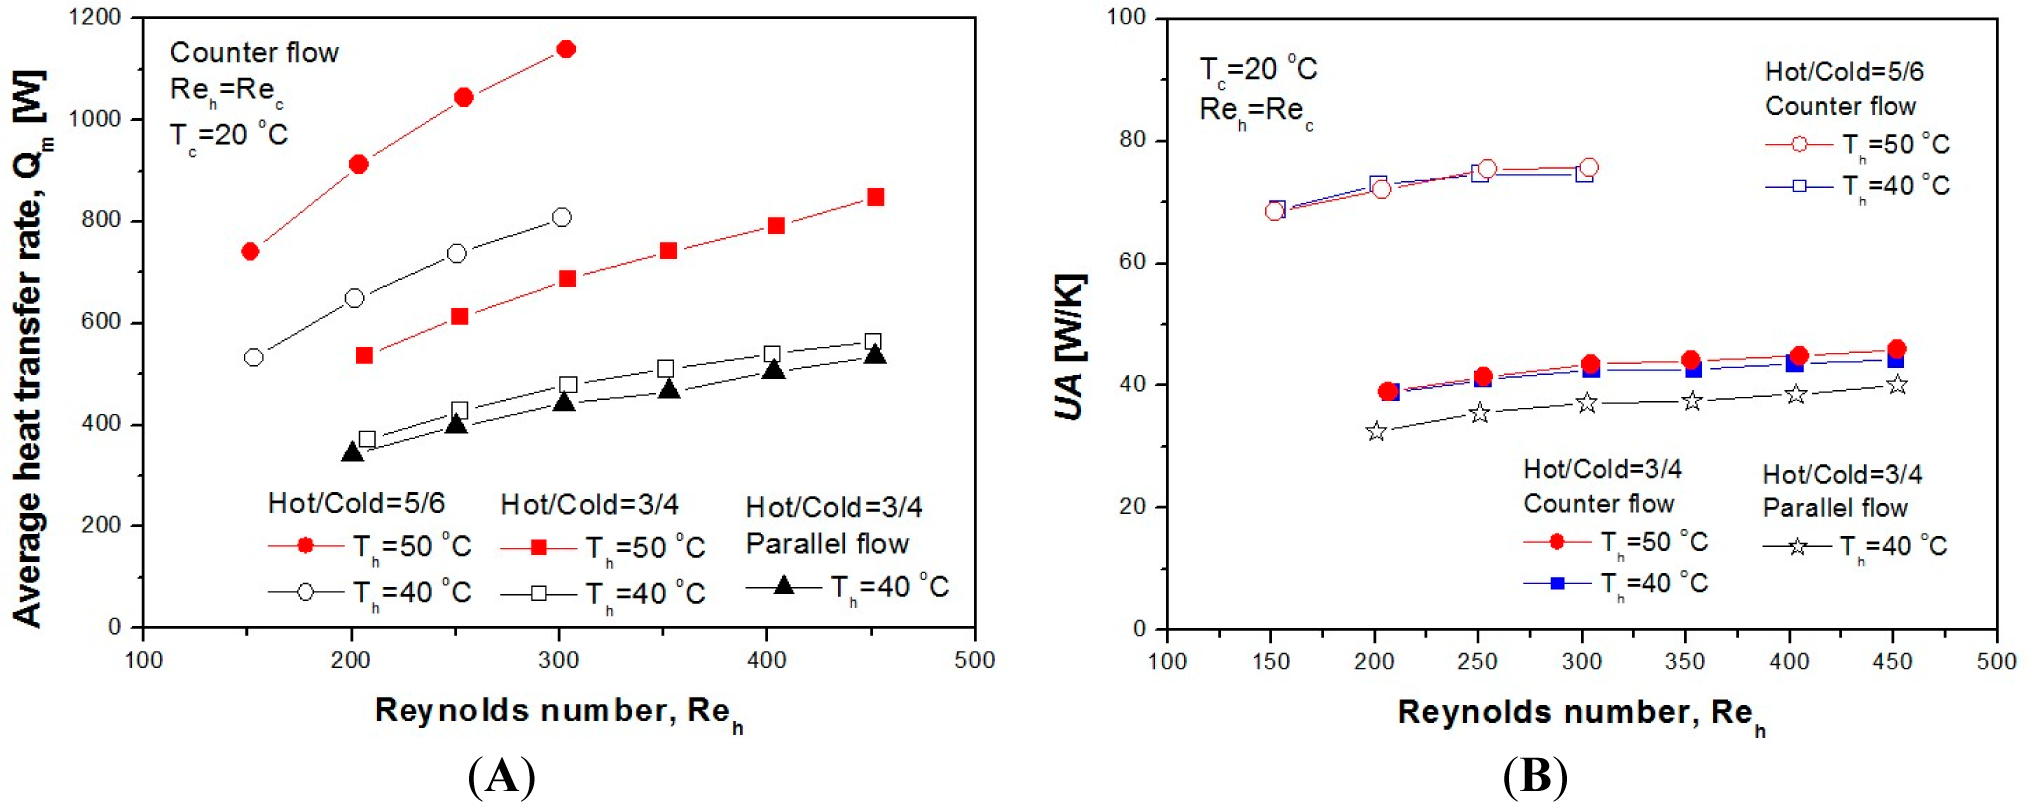
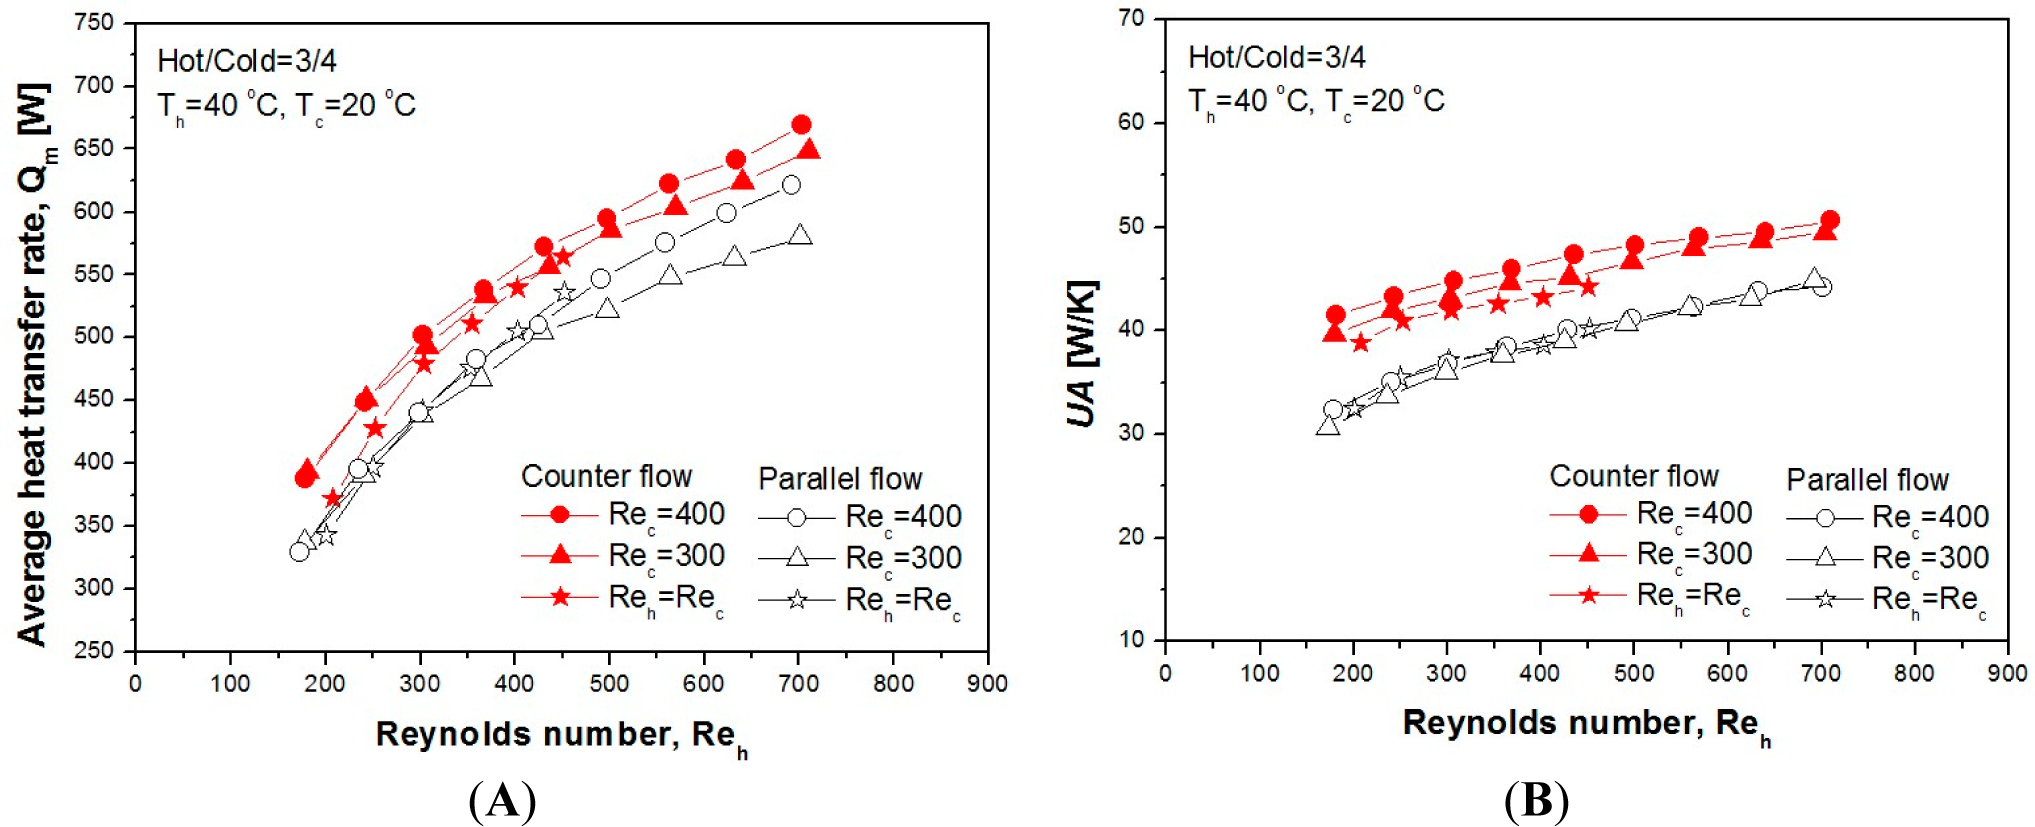
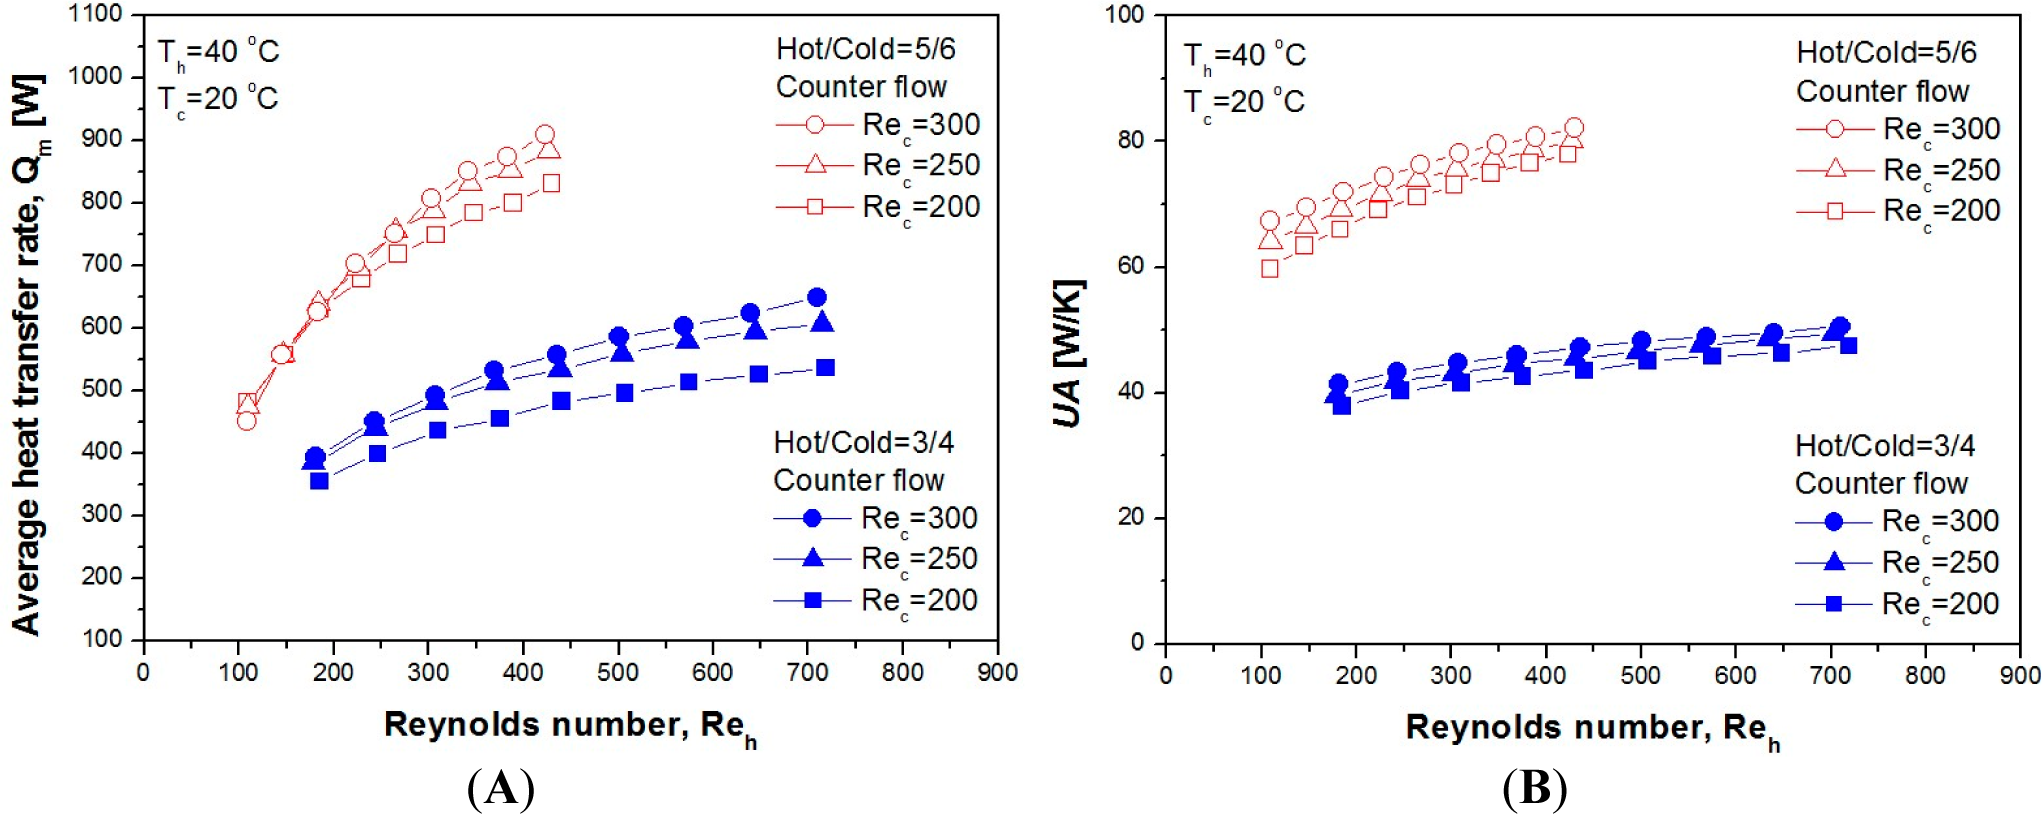
  • The average heat transfer rate of the counterflow PCHE is about 6.8, and the UA of the heat transfer performance is excellent to the extent of approximately 10%–15%.
  • As the Reynolds number of the hot and cold sides increases and the inlet temperature increases, the average heat transfer rate also increases. This increase was the general performance characteristic of the heat exchanger according to the increase of the flow rate.
  • As the Reynolds number of the hot and cold sides increases, the pressure drop increases. If the inlet temperature of the hot side is constant, the pressure drop according to the change of Reynolds number of the cold side shows equal results.
  • The heat transfer performance is not affected by the change in the inlet temperature of the hot side, but if the inlet temperature is high at the time of the pressure drop, which shows a slight pressure drop.
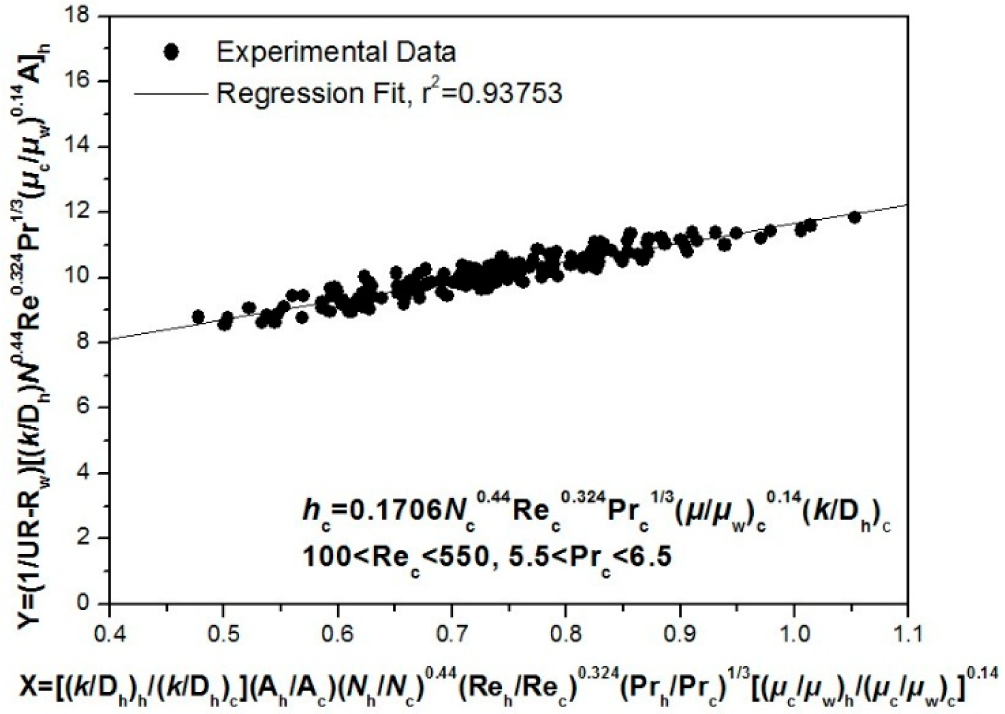
  • The heat transfer coefficient correlations of the hot and cold sides using the modified Wilson plot method are proposed. The Reynolds number range of these correlations is 100–850.
  • The friction factor fN was calculated using the pressure drop results. The application scope is the same as above. It is expected that the experimental results obtained in this study will be usable as the basis for future performance experimental data.

Acknowledgments

The authors would like to acknowledge the late Dr. Kyu-Jung Lee (Korea University, College of Mechanical Engineering) for his mentorship and for sharing his expertise in heat transfer.

Author Contributions

The initial research concept and research design was completed by Jang-Won Seo, Yoon-Ho Kim and Kyu-Jung Lee. Jang-Won Seo conducted background research into previous studies. Yoon-Ho Kim manufactured the PCHE used in the study. Jang-Won Seo constructed the experimental apparatus and performed all experiments. Jang-Won Seo and Dongseon Kim undertook data analysis. This manuscript was primarily written by Jang-Won Seo, with Dongseon Kim and Young-Don Choi providing assistance. All authors have read and approved the final manuscript.

Conflicts of Interest

The authors declare no conflict of interest.

Nomenclature

Ac
Minimum free flow area (mm)2
As
Total effective heat transfer area (mm)2
B
Bias error
Cp
Specific heat (J/kg·K)
Dh
Hydraulic diameter (mm)
f
Friction factor
G
Core mass velocity (kg/m2·s)
Gp
Fluid mass velocity in the port (kg/m2·s)
H
Thickness of metal sheet (mm)
j
Colburn j-factor
L
Length of metal sheet (mm)
Nu
Nusselt number
Pr
Prandtl number
Re
Reynolds number
UA
Heat transfer performance (W/K)
h
Heat transfer coefficient (W/m2·K)
k
Thermal conductivity (W/m·K)
N
Stacked number of metal sheet
ΔP
Pressure drop (kPa)
Q
Heat transfer rate (W)
ΔTLMTD
Log mean temperature difference (K)
W
Width of metal sheet (mm)
Greek Symbols
ρ
Fluid density (kg/m3)
µ
Dynamic viscosity (N·s/m2)
Π
Uncertainty
Subscripts
c
Cold
i
Inlet
o
Outlet
h
Hot
m
Mean

References

  1. Kim, Y.H. Heat Transfer and Fluid Flow Characteristics on Printed Circuit Heat Exchangers with Microchannel Configurations. Ph.D. Thesis, Korea University, Seoul, Korea, 2009. [Google Scholar]
  2. Johnston, A.M.; Levy, W.; Rumbold, S.O. Application of PCHE technology within heterogeneous catalytic reactors. Proceedings of the American Institute of Chemical Engineers (AIChE) Annual Meeting, Reno, NV, USA, 4–9 November 2001.
  3. Gromoll, B. Micro cooling systems for high density packaging. Revue Générale de Thermique 1998, 37, 781–789. [Google Scholar]
  4. Kwon, O.K.; Choi, M.J.; Choi, Y.J. Heat transfer and pressure drop characteristics in zigzag channel angles of printed circuit heat exchangers. Korean J. Air-Cond. Refrig. Eng 2009, 21, 475–482. [Google Scholar]
  5. Nikitin, K.; Kato, Y.; Ngo, N. Printed circuit heat exchanger thermal-hydraulic performance in supercritical CO2 experimental loop. Int. J. Refrig 2006, 29, 807–814. [Google Scholar]
  6. Peng, X.F.; Peterson, G.P. Convective heat transfer and flow friction for water flow in microchannel structures. Int. J. Heat Mass Transf 1995, 39, 2599–2608. [Google Scholar]
  7. Lee, J.; Mudawar, I. Assessment of the effectiveness of nanofluids for single-phase and two-phase heat transfer in micro-channels. Int. J. Heat Mass Transf 2007, 50, 452–463. [Google Scholar]
  8. Qu, W.; Mudawar, I. Experimental and numerical study of pressure drop and heat transfer in a single-phase micro-channel heat sink. Int. J. Heat Mass Trans 2002, 45, 2549–2565. [Google Scholar]
  9. Shen, S.; Xu, J.L.; Zhou, J.J.; Chen, Y. Flow and heat transfer in microchannels with rough wall surface. Energy Convers. Manag 2006, 47, 1311–1325. [Google Scholar]
  10. Rachkovskij, D.A.; Kussul, E.M.; Talayev, S.A. Heat exchange in short microtubes and micro heat exchangers with low hydraulic losses. Micro. Technol 1998, 4, 151–158. [Google Scholar]
  11. Kang, S.W.; Tsen, S.C. Analysis of effectiveness and pressure drop in micro cross-flow heat exchanger. Appl. Therm. Eng 2007, 5–6, 877–885. [Google Scholar]
  12. Ngo, L.; Katoa, Y.; Nikitina, K.; Tsuzukia, N. New printed circuit heat exchanger with S-shaped fins for hot water supplier. Exp. Therm. Fluid Sci 2006, 30, 811–819. [Google Scholar]
  13. Tsuzuki, N.; Kato, Y.; Ishizuka, T. High performance printed circuit heat exchanger. Appl. Therm. Eng 2007, 30, 1702–1707. [Google Scholar]
  14. Ma, T.; Zeng, M.; Luo, T. Numerical study on thermo-hydraulic performance of an offset-bubble primary surface channels. Appl. Therm. Eng 2013, 61, 44–52. [Google Scholar]
  15. Ma, T.; Xin, F.; Li, L. Effect of fin-endwall fillet on thermal hydraulic performance of airfoil printed circuit heat exchanger. Appl. Therm. Eng 2015. [Google Scholar] [CrossRef]
  16. Ma, T.; Li, L.; Xu, X.; Chen, Y.; Wang, Q. Study on local thermal-hydraulic performance and optimization of zigzag-type printed circuit heat exchanger at high temperature. Energy Convers. Manag 2015. [Google Scholar] [CrossRef]
  17. Baek, S.W.; Lee, C.K.; Jeong, S.K. Effect of flow maldistribution and axial conduction on compact microchannel heat exchanger. Cryogenics 2014, 60, 49–61. [Google Scholar]
  18. Bartel, N.; Chen, M.; Utgikar, V.P. Comparative analysis of compact heat exchangers for application as the intermediate heat exchanger for advanced nuclear reactors. Ann. Nucl. Energy 2015, 81, 143–149. [Google Scholar]
  19. Figley, J.; Sun, X.; Mylavarapu, S.K. Numerical study on thermal hydraulic performance of a Printed Circuit Heat Exchanger. Prog. Nucl. Energy 2013, 68, 89–96. [Google Scholar]
  20. Kim, T.H.; Kwon, J.G.; Yoon, S.H. Numerical analysis of air-foil shaped fin performance in printed circuit heat exchanger in a supercritical carbon dioxide power cycle. Nucl. Eng. Des 2015, 288, 110–118. [Google Scholar]
  21. Koo, G.W.; Lee, S.M.; Kim, K.Y. Shape optimization of inlet part of a printed circuit heat exchanger using surrogate modeling. Appl. Therm. Eng 2014, 72, 90–96. [Google Scholar]
  22. Mylavarapu, S.K.; Sun, X.; Glosup, R.E. Thermal hydraulic performance testing of printed circuit heat exchangers in a high-temperature helium test facility. Appl. Therm. Eng 2014, 65, 605–614. [Google Scholar]
  23. Xu, X.; Ma, T.; Li, L. Optimization of fin arrangement and channel configuration in an airfoil fin PCHE for supercritical CO2 cycle. Appl. Therm. Eng 2014, 70, 867–875. [Google Scholar]
  24. Yoon, S.H.; NO, H.C.; Kang, G.B. Assessment of straight, zigzag, S-shape, and airfoil PCHEs for intermediate heat exchangers of HTGRs and SFRs. Nucl. Eng. Des 2014, 270, 334–343. [Google Scholar]
  25. Yoon, S.J.; Sabharwall, P.; Kim, E.S. Numerical study on crossflow printed circuit heat exchanger for advanced small modular reactors. Int. J. Heat Mass Transf 2014, 70, 250–263. [Google Scholar]
  26. Jeong, C.H.; Kim, H.R.; Ha, M.Y. Numerical investigation of thermal enhancement of plate fin type heat exchanger with creases and holes in construction machinery. Appl. Therm. Eng 2014, 62, 529–544. [Google Scholar]
  27. Kim, I.H.; Sun, X. CFD study and PCHE design for secondary heat exchangers with FLiNaK-Helium for SmAHTR. Int. J. Nucl. Eng. Des 2014, 270, 325–333. [Google Scholar]
  28. Kim, I.H.; NO, H.C. Thermal hydraulic performance analysis of a printed circuit heat exchanger using a helium-water test loop and numerical simulations. Appl. Therm. Eng 2011, 31, 4064–4073. [Google Scholar]
  29. Kim, I.H.; NO, H.C. Thermal-hydraulic physical models for a Printed Circuit Heat Exchanger covering He, He-CO2 mixture, and water fluids using experimental data and CFD. Exp. Therm. Fluid Sci 2013, 48, 213–221. [Google Scholar]
  30. Cowell, T.A. A general method for the comparison compact heat transfer surfaces. J. Heat Transf. ASME 1990, 112, 288–294. [Google Scholar]
  31. Shah, R.K. Assessment of modified Wilson plot techniques for obtaining heat exchanger design data. Heat Transf 1990, 5, 51–56. [Google Scholar]
  32. Kays, W.M.; London, A.L. Compact Heat Exchangers, 2nd ed; McGraw-Hill: New York, NY, USA, 1964. [Google Scholar]
  33. ANSI/ASME PTC 19.1, Measuring Uncertainty; The American Society of Mechanical Engineers: New York, NY, USA, 1998.
  34. Taylor, B.N.; Kuyatt, C.E. Guidelines for Evaluating and Expressing the Uncertain of NIST Measurement Results; NIST Technical Note 1297; NIST: Gaithersburg, MD, USA, 1994. [Google Scholar]
  35. Wilson, E.E. A basis for rational design of heat transfer apparatus. J. Heat Transf. ASME 1915, 37, 47–82. [Google Scholar]
  36. Manglik, R.M.; Bergles, A.E. Heat Transfer Enhancement of Intube Flows in Process Heat Exchangers by Means of Twisted-tape Inserts; Report No. HTL-18; Heat Transfer Laboratory, Rensselaer Polytechnic Institute: Troy, NY, USA, 1991. [Google Scholar]
  37. Hesselgreaves, J.E. Compact Heat Exchangers; Pergamon: Edinburgh, UK, 2001. [Google Scholar]
Figure 1. Flow cross-section of a printed circuit heat exchanger (PCHE) fabricated using diffusion bonding [1].
Entropy 17 03438f1
Figure 2. Photos of the metal-plates with straight middle sections. (A) Hot-side plate; (B) Cold-side plate.
Entropy 17 03438f2
Figure 3. The stack layer and the flow pattern in the microchannel printed circuit heat exchanger (PCHE). (A) PCHE#1 (3 hot/4 cold); (B) PCHE#2 (5 hot/6 cold); (C) Flow configuration.
Entropy 17 03438f3
Figure 4. The final shape of the microchannel printed circuit heat exchanger (PCHE). (A) The final shape of the PCHE; (B) Detail design drawing sheet.
Entropy 17 03438f4
Figure 5. Cross-sectional view of a microchannel printed circuit heat exchanger (PCHE) fabricated through the diffusion-bonding method.
Entropy 17 03438f5
Figure 6. Schematic diagram and photograph of the experimental setup. (A) Photograph of the experimental setup; (B) Flow diagram of the experimental setup.
Entropy 17 03438f6
Figure 7. Heat balance between hot and cold sides.
Entropy 17 03438f7
Figure 8. Average heat transfer rate and the heat performance (UA) with the same Reynolds number on hot and cold sides. (A) Average heat transfer rate vs. Reynolds number; (B) UA vs. Reynolds number.
Entropy 17 03438f8
Figure 9. Influence of flow configuration (countercurrent vs. parallel). (A) Average heat transfer rate vs. Reynolds number; (B) Heat performance (UA) vs. Reynolds number.
Entropy 17 03438f9
Figure 10. Influence of stacked lamination (PCHE#1 vs. PCHE#2). (A) Average heat transfer rate vs. Reynolds number; (B) Heat performance (UA) vs. Reynolds number.
Entropy 17 03438f10
Figure 11. Typical modified Wilson plot results for the calibration of the cold-side heat transfer coefficient.
Entropy 17 03438f11
Figure 12. Comparision of suggested correlations and experimental data for hot-side heat transfer coefficients. (A) Heat transfer coefficient; (B) Nusselt number.
Entropy 17 03438f12
Figure 13. Pressure drop vs. Reynolds number in all experiments. (A) Difference in inlet temperature; (B) Difference in number of lamination layers.
Entropy 17 03438f13
Figure 14. Comparison of the friction factor correlation and experimental data for the microchannel printed circuit heat exchanger (PCHE).
Entropy 17 03438f14
Figure 15. Comparison of the proposed j-factor and f-factor correlation with previous correlations.
Entropy 17 03438f15
Table 1. Microchannel printed circuit heat exchanger (PCHE) Specifications.
Metal-plate materialSUS304L
Dimensions of PCHE (W × L × H), mm141 × 40 × 16
Dimensions of plates (W × L × H), mm141 × 40 × 1
Dimensions of end plates (W × L × H), mm141
Number of platesHot side3, 5
Cold side4, 6
Number of channels per plate22
Channel width800 μm
Land (solid) width600 μm
Channel height600 μm
Table 2. Parameters and estimated uncertainty.
ParametersUncertainty (%)
Temperature, T0.6
Pressure drop, ΔP0.92
Flow rate of hot side, m ˙ h1.19
Flow rate of cold side, m ˙ c0.94
Averaged heat transfer rate, Qm1.19
Reynolds number of hot side3.13
Reynolds number of cold side3.29
Heat transfer coefficient of hot side7.36
Heat transfer coefficient of cold side7.31
Friction factor, f5.8

