1. Introduction
The analysis of complexity measures of genomic sequences is one of the pre-processing techniques that can lead to better pattern recognition and pattern inference in DNA (a type of nucleic acid called deoxyribonucleic acid) sequences. The authors are engaged in active research regarding the development of new techniques based on bioinspired intelligence (that is, artificial intelligence techniques that emulate up to a certain point, or are inspired from, the processes behind living organisms), to analyze genomic data and their different relationships with other types of biological data (as found in medical diagnosis and medical imagery).
The objective of the paper is to show that gene-prediction location (
i.e., determining whether a subsequence of genomic data corresponds to a particular gene) is possible by means of measures based on information (or data) complexity. Entropy has been used recently as input for data mining [
1], and this study explores techniques based not only on entropy, but on a number of data complexity measures. The paper discusses previous work, outlines some complexity measures and proposes a predictor based on clustering the complexity results. This predictor is then tested on a variety of datasets to show that, in effect, prediction is possible. This research does not delve into the biological and biochemical details regarding different types of genes, since our analysis is performed over the genomic sequence. Thus, predicting based on genomic characteristics (such as codons, exons and introns) is not within the scope of this research. As mentioned below, this research addresses the genomic sequence as such, without the use of genetic structures.
In previous work [
2], presented at the International Workshop and Conference on Bioinspired Intelligence, held in Costa Rica, it was shown that complexity metrics along a sequence can be used as an indicator of the presence (or absence) of patterns that correspond to genes. That initial study of the usage of complexity metrics showed that certain statistical properties of the sequence of complexity measures were significantly different for the subsequences that contained genes than for subsequences that did not contain genes, in spite of being tested on a relatively small dataset. Therefore, these results suggest that it is worth pursuing these types of transformations even further, to convey information more precisely for the computational intelligence algorithms to be developed as part of future research. Nekturenko and Makova have shown that it is possible to compute the potential of a genomic region with a comparative interspecies technique [
3], whereas the present study shows that that potential can be approximated without a comparative technique.
This paper is divided into six sections, starting with an exploration of the complexity analysis of nucleic acids over the years. It is worth noting that this has not been, however, a very active research topic within entropy and complexity analysis itself. The second section summarizes recent work on the topic. The following section describes, from a mathematical point of view, the complexity measures selected and discusses the reasons for the selection of measures. In Section 4, certain basic concepts of human DNA and details about the databases used in the study are described, and in Section 5, the predictor model is outlined. Finally, Section 6 contemplates an experimental process in which the hypothesis that prediction is possible is tested with a variety of datasets from the human genome, and the reference gene locations that are tested were taken from the RefSeq database (
http://www.ncbi.nlm.nih.gov/RefSeq/).
As a general framework, the present study uses the notion of data complexity derived from complex adaptive systems (due to the fact that genomic architecture defines complex behavior), as mentioned by Neil [
4], in which a complex adaptive system has some (or all) of the following attributes: (1) the number of parts in the system and the number of relations between the parts is non-trivial (even though there is no general rule to separate trivial from non-trivial); (2) the system has memory or feedback; (3) the system can adapt itself according to its history; (4) the relations between the system and its environment are non-trivial or non-linear; (5) the system can be influenced by, or can adapt itself to, its environment; and (6) the system is highly sensitive to initial conditions. As a complex system, biological life, encoded by DNA, fulfills all six attributes in the following way: (1) DNA contains large amounts of genes, and the relationship between genes is not yet fully understood; (2) most DNA and genetic expressions depend on previous events; (3) genes can adapt very easily to different conditions; (4) the relationship between genes, DNA and the environment is just being understood; (5) genes and DNA can be influenced by, or can adapt themselves to, their environment; and (6) gene expressions are sensitive to initial conditions and environmental factors.
2. Previous Work in DNA Complexity Study
Here, DNA complexity is a term used to refer to all research regarding the computation and application of complexity measures to sequences of DNA (or other nucleic acids) carried out to explain biological processes or to transform data for later use. Furthermore, the computation of DNA complexity can be used for general research analysis.
DNA complexity has been studied throughout the years, even when computational tools were not yet mainstream in genetics research. In 1974 [
5], one of the first techniques for nucleic acid complexity was developed by counting the amount of hybrid DNA-RNA sequences produced by an embryo. In 1982, Hough-Evans proposed a technique based on chromatography to reveal repetitive patterns in single-celled bacterial organisms [
6], thus providing a fairly visual technique for DNA and organism complexity.
The discovery (and use) of repetitive patterns in DNA and progress in computational and numerical tools, as well as the availability of sequenced genomes triggered a set of computational calculations [
7]. Gusev and others evaluated genetic complexity by finding the amount of repetitive sequences (commonly interpreted as regulatory DNA) with a Lempel–Ziv measure [
8]. The role of protein-coding DNA and regulatory DNA has been understood only recently and provides insight into the belief that organism complexity is related to the amount of “extra” DNA [
9]. Entropy is a common measure applied to DNA, when referring to the randomness and structure of the data. Schmitt [
10] explores the statistical estimation of the information content of DNA, while Crochemore and Vérin show that there are zones with low entropy (structured data) within DNA [
11]. Additional research proved that, in effect, natural DNA has lower entropy than laboratory-synthesized DNA [
12]. Lanctot [
13] estimates DNA entropy by the use of an algorithm based on language parsers, treating DNA as a finite state machine. Koslicki works out the geometric version of entropy and applies it to DNA [
14].
The use of profiles based on complexity measures is not new. Profile analysis of genomic sequences using linguistic complexity (a type of Lempel–Ziv) was proposed by Troyanskaya [
15]. Lempel–Ziv complexity and compressibility have also been used outside genomic studies. Xiao and others use Lempel–Ziv to predict a protein sequence location within a cell [
16]. Ferenets and others [
17] compared different types of entropy, Lempel–Ziv complexity and fractal dimension to electroencephalograms of patients under anesthesia with the standard clinical depth of sedation score. Aboy, in 2006, used Lempel–Ziv to estimate the bandwidth and harmonic variability of diverse quasi-periodic signals recorded for biomedical purposes [
18].
Other studies have approached genomic complexity (complexity based not only on DNA, but also on other nucleic acids) by interpreting the nucleic acid sequence as a fractal. Berthelsen analyzed genomic sequences as a four-dimensional random walk and computed the resulting fractal dimension, which turned out to be significantly lower than sequences of genomic data generated randomly [
19]. Concerning the physical structure (rather than the specific sequence), Ercolini and others computed the fractal dimension of DNA imaged under an atomic force microscope [
20]. Complexity analysis of the genomic data obtained has been done on RNA and certain types of bacterial DNA, but not on human chromosomes (which is the central point in this study).
A less-known complexity measure, known as the regularity index [
21], appears more promising, but will not be covered here. The regularity index is a generic variant of the index of maximum regularity, described as a new tool for computational analysis of DNA [
22]. The regularity index measures how regular a symbol sequence is and will be tested by the authors and reported on in a paper devoted to analyzing the relationship between regularity and complexity in DNA subsequences. This technique based on regularity could have better results, because the original version (the index of maximum regularity) has been used to detect chromosome telomeres [
23,
24] and genetic regularity in simple yeasts [
25] with high confidence. The role of information theory in molecular biology [
26], proteomics [
27] and genomics has currently been an active topic.
More recently, research has been oriented towards the usage of next-generation sequencers, and complexity analyses have not been done yet for these types of new data. This is due to: (1) the amounts of data produced, which pose difficulties for processing; and (2) the greater interest in more applied research regarding genomic data. As such, studies that use data from next-generation sequencers tend to be directed toward well-known computational and statistical techniques already in use by bioinformatics experts.
3. Measures for Data Complexity and Entropy
To be able to perform analyses of the values of complexity for a sequence of DNA, it was necessary to define certain measures (computable values) for data complexity and entropy (which can be considered a type of data complexity). Entropy is a measure of the order (or absence of order, to be precise) of a physical system (in the case of data, of bits); and data complexity is a generic term referring here to the variety of models, measures and techniques to indicate how “complex” a set of information is.
Lloyd has compiled lists of diverse techniques to measure and compare information complexity, and we have based our selection on his non-exhaustive list [
28], complemented by bibliographic research in medical, physics and mathematics journal archives.
Table 1 shows the complexity measures analyzed and indicates whether they are considered in the study or not. The selection criteria for the complexity measures were concise, with algebraic, arithmetic or statistical computation that would not require extensive programming and testing, to make it possible to perform the analysis on large datasets and with a variety of parameters. Thus, techniques based on integrals, derivatives and differential equations were not included here.
Fractal dimension is not included in this study because of difficulties in computing precise values for representations of DNA as a fractal (in spite of studies [
19,
20] indicating that fractal dimension would have good results).
3.1. Shannon Entropy
Information entropy, or Shannon entropy [
30], corresponds to how much a given set of information is unpredictable. If one can predict the next set of events, given the actual information, one has a low-entropy information set. Shannon entropy, denoted by
H(
S), is computed by:
where
P(
Si) is the relative frequency of character
i within string
S, with length
n.
As such, Shannon entropy is a basic measure of complexity, based on the frequency of event occurrence.
3.2. Statistical Complexity
Regarding statistical complexity, of which several measures were studied and analyzed by Feldman and Crutchfield [
31], and given the computation time constraints, the authors of this paper decided to opt for a measure that would require only statistical manipulations. Most statistical complexity measures require the computation of approximations of differential equations. The
CLMC measure is one which requires only statistical and algebraic manipulations to offer a measure for statistical complexity [
32]. It considers both the intrinsic entropy of the data and the departure of the probability of each symbol from uniformity (referred to as disequilibrium by the authors of the measure). Therefore, the
CLMC for a given string
S is defined by:
where
H is the Shannon entropy (defined above), and:
is the disequilibrium, where
n is the length of the sequence.
Since this measure is a derivation of Shannon entropy, it is an easily computable measure for large datasets (such as raw DNA data) and also returns measure values between zero and one.
3.3. Kolmogorov Complexity
Kolmogorov complexity is based on the concept that if a given sequence
S can be generated by an algorithm smaller than the length of the given sequence, then its complexity corresponds to the size of the algorithm. If a sequence is truly complex and random, the shortest representation is the sequence itself [
33]. These models were later refined by Chaitin when algorithmic information content was proposed [
34]. The issue is that Kolmogorov complexity itself is not computable. In the present study, the Lempel–Ziv approximation to Kolmogorov complexity was used. It quantifies the amount that a sequence (or a string of characters or symbols) can be compressed using the Lempel–Ziv–Welch algorithm [
35], which is the complexity measure used by Gusev [
8].
4. Characteristics of Human DNA
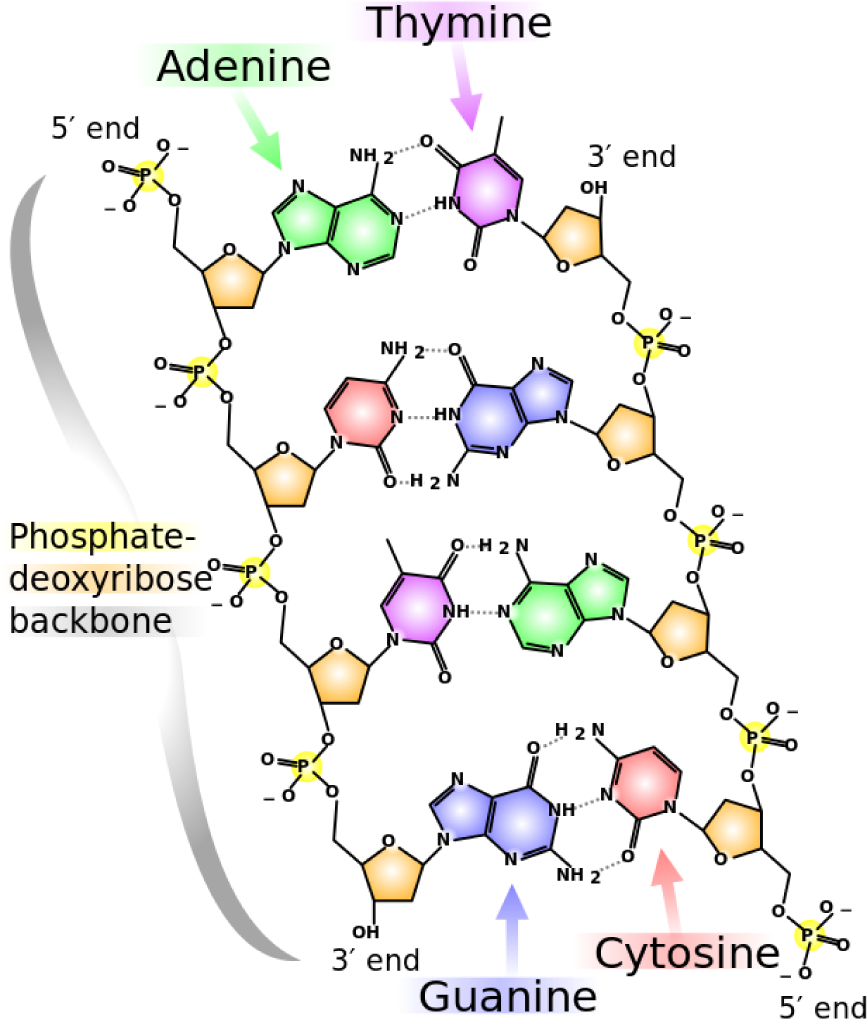
Human DNA is composed of 23 chromosomes (of diverse lengths) with an average of 30 to 200 million base pairs per chromosome (thus giving it a total of three billion base pairs). A base pair encodes a Watson–Crick complement (when a double-stranded molecular structure, such as DNA, is being described) with a letter, representing adenine, cytosine, guanine and thymine (and its respective complement), which are the molecules that form DNA in all species. “Base pair” can also refer to a unit of length that covers exactly one nucleic acid (and its complement). In
Figure 1, the chemical structure of DNA and the corresponding nucleotides (also called nucleic acids) are illustrated.
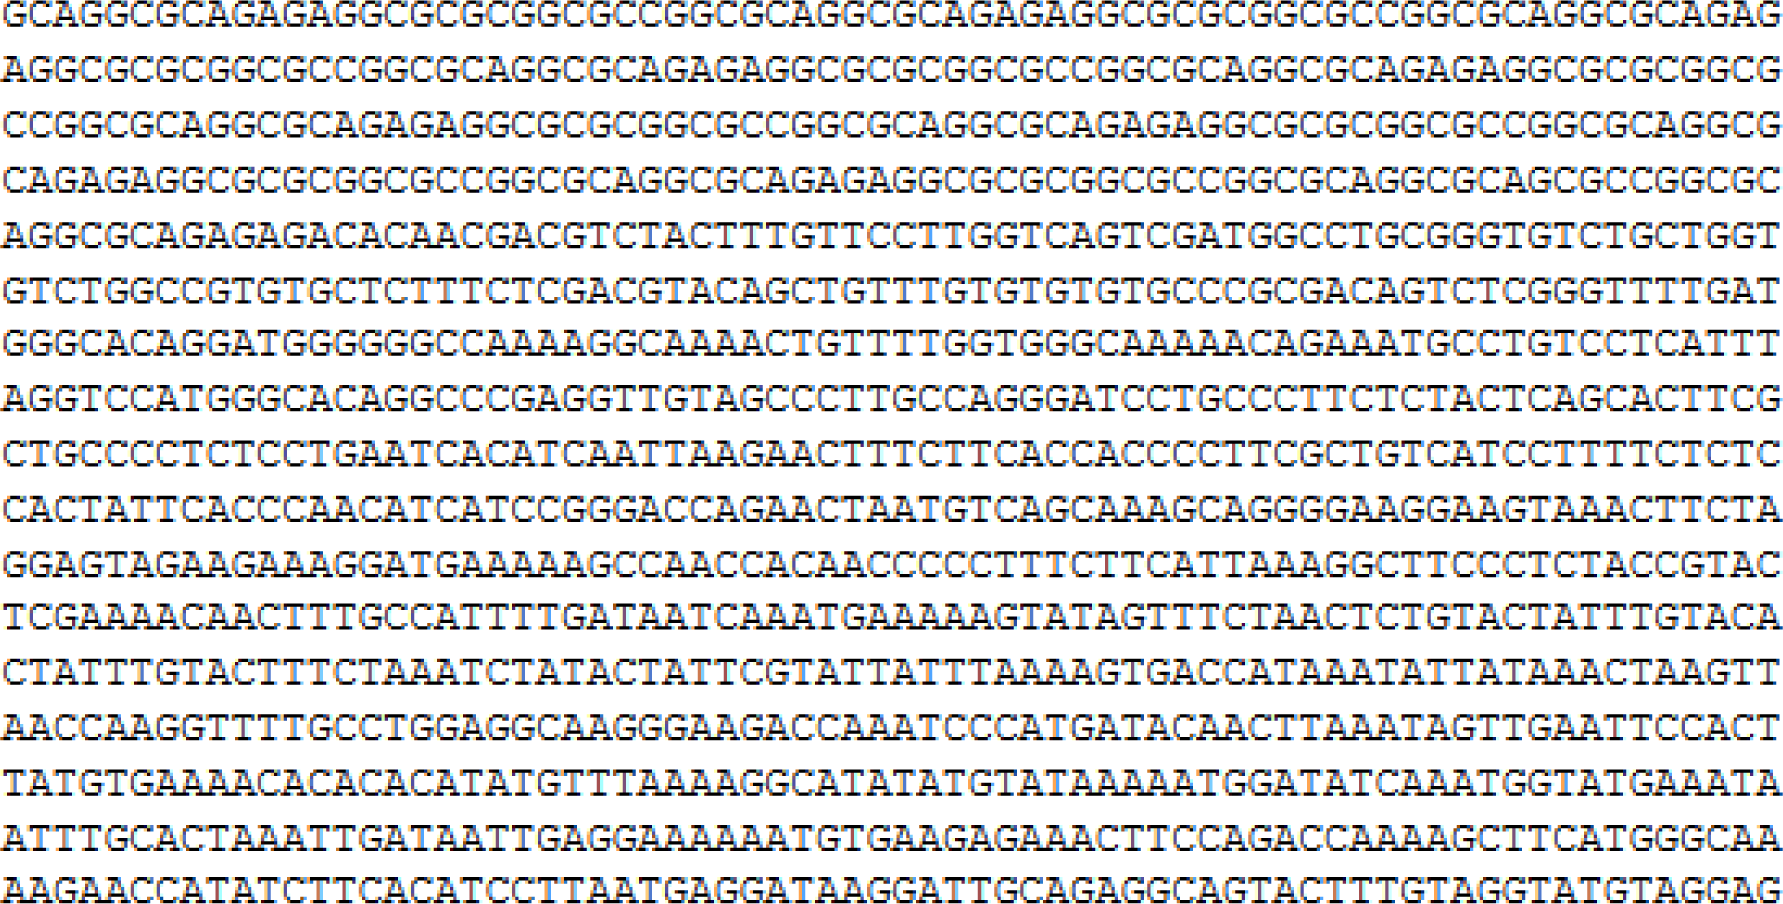
When a genome is sequenced, it means that either experts or machines have identified each base pair in the molecule of DNA, and that sequence of symbols (a letter for each nucleotide) is saved into databases as a sequence. In
Figure 2, a fragment that has been sequenced is illustrated.
It is over these types of sequences that the predictor operates, when performing the complexity measurements to determine whether it contains a gene or not.
5. Predictor Proposal
The present research has been based on the fact that there is some insight into genomic data complexity and information content to discern between gene-containing regions and those that do not contain genes, based solely on quantifiable information from complexity measures.
The intention of the study is to provide an automated technique to indicate, on a given sequence of base pairs corresponding to nucleic acids, whether subsequences correspond to genes or do not correspond to genes. Thus, the paper outlines a predictor of gene-coding zones by analyzing the different values of complexity measures that provide insight on whether the zone might correspond to a gene or not.
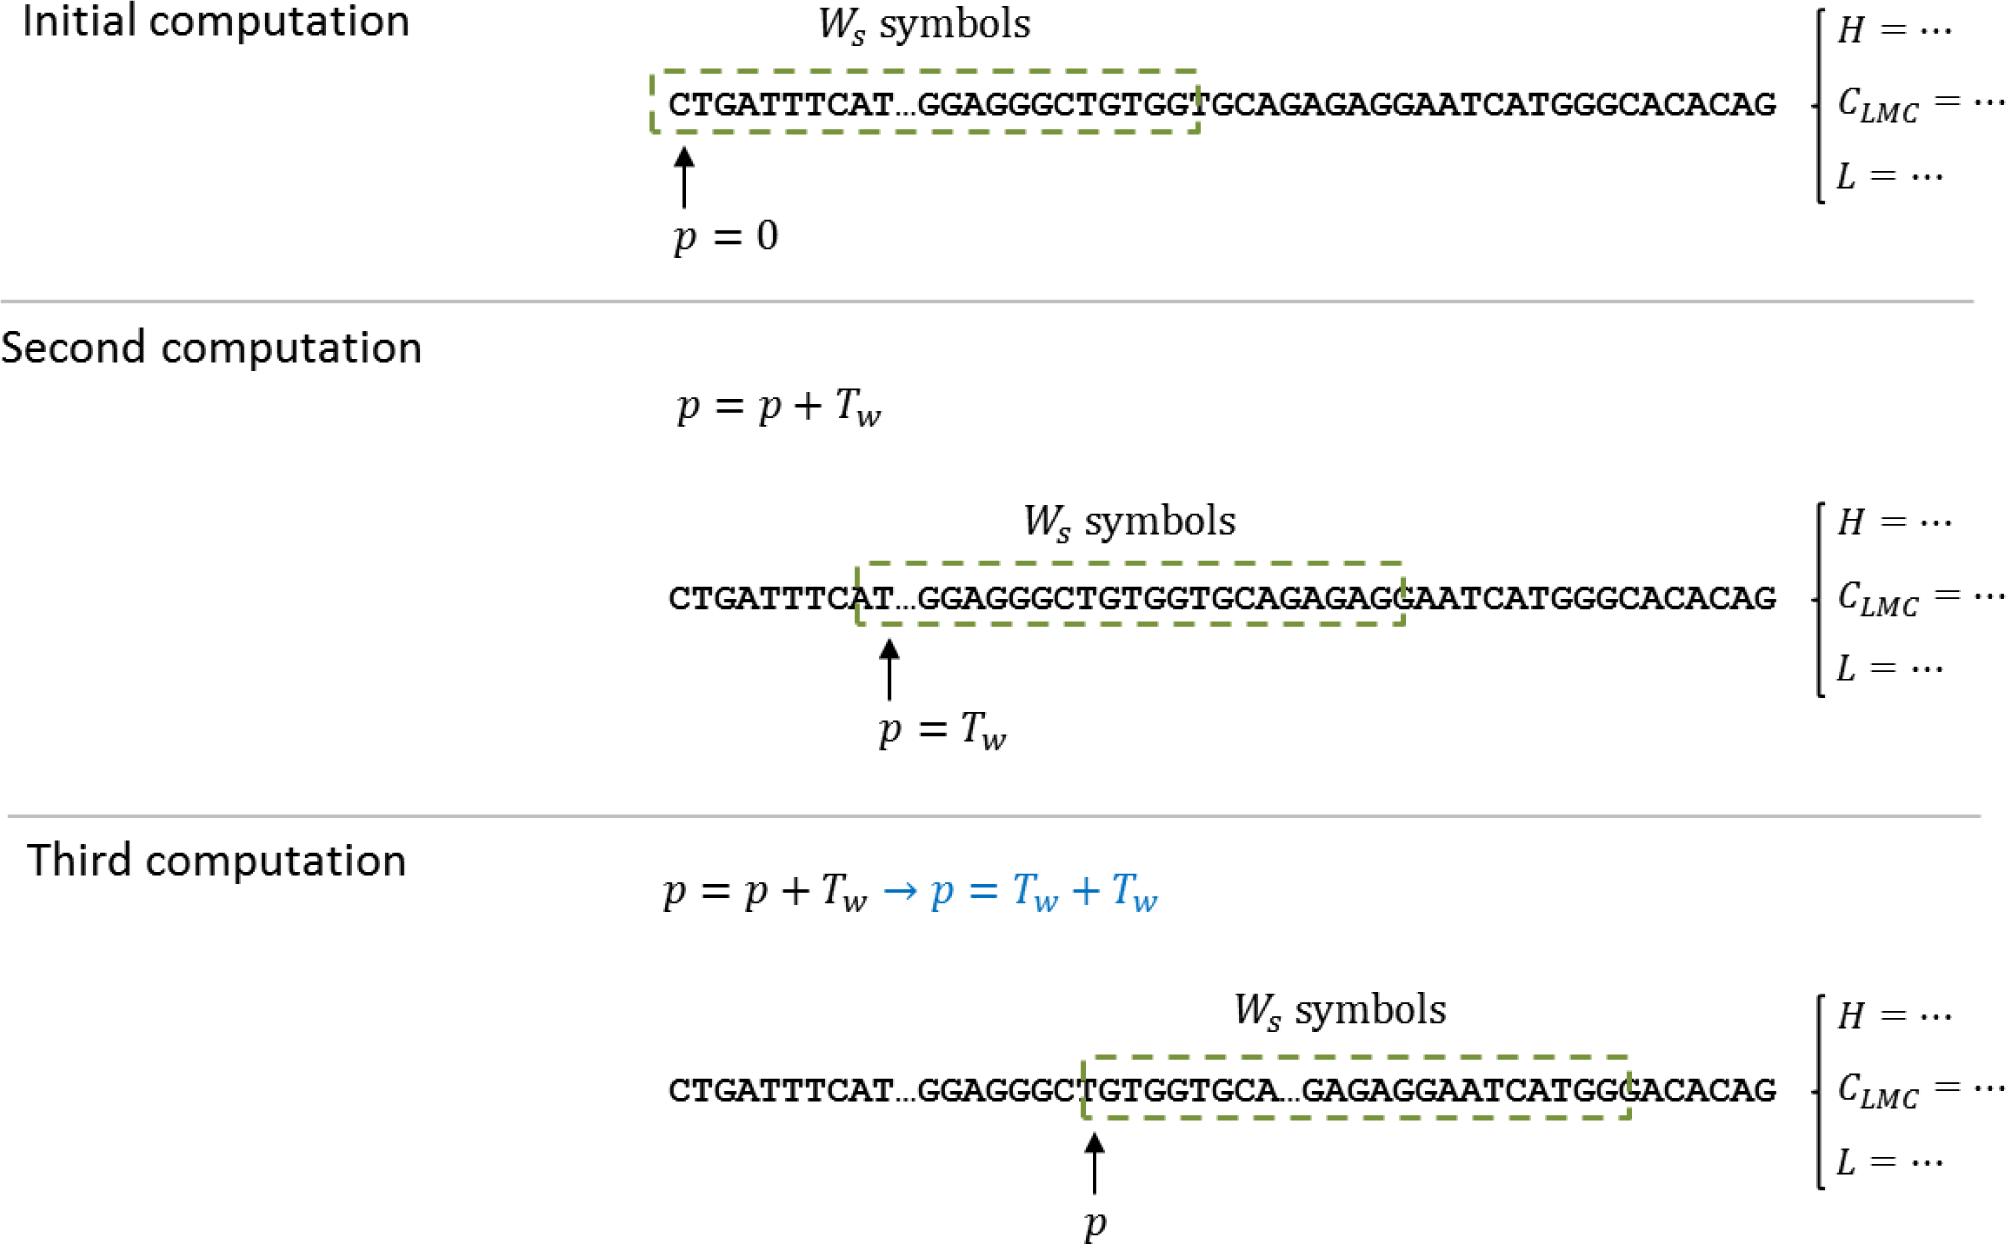
Since the calculation of complexity measures requires a set of data, and not one single value, a technique based on windows was selected to produce a sequence of measures for the DNA dataset. The computation of the complexity measures is done by a shifting window, called
W, of size
Ws. The measure is computed for the DNA subsequence, starting at position
p = 0 and with a length of
Ws. The resulting value is stored, for later processing, and the starting position is shifted
Tw, that is,
pnext =
p +
Tw; then, the computation continues until an end-of-string indicator has been triggered. As explained above, the predictor has two parameters (window size and window shift) and is evaluated for each complexity measure defined in Section 3.
Figure 3 illustrates the window process and how it manages to cover the entire sequence in less computational time.
In the earlier version of this work [
2], the classifier had its ranges for “gene” and “non-gene” established manually based on the standard deviation and mean; and it was used for the initial experimentation. However, an automated process for the establishment of the limit is necessary, to be able to function on all types of genomic data. Therefore, a technique to compute those ranges from the data obtained was deemed required, and among one-dimensional clustering and grouping techniques,
k-means clustering was found to be the simplest to compute for the given datasets. It was used to determine intervals for “coding” and “non-coding” zones, for each complexity measure being used, taking into account the knowledge of the measures developed for the preliminary version of this paper. Once the intervals were defined (varying, depending on window size), they were used to determine whether a given section of DNA is, in effect, “coding” or “non-coding”. As such, the threshold, which indicates whether a zone is “gene” or “non-gene,” is computed and updated as data are processed.
Finally, to merge results among the different complexity measures, a simple majority rule is used. If, for a given subsection, a majority of measures indicates that it is “coding,” it will be considered as such. Otherwise, to play it safe, a non-match condition will be found and reported as “non-coding.”
6. Experimental Work
The verification that entropy measures can accurately locate gene zones in human DNA requires developing a set of statistical and repetitive tests for the mechanism proposed in Section 3. It is divided into two sections: one devoted to a description of each of the three tests performed and another discussing the results and the corresponding analysis for each of the three experimental processes.
Predictor testing was developed by extracting known gene locations, comparing whether the gene locations match between the predicted set and the reference set, and computing statistical parameters, such as precision and recall. In this context, recall, indicated by R, is the fraction of returned zones that really correspond to known genes, where the whole is the set of the reference gene locations. Another term, precision, indicated by P, is the ratio, within returned gene zones, that correspond to known gene locations.
For all of the experimental processes, a curated and tested dataset (verified by researchers and in wide use) was selected. It was produced by the Genome Reference Consortium, tagged GRCh38[
36], corresponding to Release 38, dated December 24, 2013, which is the most recently updated assembly and used by both NCBI and UCSC. Each one of the 23 human chromosomes was annotated with known gene data and saved in the GenBank database with accessions NC_000001 to NC_000024.
6.1. Description of the Experimental Processes
To verify the feasibility of the proposed gene predictor based on DNA entropy variability, we conducted three experiments, using two different types of datasets to convey more precise and detailed results. We have also tested a variety of different moving window configurations to analyze the effect of window size.
It must be noted that the processes described here to verify the predictor are not classical experiments (i.e., there is no statistical testing with a given significance and no control groups). These experimental processes are used exclusively to show the feasibility of the predictor described in this paper.
6.1.1. Experiment 1 (Parameter Selection)
The first experiment addressed the effect of window size and window shift for gene-zone detection in human DNA. We used a portion of 1,000,000 base pairs from chromosome Y (NCBI RefSeq ID NC_000024 [
36]), containing 150 genes (thus covering more than 100 genes to obtain precise values for recall and precision). Recall and precision were computed for each test case, taking into account the selection of window sizes and shift parameters. Previous research [
22] suggests that window sizes (
Ws) cannot be too large, because that would extend the computation time, and it would not cover small genes. However, they cannot be too small, because large genes take a long time to be analyzed. Thus, a set of four options for window sizes was included in the experimental setup (250, 500, 1000, 2000). Regarding window shift (
Tw), a small window shift is more effective, but it requires larger computation times. The window shift has been set for
of the window size, and five more fixed values were selected. A window shift of 1, which results in a very slow computation, should provide exact matches, instead of approximations limited by the shift. Chromosome Y was selected because it was the one used for illustrative purposes in the conference version of this paper, with the objective of offering a comparable experiment, and it also offers certain characteristics in regard to entropy that were described by Koslicki [
14] in his study of the entropy of exons and introns (start and end nucleotide sequences found in identified genes). The proponents of the predictor discussed here are well aware of the issues regarding sex chromosomes and their differences with remaining chromosomes (such as their evolution [
37,
38], their variation in humans [
39] and their bias towards a specific sex [
40]). This then does not invalidate the experimental process of determining the best parameters for the computation.
For a match to be considered valid, to compute recall and precision, the difference between the reference and the predicted locations must be less than the defined window shift.
Table 2 illustrates how the matching process is performed for some sample cases, using a
Ws = 1000 and
Tw = 250.
To find these specific values, a number of preliminary trials were carried out to have a basis to define the representative values. The experiment also contemplates feedback discussed during the conference version of this publication.
The most effective combination (highest recall and precision) of window shift and size parameters has been used for Experiments 2 and 3, with the intention of having comparable data using the same factors.
6.1.2. Experiment 2 (Full Chromosome Prediction)
In the second case, a sequence of human DNA corresponding to chromosome 3 (NCBI RefSeq ID NC_000003 [
36]) has been chosen. It consists of 198 million base pairs (with a few gaps) and with known gene positions in a separate tag file. Window size (
Ws) and window shift (
Tw) are set to the values determined in Experiment 1. Chromosome 3 covers 2203 genes in a variety of lengths, making it appropriate for testing the predictor. The predictor, as it determines the classification ranges by an automated method, is aware of the variation in complexity among different chromosomes [
14].
6.1.3. Experiment 3 (Prediction for a Variety of Subjects)
For the third experiment, we used a subset of 100,000 base pairs from the start of chromosome Y for five different individuals, taken from the 1000 Genome Project [
41]; and we used the predictor to locate the gene-coding zones of all five individuals, and those zones were compared to the known gene locations taken from the reference sequence. This is the same region used in the conference version of this paper [
2].
6.2. Analysis of Results
Once the computational tasks are performed, it is essential to outline, describe and analyze the results for each of the three experimental processes designed to test the feasibility of the prediction of genes using complexity measures. For each case, at least one table of results is displayed, with a discussion of the results and how they are related to one another.
6.2.1. Experiment 1: Regarding Parameter Selection
The computation process for all twenty-four trials of the parameter selection experiment took less that an hour on a standard, four-core processor, using the given subset of 1,000,000 base pairs taken from human chromosome 3 for all trials.
Table 3 shows the computational results (in terms of recall and precision in matching against the reference locations) for window sizes
Ws = 250 and
Ws = 500; and
Table 4 describes the results for window sizes
Ws = 1000 and
Ws = 2000.
These results indicate that the window-size parameter has to be large enough to encompass a variety of features (for example, Ws ≤ 500 results in poor precision and recall, because most DNA subsections that code a gene are larger than 500 base pairs). In addition, the window-shift parameter has to permit certain overlapping (a large Tw tends to skip sections completely). The most effective combination, at least for human DNA, is Ws = 1000 and Tw = 250; with a large relative overlap between individual analysis and a medium-sized window, which covers small genes with no problem. As the data above suggest, using an elemental shift (Tw = 1) leads to exact matches to the genes.
Considering reverse recall (1 −
R) as the rate of false-positives for the predictor (
i.e., gene zones that do not have a corresponding gene in the reference location list), it can be observed that small window sizes tend to misclassify genomic data (due, perhaps, to the fact that in such small sections, there is no “pattern” that can be observed). As the data displayed in
Tables 3 and
4 show, when the window size parameter increases, this rate of false positives has a tendency to decrease.
6.2.2. Experiment 2: Regarding Full Chromosome Prediction
For the second experiment, which was performed over a full human chromosome (approximately 6% of the total genetic information in the human species) in blocks of 20,000,000 nucleotides (base pairs of genomic data), the results are also very satisfactory, taking into account that the processing time was under three hours. The prediction parameters were set to the values indicated by the experimental process and the results discussed in Section 6.2.1, which were Ws = 1000 and Tw = 250.
To compare results and to have a clear overview of the positive and negative matching, with the same parameters (window size and window shift), precision and recall were computed, for every section composed of twenty million base pairs, and tabulated in
Table 5. The data tested (
i.e., human chromosome 3) contain an approximation of 2000 genes, of different lengths and functions.
For a full chromosome, both recall and precision have low variability, and they have values close to one, thus indicating high-quality prediction and detection.
6.2.3. Experiment 3: Regarding Prediction for a Variety of Subjects
Short strands of genomic data from chromosome Y, taken from five subjects, were used to evaluate the prediction process for a variety of subjects. The region selected contains three known genes, and the predictor was expected to indicate the start and end locations of “potential genes.” Both the start location and the ending location for each “potential gene” among the five subjects correspond quite closely to the reference locations, indicating a good match. In
Table 6, a summary of the computation and comparison process is shown for these three genes and five subjects, with a total of fifteen matched zones.
Small variations can be observed among the five subjects tested and are within reasonable tolerances. A smaller window shift parameter (Tw) would have permitted greater precision in the establishment of the limits corresponding to each gene. However, what is outstanding here is that the predictor was able to match the locations without previous knowledge about the genes. Observe that the matched location is a multiple of the window shift chosen. As mentioned above, it was found that the most effective combination, at least for human DNA, is Ws = 1000 and Tw = 250, with a reasonable computation time.
7. Conclusions
Using the experimental results and, in particular, the recall and precision ratios for the cases considered, it can be shown that data complexity actually does offer a high-quality prediction for gene coding zones, for the case of human DNA. This result agrees with similar work in DNA complexity for simple organisms mentioned above. Automated analysis permits decision-making and grouping based solely on the characteristics of the data and results in different complexity measure values for coding and non-coding DNA zones.
Finally, these results suggest that future work should be directed toward analyzing other complexity measures (such as fractal dimension) and toward researching the potential of regularity measures, which may be better suited for DNA than classic information complexity. Furthermore, future studies can provide insight into more detailed genomic structures (parts of genes, parts of chromosomes) and determine whether a mutation is present. An interesting point to research is whether the existing principles behind genes (their structure, their known sequences, the existence of non-coding DNA) are compatible with the technique described in this paper. The use of data complexity algorithms specifically adapted for genomic data (such as Renyi continuous entropy [
29] and topological entropy [
14]) is also worth including in future versions of the predictor developed.


