
Application of Divergence Entropy to Characterize the Structure of the Hydrophobic Core in DNA Interacting Proteins


Abstract
:
1. Introduction
2. Theory
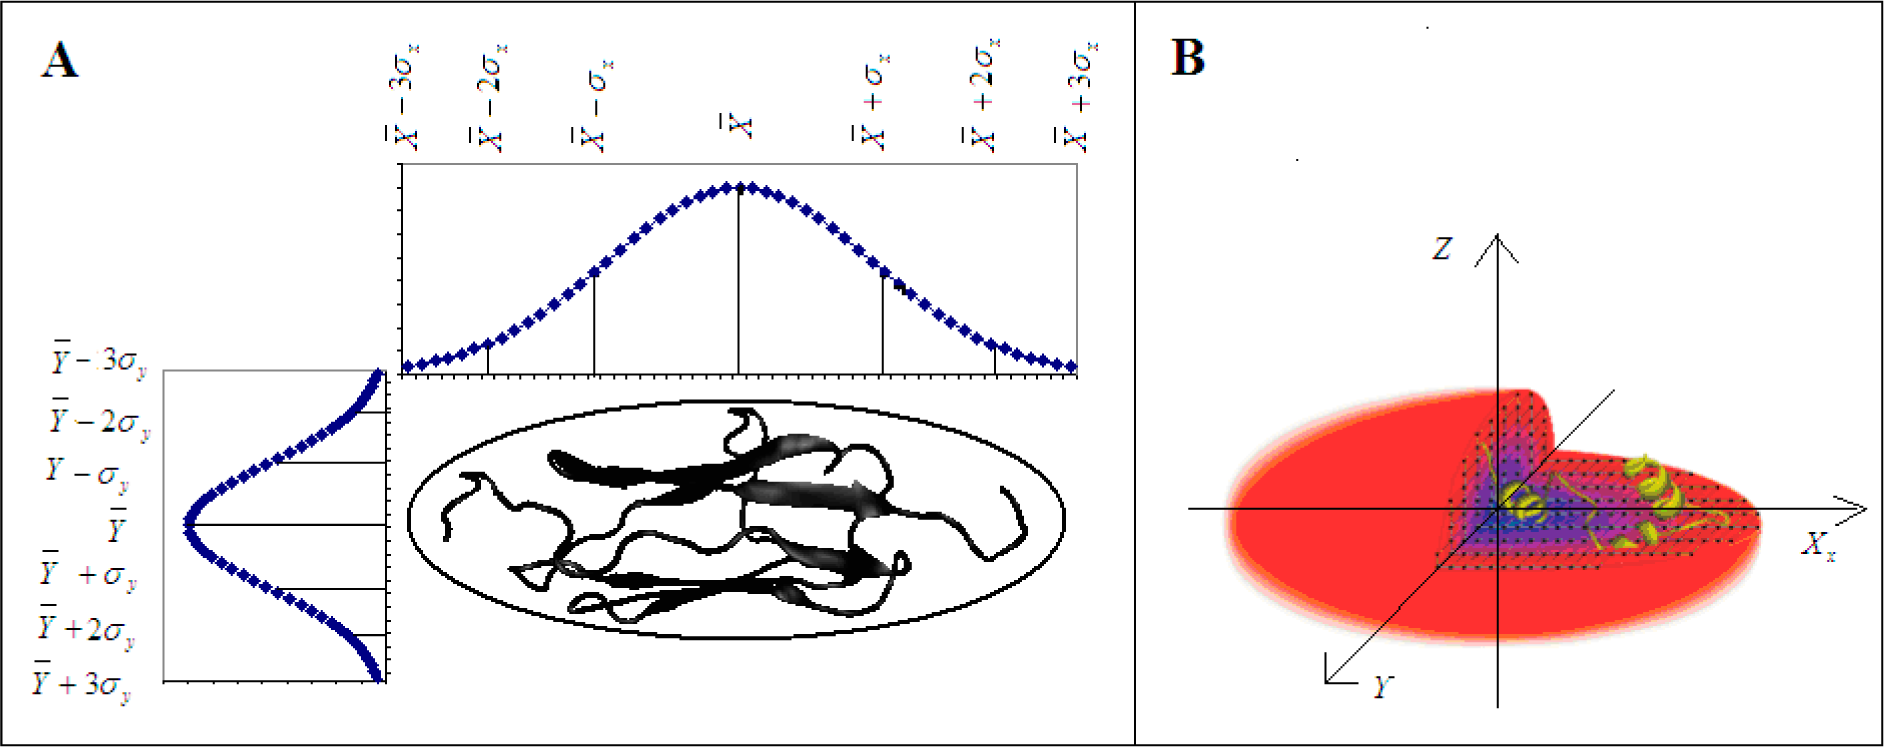
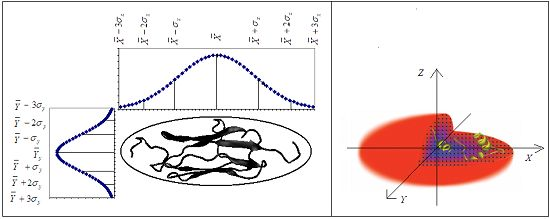
2.1. Background on Modeling the Hydrophobic Density
2.2. The Real Hydrophobic Distribution in a Protein Molecule
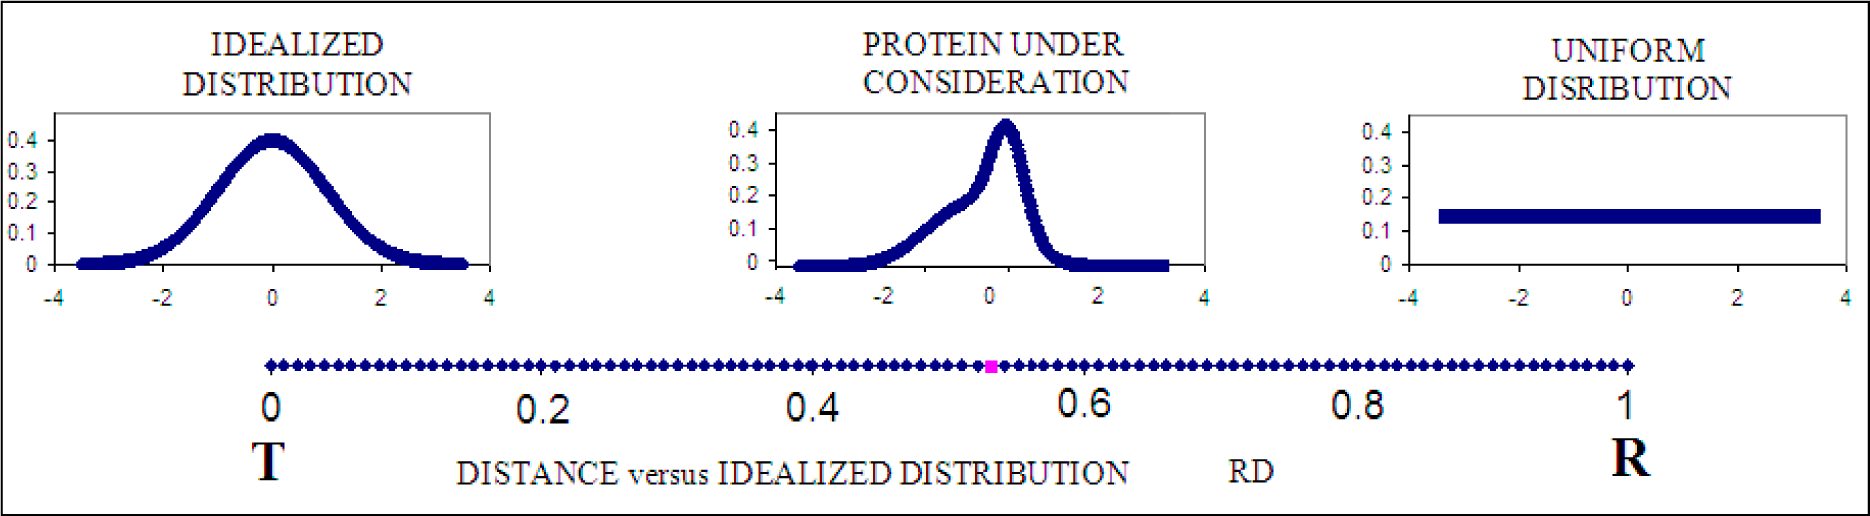
2.3. Measuring Differences between the Theoretical and Observed Distributions—the Role of Divergence Entropy
2.4. Determining the Status of Individual Fragments of the Polypeptide Chain
2.5. Determining the Biological Properties of Proteins Based on the Fuzzy Oil Drop Model
3. Materials and Methods
3.1. Data
3.2. DisProt Database
4. Results
4.1. ARID Domains
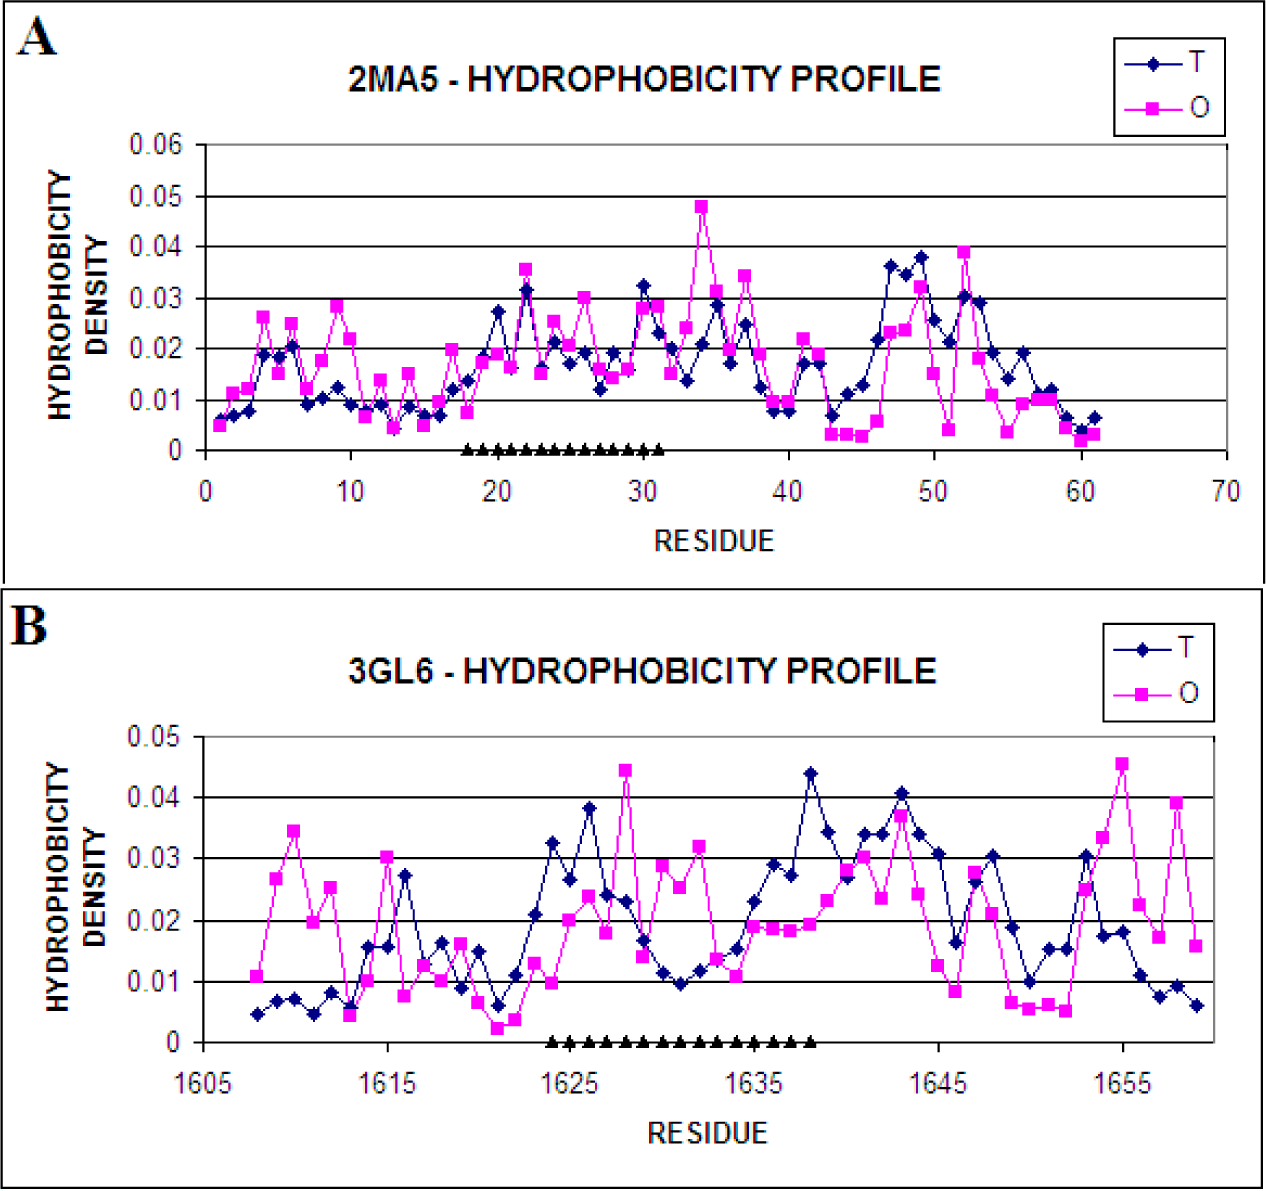
4.2. PHD Domains
4.3. C-terminal PHD Finger
4.4. Comparative Analysis
4.4.1. Sequence Analysis
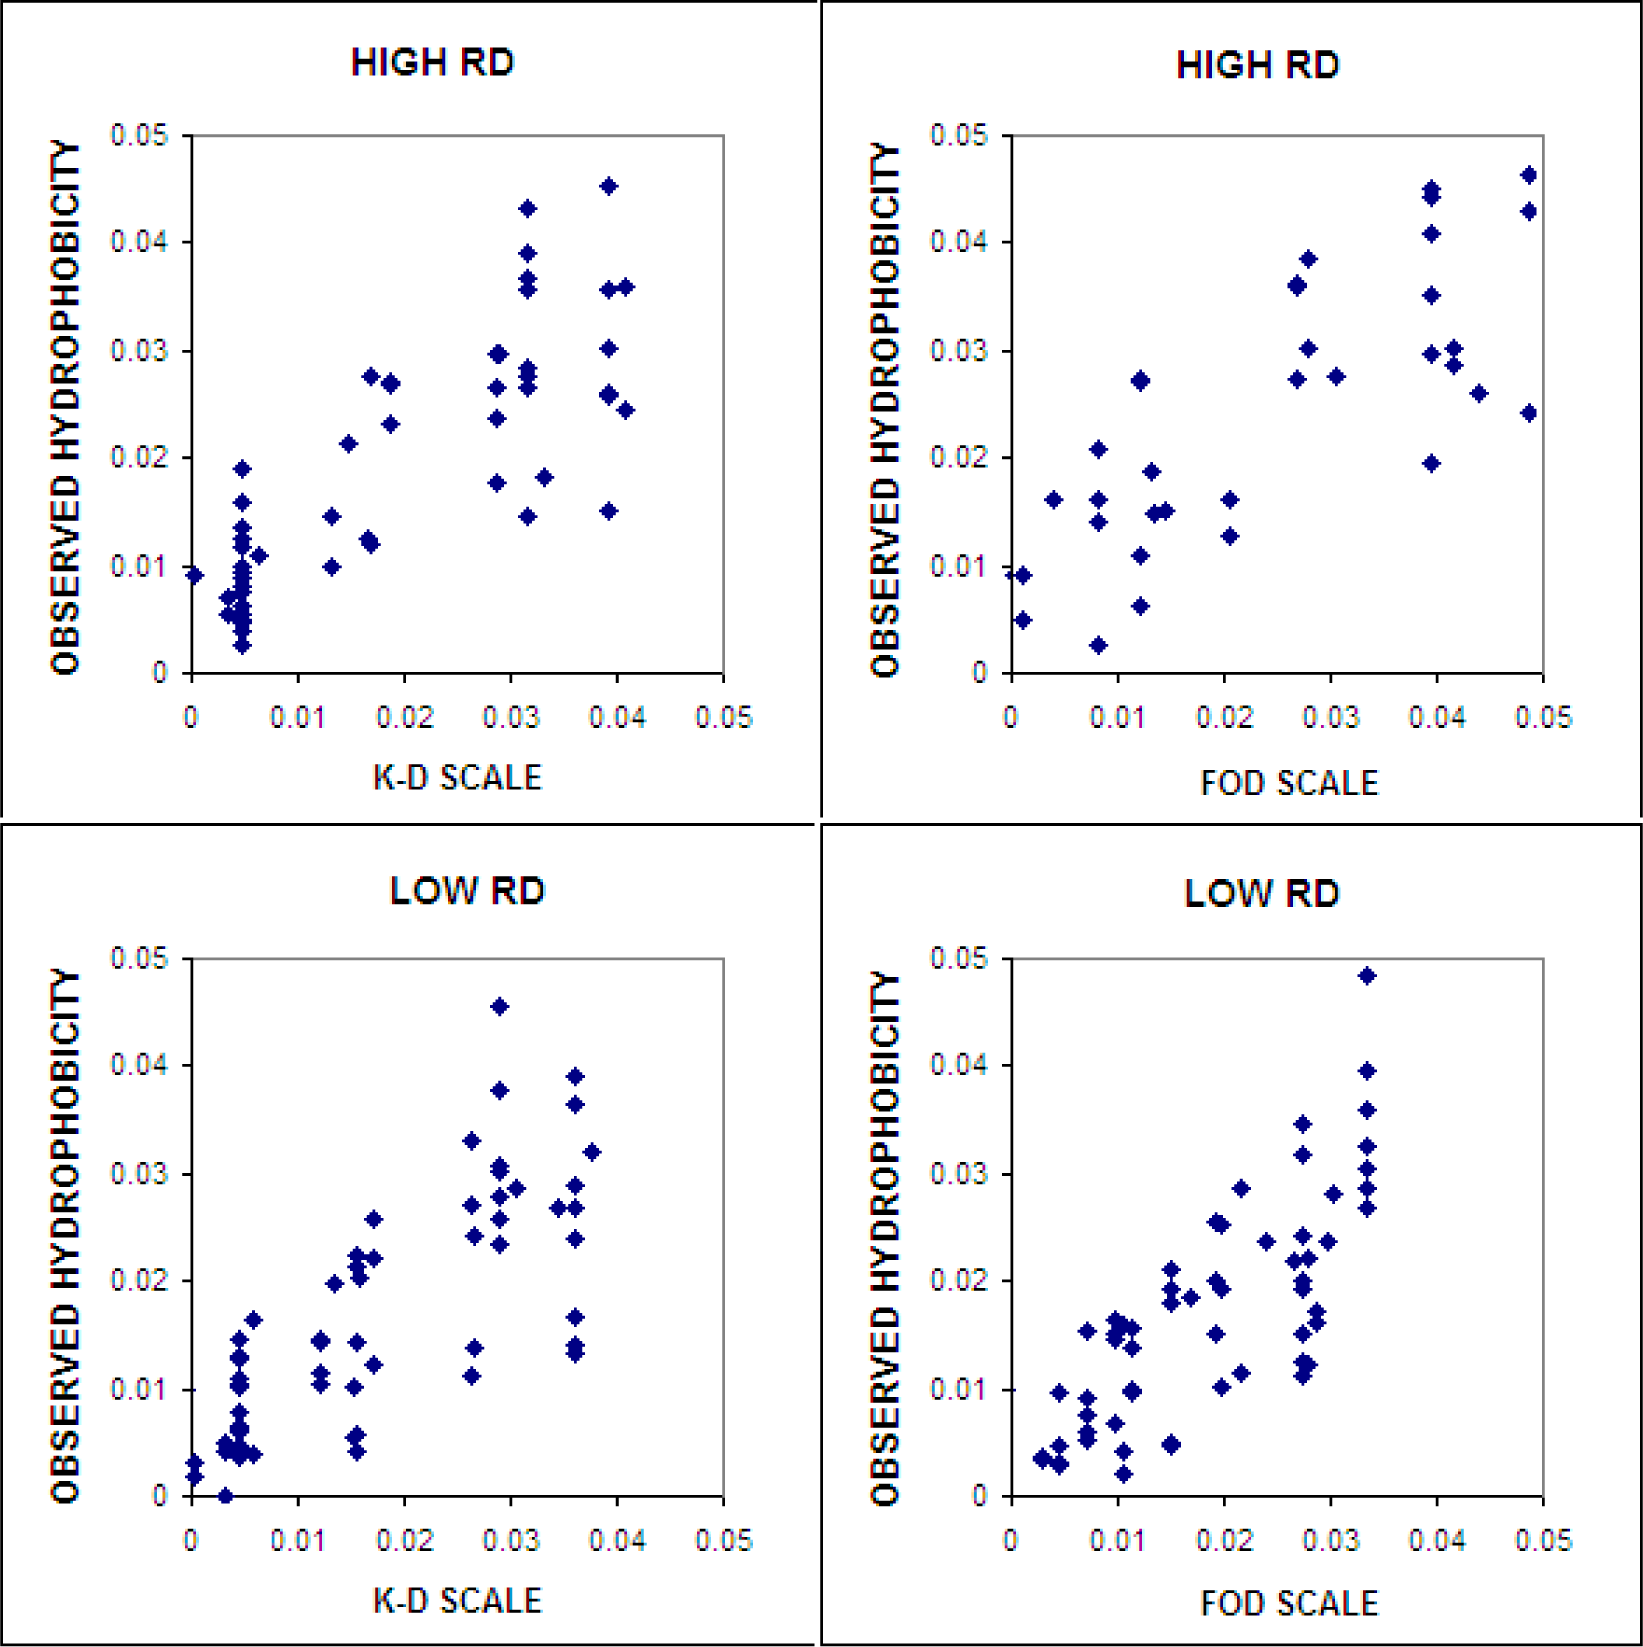
4.4.2. Different Hydrophobic Scales in the Fuzzy Oil Drop Model
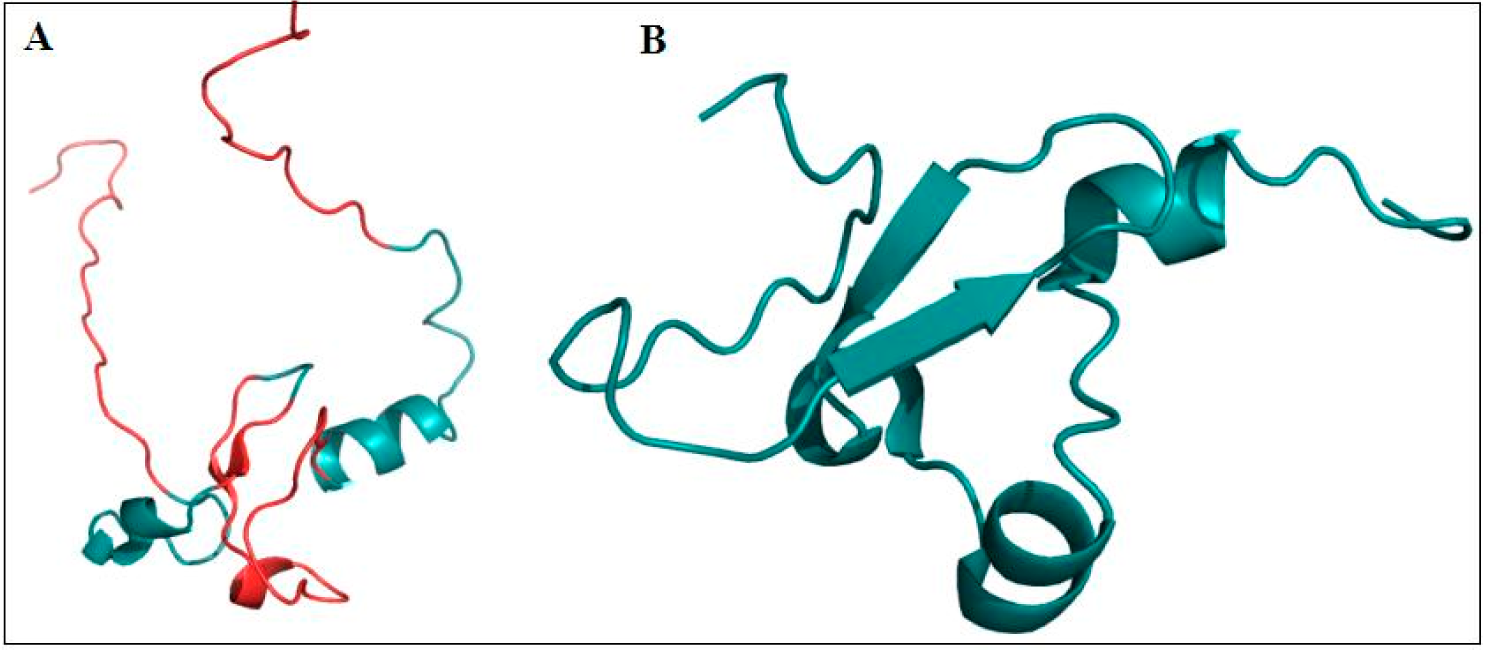
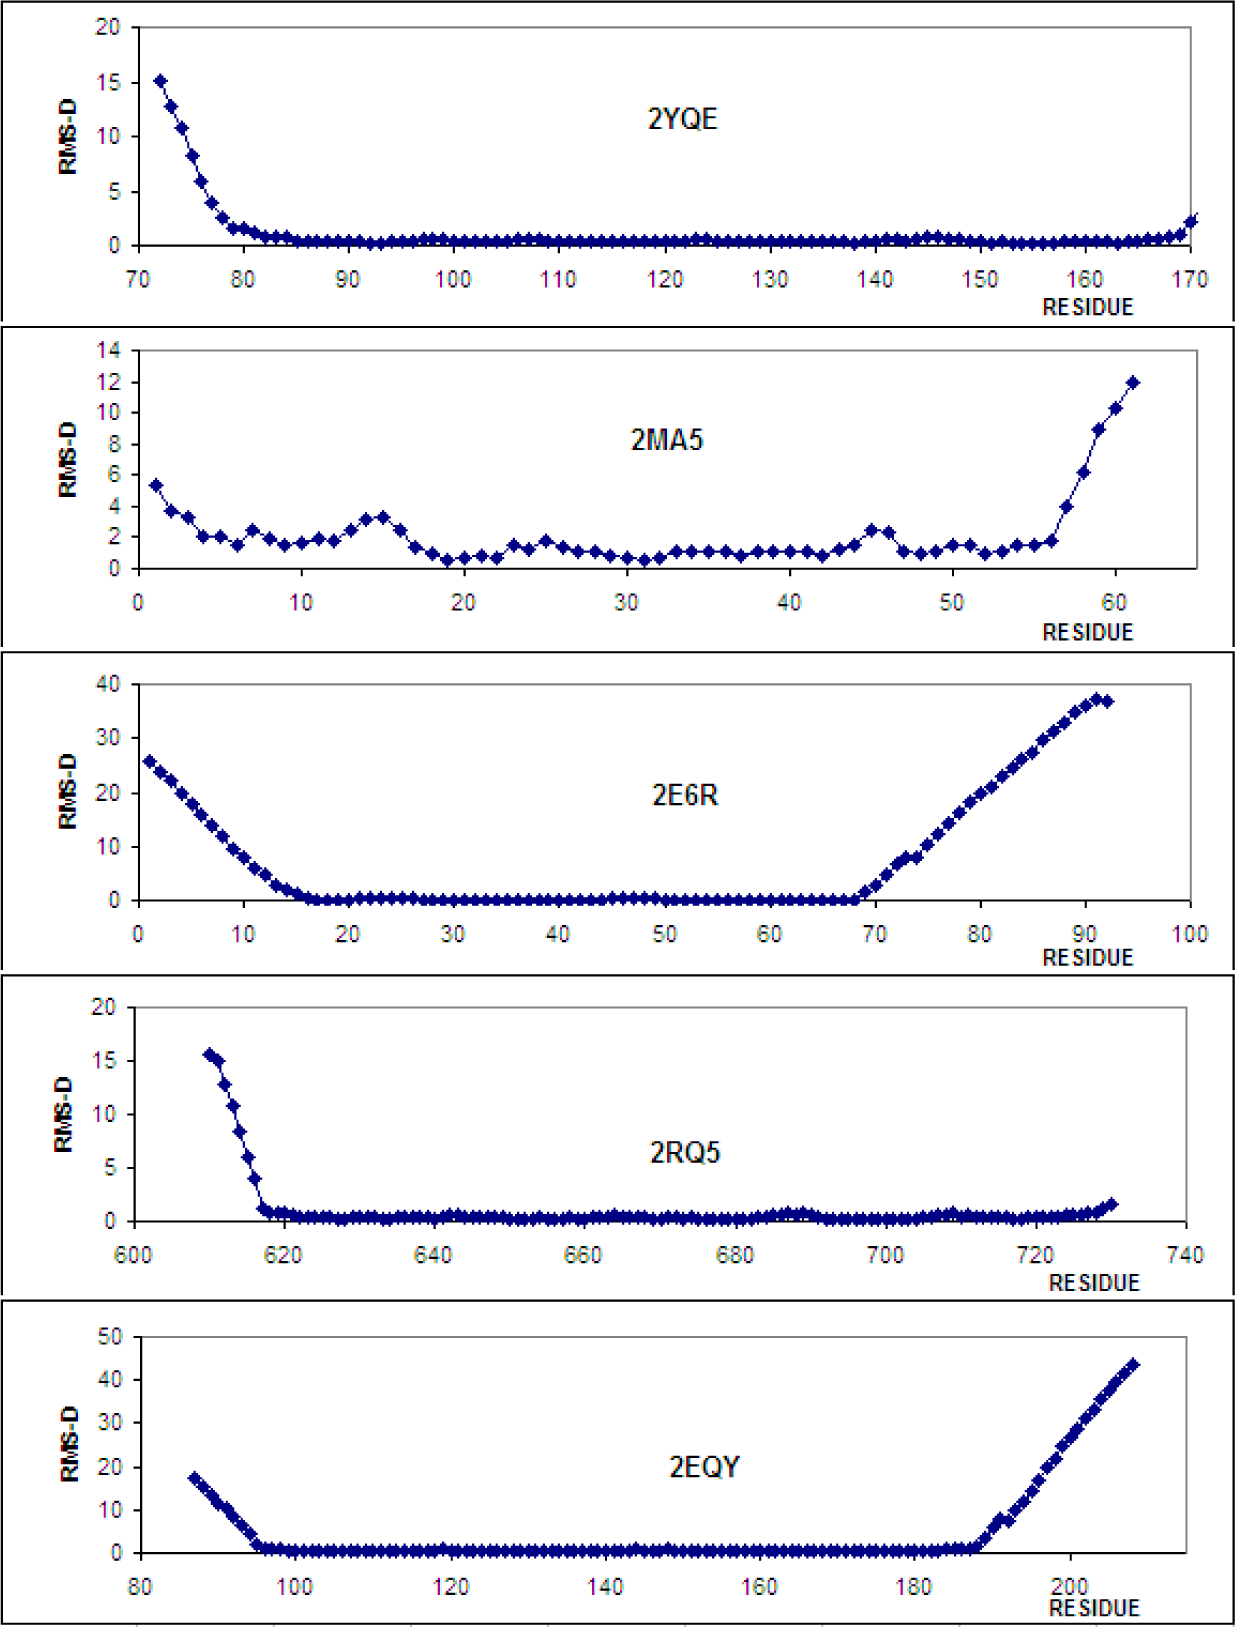
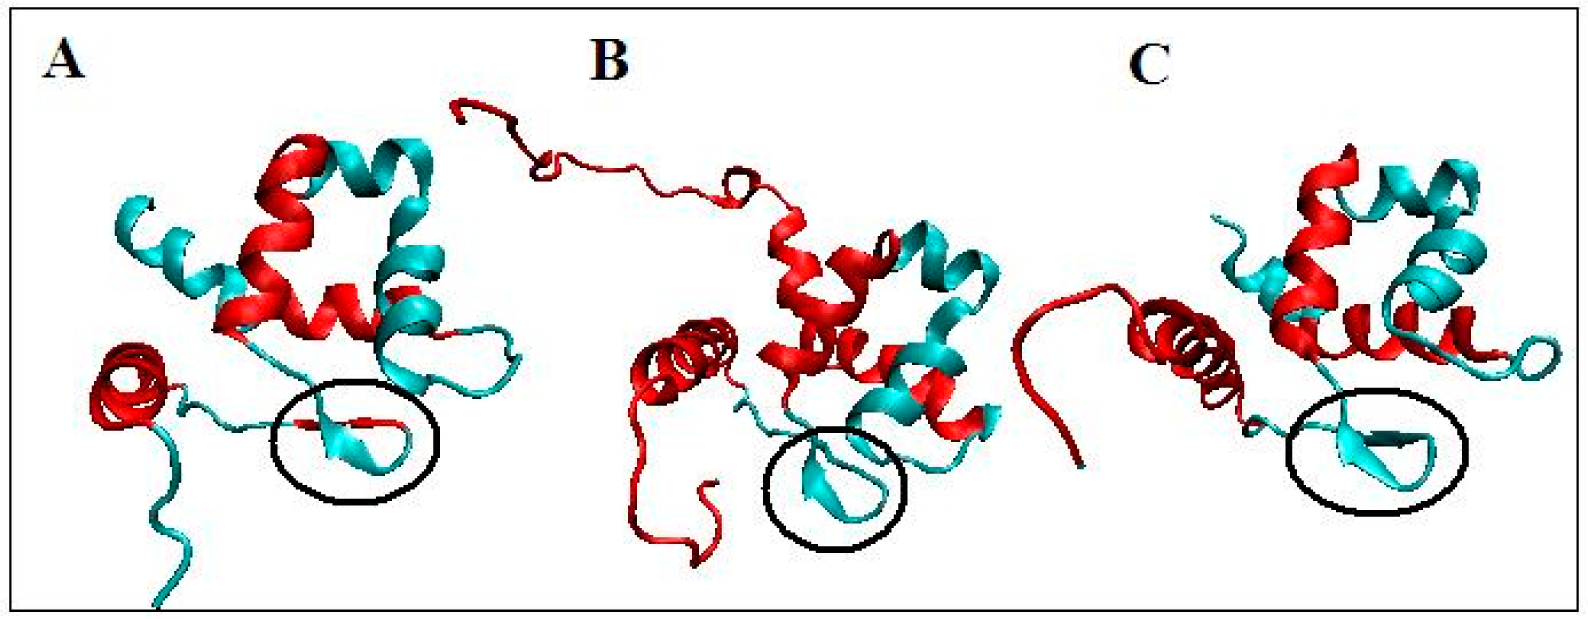
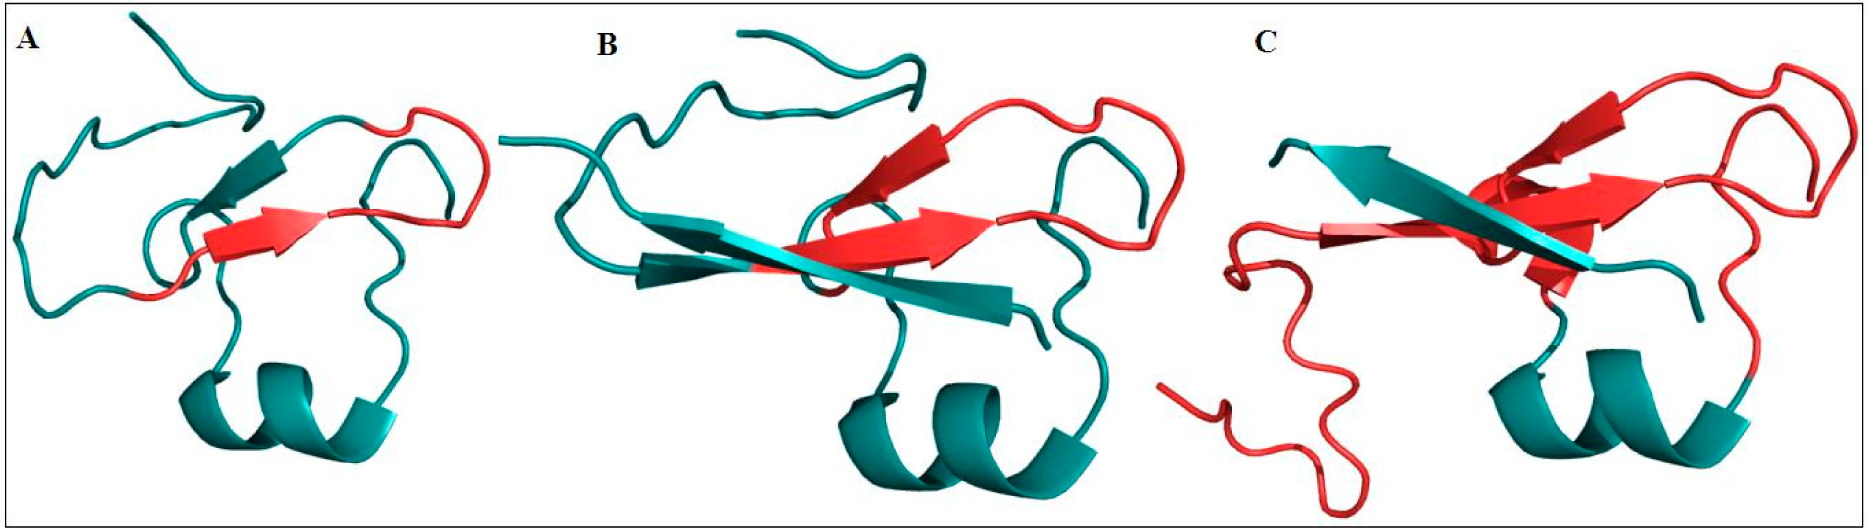
4.4.3. Structural Analysis
5. Discussion and Conclusions
Acknowledgments
Author Contributions
Conflicts of Interest
References
- Matsumura, M.; Wozniak, J.A.; Sun, D.P.; Matthews, B.W. Structural studies of mutants of T4 lysozyme that alter hydrophobic stabilization. J. Biol. Chem. 1989, 264, 16059–16066. [Google Scholar]
- Van den Burg, B.; Dijkstra, B.W.; Vriend, G.; van der Vinne, B.; Venema, G.; Eijsink, V.G. Protein stabilization by hydrophobic interactions at the surface. Eur. J. Biochem. 1994, 220, 981–985. [Google Scholar]
- Chang, B.S.; Mahoney, R.R. Enzyme thermostabilization by bovine serum albumin and other proteins: Evidence for hydrophobicinteractions. Biotechnol. Appl. Biochem. 1995, 22, 203–214. [Google Scholar]
- Ventura, S.; Serrano, L. Designing proteins from the inside out. Proteins 2004, 56, 1–10. [Google Scholar]
- Chattopadhyay, K.; Mazumdar, S. Stabilization of partially folded states of cytochrome c in aqueous surfactant: Effects of ionic and hydrophobic interactions. Biochemistry 2003, 42, 14606–14613. [Google Scholar]
- Vondrásek, J.; Bendová, L.; Klusák, V.; Hobza, P. Unexpectedly strong energy stabilization inside the hydrophobic core of small protein rubredoxin mediated by aromatic residues: Correlated ab initio quantum chemical calculations. J. Am. Chem. Soc. 2005, 127, 2615–2619. [Google Scholar]
- Gerstman, B.S.; Chapagain, P.P. Self-organization in protein folding and the hydrophobic interaction. J. Chem. Phys. 2005, 123, 054901. [Google Scholar]
- Arunachalam, J.; Gautham, N. Hydrophobic clusters in protein structures. Proteins 2008, 71, 2012–2025. [Google Scholar]
- Dong, H.; Mukaiyama, A.; Tadokoro, T.; Koga, Y.; Takano, K.; Kanaya, S. Hydrophobic effect on the stability and folding of a hyperthermophilic protein. J. Mol. Biol. 2008, 378, 264–272. [Google Scholar]
- Dill, K.A.; MacCallum, J.L. The protein-folding problem, 50 years on. Science 2012, 338, 1042–1046. [Google Scholar]
- Kauzmann, W. Some factors in the interpretation of protein denaturation. Adv. Protein Chem. 1959, 14, 1–63. [Google Scholar]
- Konieczny, L.; Brylinski, M.; Roterman, I. Gauss function based model of hydrophobicity density in proteins. In Silico Biol. 2006, 6, 15–22. [Google Scholar]
- Kullback, S.; Leibler, R.A. On Information and Sufficiency. Ann. Math. Stat. 1951, 22, 79–86. [Google Scholar]
- Vucetic, S.; Obradovic, Z.; Vacic, V.; Radivojac, P.; Peng, K.; Iakoucheva, L.M.; Cortese, M.S.; Lawson, J.D.; Brown, C.J.; Sikes, J.G.; et al. DisProt: A database of protein disorder. Bioinformatics 2005, 21, 137–140. [Google Scholar]
- Homepage of DisProt. Available online: http://www.disprot.org accessed on 18 March 2015.
- Uversky, V.N.; Dunker, A.K. Understanding protein non-folding. Biochimica Biophysica Acta. 1231–1264.
- Bergé-Lefranc, J.L.; Jay, P.; Massacrier, A.; Cau, P.; Mattei, M.G.; Bauer, S.; Marsollier, C.; Berta, P.; Fontes, M. Characterization of the human jumonji gene. Hum. Mol. Genet. 1996, 5, 1637–1641. [Google Scholar]
- Li, L.; Greer, C.; Eisenman, R.N.; Secombe, J. Essential Functions of the Histone Demethylase Lid. PLoS Genet 2010, 6, e1001221. [Google Scholar]
- Liefke, R.; Oswald, F.; Alvarado, C.; Ferres-Marco, D.; Mittler, G.; Rodriguez, P.; Dominguez, M.; Borggrefe, T. Histone demethylase KDM5A is an integral part of the core Notch-RBP-J repressor complex. Genes Dev. 2010, 24, 590–601. [Google Scholar]
- Sauvageau, M.; Sauvageau, G. Polycomb group proteins: Multi-faceted regulators of somatic stem cells and cancer. Cell Stem Cell. 2010, 7, 299–313. [Google Scholar]
- Pasini, D.; Cloos, P.A.; Walfridsson, J.; Olsson, L.; Bukowski, J.P.; Johansen, J.V.; Bak, M.; Tommerup, N.; Rappsilber, J.; Helin, K. JARID2 regulates binding of the Polycomb repressive complex 2 to target genes in ES cells. Nature 2010, 464, 306–310. [Google Scholar]
- Zhou, X.; Sun, H.; Chen, H.; Zavadil, J.; Kluz, T.; Arita, A.; Costa, M. Hypoxia induces trimethylated H3 lysine 4 by inhibition of JARID1A demethylase. Cancer Res. 2010, 70, 4214–4221. [Google Scholar]
- Takeuchi, T.; Kojima, M.; Nakajima, K.; Kondo, S. jumonji gene is essential for the neurulation and cardiac development of mouse embryos with a C3H/He background. Mech. Dev. 1999, 86, 29–38. [Google Scholar]
- Banach, M.; Prymula, K.; Jurkowski, W.; Konieczny, L.; Roterman, I. Fuzzy oil drop model to interpret the structure of antifreeze proteins and their mutants. J. Mol. Model. 2012, 18, 229–237. [Google Scholar]
- Roterman, I.; Konieczny, L.; Jurkowski, W.; Prymula, K.; Banach, M. Two-intermediate model to characterize the structure of fast-folding proteins. J. Theor. Biol. 2011, 283, 60–70. [Google Scholar]
- Prymula, K.; Jadczyk, T.; Roterman, I. Catalytic residues in hydrolases: Analysis of methods designed for ligand-binding site prediction. J. Comput. Aided Mol. Des. 2011, 25, 117–133. [Google Scholar]
- Bryliński, M.; Kochańczyk, M.; Broniatowska, E.; Roterman, I. Localization of ligand binding site in proteins identified in silico. J. Mol. Model. 2007, 13, 665–675. [Google Scholar]
- Banach, M.; Konieczny, L.; Roterman, I. Lignad-binding site recognition. In Protein Folding in Silico: Protein Folding Versus Protein Structure Prediction; Roterman-Konieczna, I., Ed.; Woodhead Publishing: Oxford, Cambridge, UK & Philadelphia, PA, USA & New Dehli, India, 2012; pp. 79–94. [Google Scholar]
- Banach, M.; Konieczny, L.; Roterman, I. Use of the “fuzzy oil drop” model to identify the complexation area in protein homodimers. In Protein Folding in Silico: Protein Folding Versus Protein Structure Prediction; Roterman-Konieczna, I., Ed.; Woodhead Publishing: Oxford, Cambridge, UK & Philadelphia, PA, USA & New Dehli, India, 2012; pp. 95–122. [Google Scholar]
- Marchewka, D.; Jurkowski, W.; Banach, M.; Roterman, I. Prediction of protein-protein binding interfaces. In Identification of Ligand Binding Site and Protein-Protein Interaction Area; Roterman-Konieczna, I., Ed.; Springer; Heidelberg, Germany & New York, NY, USA & London, UK, 2013; pp. 105–134. [Google Scholar]
- Banach, M.; Stapor, K.; Roterman, I. Chaperonin structure: The large multi-subunit protein complex. Int. J. Mol. Sci. 2009, 10, 844–861. [Google Scholar]
- Kalinowska, B.; Banach, M.; Konieczny, L.; Marchewka, D.; Roterman, I. Intrinsically disordered proteins-relation to general model expressing the active role of the water environment. Adv. Protein Chem. Struct. Biol. 2014, 94, 315–346. [Google Scholar]
- Banach, M.; Konieczny, L.; Roterman, I. The fuzzy oil drop model, based on hydrophobicity density distribution, generalizes the influence of water environment on protein structure and function. J. Theor. Biol. 2014, 359, 6–17. [Google Scholar]
- Levitt, M. A simplified representation of protein conformations for rapid simulation of protein folding. J. Mol. Biol. 1976, 104, 59–107. [Google Scholar]
- Kyte, J.; Doolittle, R.F. A simple method for displaying the hydropathic character of a protein. J. Mol. Biol. 1982, 157, 105–132. [Google Scholar]
- Eisenberg, D.; Weiss, R.M.; Terwilliger, T.C.; Wilcox, W. Hydrophobic moments and protein structure. Faraday Symp. Chem. Soc. 1982, 17, 109–120. [Google Scholar]
- Engelman, D.M.; Zaccai, G. Bacteriorhodopsin is an inside-out protein. Proc. Natl. Acad. Sci. USA. 1986, 77, 5894–5898. [Google Scholar]
- Hopp, T.P.; Woods, K.R. Prediction of protein antigenic determinants from amino acid sequences. Proc. Natl. Acad. Sci. USA. 1981, 78, 3824–3828. [Google Scholar]
- Rose, G.D.; Geselowitz, A.R.; Lesser, G.J.; Lee, R.H.; Zehfus, M.H. Hydrophobicity of amino acid residues in globular proteins. Science 1985, 229, 834–838. [Google Scholar]
- Wimley, W.C.; White, S.H. Experimentally determined hydrophobicity scale for proteins at membrane interfaces. Nat. Struct. Biol. 1996, 33, 842–848. [Google Scholar]
- Wolfender, R.; Anderson, L.; Cullis, P.M.; Soulhgate, C.C. Affinities of amino acids side chains for solvent water. Biochemistry 1981, 20, 846–855. [Google Scholar]
- Bryliński, M.; Konieczny, L.; Roterman, I. Is the protein folding an aim-oriented process? Human haemoglobin as example. Int. J. Bioinform. Res. Appl. 2007, 3, 234–260. [Google Scholar]
- Rico, F.; Gonzales, L.; Casuso, I.; Puig-Vidal, M.; Scheuring, S. High-speed force spectroscopy unfolds titin at the velocity of molecular dynamics simulation. Science 2013, 342, 741–743. [Google Scholar]
- Laskowski, R.A. PDBsum new things. Nucleic Acids Res. 2009, 37, D355–D359. [Google Scholar]
- Orengo, C.A.; Michie, A.D.; Jones, S.; Jones, D.T.; Swindells, M.B.; Thornton, J.M. CATH-a hierarchic classification of protein domain structures. Structure 1997, 5, 1093–1108. [Google Scholar]
- Tu, S.; Teng, Y.C.; Yuan, C.; Wu, Y.T.; Chan, M.Y.; Cheng, A.N.; Lin, P.H.; Juan, L.J.; Tai, M.D. The ARID domain of the H3K4 demethylase RBP2 binds to a DNA CCGCCC motif. Nat. Struct. Biol. 2008, 15, 419–421. [Google Scholar]
- Wang, G.G.; Song, J.; Wang, Z.; Dormann, H.L.; Casadio, F.; Li, H.; Luo, J.L.; Patel, D.J.; Allis, C.D. Haematopoietic malignancies caused by dysregulation of a chromatin-binding PHD finger. Nature 2009, 459, 847–851. [Google Scholar]
- Kedersha, N.; Ivanov, P.; Anderson, P. Stress granules and cell signaling: More than just a passing phase? Trends Biochem. Sci. 2013, 38, 494–506. [Google Scholar]
- McWilliam, H.; Li, W.; Uludag, M.; Squizzato, S.; Park, Y.M.; Buso, N.; Cowley, A.P.; Lopez, R. Analysis Tool Web Services from the EMBL-EBI. Nucleic Acids Res. 2013, 41, W597–W600. [Google Scholar]
- Das, P.; Kapoor, D.; Halloran, K.T.; Zhou, R.; Matthews, C.R. Interplay between Drying and Stability of a TIM Barrel Protein: A Combined Simulation-Experimental Study. J. Am. Chem. Soc. 2013, 135, 1882–1890. [Google Scholar]
- Galzitskaya, O.V.; Ivankov, D.N.; Finkelstein, A.V. Folding nuclei in proteins. FEBS Lett. 2001, 489, 113–118. [Google Scholar]
- Roterman, I.; Konieczny, L.; Banach, M.; Marchewka, D.; Kalinowska, B.; Baster, Z.; Tomanek, M.; Piwowar, M. Simulation of the Protein Folding Process. In Computational Methods to Study the Structure and Dynamics of Biomolecules and Biomolecular Processes: From Bioinformatics to Molecular Quantum Mechanics; Liwo, A., Ed.; Springer, Series in Bio-Neuroinformatics; Springer: Berlin, Germany, 2014; Volume 1, pp. 599–638. [Google Scholar]
- Ben-Naim, A. Myths and verities in protein folding theories: From Frank and Evans iceberg-conjecture to explanation of the hydrophobic effect. J. Chem. Phys. 2013, 139, 165105. [Google Scholar]
- Ben-Naim, A. Theoretical aspects of self-assembly of proteins: A Kirkwood-Buff-theory approach. J. Chem. Phys. 2013, 138, 224906. [Google Scholar]
- Ben-Naim, A. On the So-Called Gibbs Paradox, and on the Real Paradox. Entropy 2007, 9, 132–136. [Google Scholar]
- Ben-Naim, A. Theoretical aspects of pressure and solute denaturation of proteins: A Kirkwood-buff-theory approach. J. Chem. Phys. 2012, 137, 235102. [Google Scholar]


| AA | Intrinsic Hydrophobicity | AA | Intrinsic Hydrophobicity | |
|---|---|---|---|---|
| LYS | 0.001 | ALA | 0.572 | |
| GLU | 0.083 | HIS | 0.628 | |
| ASP | 0.167 | TYR | 0.700 | |
| GLN | 0.250 | LEU | 0.783 | |
| ARG | 0.272 | VAL | 0.811 | |
| ASN | 0.278 | MET | 0.828 | |
| PRO | 0.300 | TRP | 0.856 | |
| SER | 0.422 | ILE | 0.883 | |
| THR | 0.478 | PHE | 0.906 | |
| GLY | 0.550 | CYS | 1.000 | |
| JARID1A | JARID1B | JARID1D | JARID2 | |
|---|---|---|---|---|
| ARID 1.10.150.60 Mainly Orthogonal α-Bundle | 2JXJ [46] HLSD-5A KDM5A_HUMAN 1H + β-hairpin + 5H DisProt (103–116) | 2EQY HLSD-5B KDM5B_MOUSE 1H + β-hairpin + 5H DisProt (115–128) | 2YQE HLSD-5D KDM5D_HUMAN 1H + β-hairpin + 5H | 2RQ5 Transcription Jumonji protein JARID2_MOUSE 1H + β-hairpin + 6H |
| PHD 2 × Zn2+ 3.30.40.10 α-2-Layer β-Sandwich | 2KGG [47] HLSD-5A KDM5A_HUMAN β-hairpin + 1H 2KGI [47] HLSD-5A KDM5A_HUMAN C-terminal β-hairpin + 1H 2 × Zn2+ Ligand (fragment of histone) 3GL6 PHD3 HLSD-5A KDM5A_HUMAN β-hairpin + 2H 3 × Zn2+ DisProt (1609–1659) | 2MA5 HLSD-5B KDM5B_HUMAN C-terminal β-hairpin + 3H | 2E6R HLSD-5D KDM5D_HUMAN 1H + β-hairpin + 1H |
| Complete Molecule
| Protein | Compact Part
| |
|---|---|---|---|
| RMS-D | RMS-D | Fragment | |
| 1.67 | 2JXJ | 0.804 | 88–175 |
| 11.74 | 2EQY | 0.741 | 97–187 |
| 3.08 | 2YQE | 0.598 | 83–168 |
| 3.22 | 2RQ5 | 0.577 | 618–728 |
| 0.45 | 2KGG | ||
| 0.78 | 2KGI | ||
| 3.72 | 2MA5 | 1.679 | 17–56 |
| 14.05 | 2E6R | 0.116 | 16–68 |
| Secondary Fragment | O|T | O|R | RD | ||||
|---|---|---|---|---|---|---|---|
| C | P | C | P | C | P | ||
| 2EQY | 0.283 | 0.223 | 0.305 | 0.251 | 0.481 0.497 | 0.471 0.471 | |
| Unstructured | 87–95 | 0.168 | 0.031 | 0.843 | |||
| α 96–115 | 0.228 | 0.159 | 0.187 | 0.182 | 0.549 | 0.466 | |
| L 116–120 | 0.172 | 0.217 | 0.276 | 0.201 | 0.383 | 0.519 | |
| β 121–124 | 0.041 | 0.034 | 0.107 | 0.107 | 0.278 | 0.243 | |
| β 125–128 | 0.128 | 0.158 | 0.642 | 0.642 | 0.166 | 0.198 | |
| α 129–141 | 0.210 | 0.189 | 0.176 | 0.176 | 0.544 | 0.517 | |
| α 142–149 | 0.158 | 0.142 | 0.257 | 0.257 | 0.381 | 0.355 | |
| α 151–159 | 0.145 | 0.127 | 0.297 | 0.366 | 0.328 | 0.258 | |
| L 160–164 | 0.072 | 0.028 | 0.133 | 0.160 | 0.350 | 0.148 | |
| α 165–178 | 0.262 | 0.206 | 0.190 | 0.195 | 0.579 | 0.514 | |
| α 179–188 | 0.194 | 0.159 | 0.047 | 0.120 | 0.805 | 0.570 | |
| Unstructured | 189–208 | 0.375 | 0.321 | 0.538 | |||
| β-hairpin | 120–129 | 0.103 | 0.298 | 0.258 | |||
| DisProt | 115–128 | 0.172 | 0.225 | 0.276 | 0.276 | 0.384 | 0.449 |
| Secondary Fragment | O|T | O|R | RD | |
|---|---|---|---|---|
| 2JXJ | Complete Molecule | 0.206 | 0.248 | 0.453 0.473 |
| α 84–102 | 0.188 | 0.184 | 0.505 | |
| β 108–110 | 0.046 | 0.033 | 0.577 | |
| β 113–115 | 0.068 | 0.372 | 0.156 | |
| α 117–129 | 0.192 | 0.125 | 0.606 | |
| α 130–137 | 0.232 | 0.465 | 0.333 | |
| α 138–147 | 0.114 | 0.333 | 0.256 | |
| α 153–163 | 0.161 | 0.115 | 0.582 | |
| α 166–174 | 0.080 | 0.088 | 0.477 | |
| β-hairpin | 107–115 | 0.081 | 0.269 | 0.233 |
| DisProt | 103–116 | 0.176 | 0.235 | 0.428 |
| EXON | 81–121 | 0.207 | 0.201 | 0.507 |
| Secondary Fragment | O|T | O|R | RD | |
|---|---|---|---|---|
| 2YQE | Complete Molecule | 0.255 | 0.231 | 0.524 0.500 |
| Unstructured | 72–79 | 0.231 | 0.025 | 0.903 |
| α 80–97 | 0.422 | 0.223 | 0.654 | |
| β103–106 | 0.036 | 0.108 | 0.264 | |
| β 107–110 | 0.138 | 0.637 | 0.179 | |
| α 111–123 | 0.146 | 0.109 | 0.573 | |
| α 124–131 | 0.125 | 0.327 | 0.277 | |
| α 133–141 | 0.139 | 0.244 | 0.362 | |
| L 142–147 | 0.123 | 0.214 | 0.364 | |
| α 148–160 | 0.183 | 0.180 | 0.504 | |
| α 161–168 | 0.088 | 0.090 | 0.493 | |
| β-hairpin | 103–110 | 0.098 | 0.349 | 0.219 |
| Unstructured | 98–110 | 0.149 | 0.283 | 0.344 |
| Secondary Fragment | O|T
| O|R
| RD
| ||||
|---|---|---|---|---|---|---|---|
| C | P | C | P | C | P | ||
| 2RQ5 | Chain | 0.207 | 0.182 | 0.259 | 0.254 | 0.444 0.475 | 0.417 0.479 |
| α 620–636 | 0.126 | 0.147 | 0.169 | 0.174 | 0.427 | 0.426 | |
| Unstructured | 637–643 | 0.300 | 0.257 | 0.539 | |||
| β644–646 | 0.092 | 0.129 | 0.041 | 0.041 | 0.690 | 0.628 | |
| β649–651 | 0.241 | 0.069 | 0.126 | 0.126 | 0.656 | 0.642 | |
| α 652–663 | 0.174 | 0.227 | 0.138 | 0.139 | 0.556 | 0.424 | |
| α 665–672 | 0.073 | 0.102 | 0.203 | 0.204 | 0.263 | 0.332 | |
| α674–682 | 0.102 | 0.101 | 0.391 | 0.391 | 0.207 | 0.246 | |
| L 683–689 | 0.355 | 0.341 | 0.458 | 0.458 | 0.437 | 0.427 | |
| α690–701 | 0.097 | 0.128 | 0.189 | 0.188 | 0.339 | 0.304 | |
| α 702–709 | 0.117 | 0.083 | 0.078 | 0.056 | 0.600 | 0.601 | |
| α710–727 | 0.130 | 0.191 | 0.405 | ||||
| β-hairpin | 643–652 | 0.268 | 0.233 | 0.106 | 0.106 | 0.716 | 0.687 |
| Secondary Fragment | O|T | O|R | RD | ||||
|---|---|---|---|---|---|---|---|
| C | P | C | P | C | P | ||
| 2E6R | 0.513 | 0.164 | 0.227 | 0.227 | 0.649 0.580 | 0.420 0.412 | |
| Unstructured | 1–19 | 0.640 | 0.237 | 0.730 | |||
| α 25–31 | 0.088 | 0.111 | 0.318 | 0.267 | 0.216 | 0.293 | |
| Zn2+ (34) | β 32–34 | 0.154 | 0.153 | 0.147 | 0.159 | 0.510 | 0.490 |
| β 39–41 | 0.089 | 0.023 | 0.014 | 0.016 | 0.861 | 0.584 | |
| Unstructured | 42–60 | 0.402 | 0.065 | 0.229 | 0.161 | 0.637 | 0.289 |
| Zn2+ (60, 63) | α 61–69 | 0.179 | 0.180 | 0.246 | 0.224 | 0.421 | 0.445 |
| β-hairpin | 31–43 | 0.356 | 0.161 | 0.085 | 0.105 | 0.807 | 0.606 |
| Unstructured | 79–92 | 0.551 | 0.142 | 0.795 | |||
| Secondary Fragments | O|T | O|R | RD | |
|---|---|---|---|---|
| 2MA5 | Complete Molecule | 0.164 | 0.281 | 0.368 0.333 |
| Unstructured Zn2+ 4, 9 | 1–17 | 0.079 | 0.193 | 0.290 |
| Zn2+ 22 | β 18–22 | 0.043 | 0.167 | 0.206 |
| Zn2+ 26 | L 23–27 | 0.119 | 0.400 | 0.230 |
| Zn2+ 31 | β 28–31 | 0.026 | 0.068 | 0.279 |
| Zn2+ 34 | α 32–36 | 0.113 | 0.119 | 0.486 |
| α 38–44 | 0.132 | 0.286 | 0.316 | |
| L 45–48 | 0.022 | 0.051 | 0.301 | |
| Zn2+ 49, 52 | α 49–55 | 0.190 | 0.389 | 0.327 |
| β-hairpin | 18–32 | 0.048 | 0.096 | 0.333 |
| Secondary Fragment | O|T | O|R | RD | |
|---|---|---|---|---|
| 2KGG | Complete Molecule | 0.226 | 0.292 | 0.436 0.388 |
| Unstructured | 1–16 | 0.154 | 0.398 | 0.279 |
| β 17–21 | 0.293 | 0.267 | 0.523 | |
| Zn2+ 25 | L 22–26 | 0.125 | 0.093 | 0.572 |
| Zn2+ 30 | β 27–31 | 0.030 | 0.096 | 0.238 |
| L 32–36 | 0.039 | 0.069 | 0.366 | |
| α 37–44 | 0.115 | 0.283 | 0.288 | |
| β-hairpin | 17–31 | 0.283 | 0.153 | 0.649 |
| Secondary Fragment | O|T | O|R | RD | |
|---|---|---|---|---|
| 2KGI-AB | Complex | 0.210 | 0.273 | 0.435 0.388 |
| Unstructured | 1–14 | 0.052 | 0.091 | 0.365 |
| L 17–21 | β 17–21 | 0.141 | 0.301 | 0.319 |
| L 28, 31 Zn2+ 30 | β 27–31 | 0.222 | 0.155 | 0.589 |
| L 32–36 | 0.078 | 0.245 | 0.243 | |
| L 41, 44–45 | α 37–44 | 0.032 | 0.081 | 0.285 |
| L 45–52 | 0.143 | 0.166 | 0.463 | |
| Chain B | 0.105 | 0.191 | 0.355 0.431 | |
| β-hairpin | 14–31 301–308 | 0.270 | 0.283 | 0.488 |
| β-hairpin | 14–31 | 0.279 | 0.196 | 0.801 |
| 2KGI-A | CHAIN | 0.261 | 0.271 | 0.491 0.364 |
| Unstructured | 1–14 | 0.144 | 0.323 | 0.308 |
| L 17–21 | β 17–21 | 0.318 | 0.223 | 0.587 |
| L 28, 31 Zn2+ 30 | β 27–31 | 0.048 | 0.091 | 0.347 |
| L 31–36 | 0.110 | 0.143 | 0.435 | |
| L 41, 44–45 | α 37–44 | 0.116 | 0.221 | 0.344 |
| L 45–52 | 0.234 | 0.268 | 0.466 | |
| β-hairpin | 14–31 | 0.359 | 0.258 | 0.582 |
| Secondary Fragment | O|T | O|R | RD | |
|---|---|---|---|---|
| 3GL6-COMPLEX | Complete Molecule | 0.367 | 0.208 | 0.638 |
| Chain A | 0.362 | 0.202 | 0.641 | |
| Chain B | 0.282 | 0.082 | 0.772 | |
| Unstruct. 4 Zn2+ | 1608–1623 | 0.547 | 0.259 | 0.678 |
| 1 Zn2+4 L | β 1624–1628 | 0.227 | 0.125 | 0.643 |
| 1 L | β 1634–1638 | 0.039 | 0.036 | 0.519 |
| α 1639–1642 | 0.025 | 0.009 | 0.729 | |
| 3 L | α 1644–1651 | 0.091 | 0.251 | 0.267 |
| 2 Zn2+ | L 1652–1659 | 0.290 | 0.170 | 0.618 |
| β-hairpin | 1621–1638 | 0.023 | 0.014 | 0.629 |
| β-hairpin + ligand | 1621–1638 1–8 | 0.277 | 0.177 | 0.610 |
| Secondary Fragment | O|T | O|R | RD | ||||
|---|---|---|---|---|---|---|---|
| Chain | C | P | C | P | C | P | |
| 3GL6 | Complete Molecule | 0.381 | 0.439 | 0.231 | 0.190 | 0.623 0.614 | 0.698 0.677 |
| Unstruct.4 Zn2+ | 1608–1623 | 0.605 | 0.570 | 0.320 | 0.320 | 0.654 | 0.641 |
| 1 Zn2+; 4 L | β 1624–1628 | 0.264 | 0.339 | 0.173 | 0.103 | 0.604 | 0.766 |
| 1 L | β 1634–1638 | 0.036 | 0.080 | 0.028 | 0.026 | 0.563 | 0.755 |
| α 1639–1642 | 0.023 | 0.057 | 0.009 | 0.008 | 0.708 | 0.872 | |
| 3 L | α 1644–1651 | 0.097 | 0.265 | 0.269 | |||
| 2 Zn2+ | L 1652–1659 | 0.275 | 0.189 | 0.593 | |||
| β-hairpin | 1608–1644 | 0.311 | 0.507 | 0.215 | 0.074 | 0.591 | 0.743 |
| DisProt | 1609–1659 | 0.357 | 0.438 | 0.183 | 0.190 | 0.662 | 0.698 |
| 2JXJ | 2EQY | 2YQE | |
|---|---|---|---|
| 2EQY | 88.89 | ||
| 2YQE | 87.50 | 87.50 | |
| 2RQ5 | 11.11 | 30.00 | 12.50 |
| 2KGG-complex 2KGI 3GL6-complex | 2E6R | |
|---|---|---|
| 2MA5 | 80.00 | 23.08 |
| 2E6R | 30.77 |
| Complete Domain | ||||||||
|---|---|---|---|---|---|---|---|---|
| JARID1A | JARID1B | JARID1D | JARID2 | |||||
| ARID | 2JXJ | + | 2EQY | + | 2EQY | − | 2RQ5 | + |
| PHD | 2KGG | + | ||||||
| 2KGI | + | 2MA5 | + | 2E6R | −(+) | |||
| 3GL6 | − | |||||||
| β−HAIRPIN LOOP | ||||||||
| JARID1A | JARID1B | JARD1D | JARID2 | |||||
| ARID | 2JXJ | + | 2EQY | + | 2YQE | + | 2RQ5 | − |
| PHD | 2KGG | + | ||||||
| 2KGI | − | 2MA5 | + | 2E6R | − | |||
| 3GL6 | − | |||||||
| DisProt FRAGMENTS | ||||||||
| JARID1A | JARID1B | JARID1D | JADIR2 | |||||
| ARID | 2JXJ | + | 2EQY | + | ||||
| PHD | 3GL6 | − | ||||||
| PRESENCE of Zn2+ ions | ||||||||
| JARID1D | JARID1B | JARID1D | JARID2 | |||||
| PHD | 2KGG | −(+) | ||||||
| 2KGI | −(+) | 2MA5 | + | 2E6R | −(+) | |||
| 3GL6 | − | |||||||
| Complete Molecule
| Protein | Compact Fragment
| |||
|---|---|---|---|---|---|
| Average | ST.DEV. | # AA | Average | ST.DEV. | |
| 0.544 | 0.062 | 2E6R | 16–68 | 0.400 | 0.010 |
| 0.498 | 0.025 | 2EQY | 97–187 | 0.450 | 0.015 |
| 0.484 | 0.018 | 2JXJ | 88–175 | 0.428 | 0.014 |
| 0.298 | 0.027 | 2MA5 | 17–56 | 0.361 | 0.041 |
| 0.467 | 0.018 | 2RQ5 | 618–728 | 0.412 | 0.011 |
| 0.516 | 0.025 | 2YQE | 83–168 | 0.408 | 0.010 |
© 2015 by the authors; licensee MDPI, Basel, Switzerland This article is an open access article distributed under the terms and conditions of the Creative Commons Attribution license (http://creativecommons.org/licenses/by/4.0/).
Share and Cite
Kalinowska, B.; Banach, M.; Konieczny, L.; Roterman, I. Application of Divergence Entropy to Characterize the Structure of the Hydrophobic Core in DNA Interacting Proteins. Entropy 2015, 17, 1477-1507. https://doi.org/10.3390/e17031477
Kalinowska B, Banach M, Konieczny L, Roterman I. Application of Divergence Entropy to Characterize the Structure of the Hydrophobic Core in DNA Interacting Proteins. Entropy. 2015; 17(3):1477-1507. https://doi.org/10.3390/e17031477
Chicago/Turabian StyleKalinowska, Barbara, Mateusz Banach, Leszek Konieczny, and Irena Roterman. 2015. "Application of Divergence Entropy to Characterize the Structure of the Hydrophobic Core in DNA Interacting Proteins" Entropy 17, no. 3: 1477-1507. https://doi.org/10.3390/e17031477