Article

Wavelet-Tsallis Entropy Detection and Location of Mean Level-Shifts in Long-Memory fGn Signals

by
Julio César Ramírez-Pacheco
1,*,
Luis Rizo-Domínguez
2 and
Joaquin Cortez-González
3
1
Department of Basic Sciences and Engineering (DCBeI), University of Caribe, Cancún 77528, Mexico
2
Instituto Tecnológico y de Estudios Superiores de Occidente (ITESO), Jesuit University of Guadalajara, San Pedro Tlaquepaque 45604, Mexico
3
Instituto Tecnológico de Sonora, Ciudad Obregón 85000, Mexico
*
Author to whom correspondence should be addressed.
Entropy 2015, 17(12), 7979-7995; https://doi.org/10.3390/e17127856
Submission received: 17 September 2015 / Revised: 20 November 2015 / Accepted: 24 November 2015 / Published: 4 December 2015
(This article belongs to the Special Issue Wavelets, Fractals and Information Theory I)

Abstract

:
Long-memory processes, in particular fractional Gaussian noise processes, have been applied as models for many phenomena occurring in nature. Non-stationarities, such as trends, mean level-shifts, etc., impact the accuracy of long-memory parameter estimators, giving rise to biases and misinterpretations of the phenomena. In this article, a novel methodology for the detection and location of mean level-shifts in stationary long-memory fractional Gaussian noise (fGn) signals is proposed. It is based on a joint application of the wavelet-Tsallis q-entropy as a preprocessing technique and a peak detection methodology. Extensive simulation experiments in synthesized fGn signals with mean level-shifts confirm that the proposed methodology not only detects, but also locates level-shifts with high accuracy. A comparative study against standard techniques of level-shift detection and location shows that the technique based on wavelet-Tsallis q-entropy outperforms the one based on trees and the Bai and Perron procedure, as well.

1. Introduction

Long-memory phenomena have been observed in many disciplines of science and engineering [1,2,3]. Long-memory, also called, power-law correlations, long-range correlations, long-range dependence, etc., has been observed in human gait [4], heart-rate fluctuations [5], mental activities [6], river flow fluctuations [7], variable-bit-rate (VBR) video traffic [8], economics [9] and in many other physiological time series, such as self-esteem, mood and serial reaction time, among others [10]. The result within these contributions is a Hurst parameter H > 1 / 2 , which indicates a power-law decay of autocorrelations at a critical point and a power spectral density (PSD) that diverges at the origin. This power-law or hyperbolic decay of correlations has important implications for analysis/estimation, since standard estimators of mean and variance cannot be applied to long-memory data [8]. The unbiased estimation of the long-memory parameter in a time series is of crucial importance since, e.g., it could be used as an indicator of the normal or abnormal state in the health of people [11], the likely occurrence of prolonged and increased delays in computer network traffic (when H 1 ) [12] and as an indicator of a non-stationarity within the fractal signal structure ( H > 1 ). The correct estimation of the long-memory parameter H also has an impact on its description, since H determines the form of autocorrelations and the degree of dependence and self-similarity, among others. Several procedures for estimating the Hurst parameter in long-memory time series have been proposed in the literature. Detrended fluctuation analysis (DFA) and the wavelet technique of Abry and Veitch [13] are two popular estimators of H that have been employed for evidencing long-memory behavior in many fields of science. It is not the purpose of this article to revisit the details of the estimation procedures; however, the interested reader is referred to [10,14,15,16,17,18,19] for further investigation of the advantages and drawbacks of each estimation procedure. Although long-memory has been observed in many physical processes and many procedures for evidencing and quantifying the degree of long-memory have been proposed, currently, there is no unique methodology for estimating the Hurst index H under the variety of complexities found in real measured data. For instance, the presence of mean level-shifts in data can mislead many established estimators, giving rise to biased estimations of the long-memory parameter and, therefore, incorrect conclusions about the nature of data. Moreover, signal misclassification may lead to inconsistent estimations, since some techniques are suitable for a given class of fractal processes, say stationary, but not for the other, say non-stationary [10]. In fact, signal classification as stationary or non-stationary has been recognized as an important first step in fractal signal analysis [10,14,20,21], and some procedures for classifying a signal as a fractional Gaussian noise (fGn) or fractional Brownian motion (fBm) have been proposed [5,10,14,22]. This paper proposes a technique for mean level-shift detection and location in stationary fGn signals of parameter H. This technique is based on a joint application of the wavelet-Tsallis q-entropy and a standard peak detection and location methodology. Wavelet-Tsallis q-entropy acts as a pre-processing functionality converting mean breaks into impulse-shaped waveforms, which, in turn, can be detected and located via a standard peak detection and location methodology. The application of the wavelet-Tsallis technique reduces the length of the signal, therefore reducing the time required to get an estimate of the location of the mean level-shift. To derive and justify the use of wavelet-Tsallis q-entropy as a mean level-shift detection technique, first, the wavelet-Tsallis q-entropy planes for fGn signals are obtained. The effect of the wavelet moment order p on the shape and behavior of wavelet-Tsallis entropy planes is studied in detail, and it is shown that for a fixed length, the wavelet-Tsallis entropy planes follow a ( p , q ) -cosh window behavior. The ( p , q ) -cosh window behavior permits one to map an fGn signal with level-shifts into a signal with peaks. Interestingly, the location of the peaks coincides with that of the break date. As a final step, a standard peak detection and location technique is applied to detect and locate the break date. The rest of the article is structured as follows. In Section 2, the properties and definitions of long-memory signals are briefly outlined. Furthermore, the wavelet analysis of these signals is reviewed and some popular procedures for estimating the relevant parameters listed. Section 3 presents the definition of wavelet-Tsallis q-entropies using the p-th-order wavelet moment and then obtains a closed-form expression of the wavelet-Tsallis q-entropy of long-memory signals. Moreover, the theoretical wavelet-Tsallis q-entropy planes for long-memory processes are derived, and the effect of the nonextensivity parameter q and of the wavelet moment order p on their shape and behavior is discussed. In addition, an experimental study shows that wavelet-Tsallis q-entropy maps a signal with level-shifts into a signal with peaks. Section 4 presents the general procedure for detecting and locating weak level-shifts in fGn signals using the wavelet-Tsallis q-entropy, and Section 5 presents the results and a comparison with the Bai and Perron and the atheoretical regression (ART) technique for level-shift detection and location. Finally, Section 6 draws the conclusions of the paper.

2. Long-Memory fGn Signals

Long-memory, also called long-range dependence (LRD), long-range correlations, etc., provides parsimonious models for a diversity of phenomena that occurs in nature [5,8]. For a detailed list of fields of science in which long-memory behavior has been found, the interested reader is referred to the works [1,2,3,14,17,22]. Traditionally, long-memory has been defined in terms of the behavior of their autocorrelation function (ACF) in the limit of infinity or in terms of the behavior of their PSD at frequencies near zero. More formally, suppose X t represents a wide-sense stationary stochastic process with ACF r ( τ ) . It is said that X t possesses long-memory behavior if its ACF, r ( τ ) , behaves as,
r ( τ ) c r τ - β ,
in the limit of τ , where 0 < β < 1 is called the long-memory parameter and c r is a constant. Alternatively, a second-order stationary random process is said to possess long-memory behavior if its PSD near origin ( ν 0 ) increases without limit in a power-law form, i.e., as,
f ( ν ) c ν ν - α ,
where 0 < α < 1 and c ν is a constant. Equation (1) implies a slow decay of the ACF r ( τ ) , which means that observations separated by a large time span are correlated. In addition, the slow decay of r ( τ ) implies non-summable correlations, and as a consequence, standard statistical tests can not be applied to long-memory data [17]. fGn and fractionally-autoregressive integrated moving average (f-ARIMA) processes are two examples of stochastic processes that are able to model the characteristics of long-memory signals. As a matter of fact, when H > 1 / 2 , an fGn signal is long-range dependent, and in the same way, a value of 0 < d < 1 / 2 in f-ARIMA signals implies long-memory behavior and stationarity. FGn, is a popular stochastic process, which is obtained from fBm via a differencing operation. Formally, let B H ( t ) be a non-stationary self-similar fBm as defined in [23]; the first increment process of B H ( t ) is hence G H , 1 = B H ( t + 1 ) - B H ( t ) , and it is called the fGn of parameter H. H is called the Hurst parameter and controls the degree of correlation within fGn signals. Moreover, fGn is Gaussian, stationary, self-similar, and its autocovariance is given by the following equation:
c H ( τ ) = E G H , 1 ( t ) G H , 1 ( t + τ ) = σ 2 2 | τ + 1 | 2 H + | τ - 1 | 2 H - 2 | τ | 2 H ,
where 0 < H < 1 . In the limit of τ + , the autocovariance takes the following form,
c H ( τ ) σ 2 H ( 2 H - 1 ) τ 2 H - 2 .
Note from Equation (4) that when 1 / 2 < H < 1 , fGn possesses long-range dependency, and when 0 < H < 1 / 2 , it is short-range dependent. An additional model of long-memory is given by the family of time series known as f-ARIMA of parameter d = H + 1 / 2 . F-ARIMA time series are LRD as long as 0 < d < 1 / 2 and provide the additional ability of modeling short-memory and long-memory in the same signal structure. For further references on the properties of fGn and f-ARIMA processes, the reader is referred to [17,23,24,25]

2.1. Wavelet Analysis of Long-Memory Signals

Wavelets and wavelet transforms have been used in many areas of science and engineering for stationary and non-stationary signal analysis [12,26,27]. A condition imposed on a random signal X ( t ) for the applicability of wavelet transforms is that:
E - + | X ( u ) | d u < .
A random signal that satisfies condition given by Equation (5) can therefore be represented by a sum of finite-duration orthonormal wavelets in the following way:
X t = j = 1 L k = - d X ( j , k ) ψ j , k ( t ) ,
where d X ( j , k ) = X ( t ) ψ j , k ( t ) is the discrete wavelet transform (DWT) of X ( t ) and { ψ j , k ( t ) = 2 - j / 2 ψ o ( 2 - j t - k ) , j , k Z } are dyadic dilations and integer translations of ψ o ( t ) , the mother wavelet. An important quantity in the analysis of random signals by wavelets is the p-th-order wavelet moment of d X ( j , k ) , which for long-memory times series is given by [13],
E d X p ( j , k ) = 2 j p α / 2 C ( ψ , α ) ,
where C ( ψ , α ) = | ν | - α | Ψ ( ν ) | 2 d v and Ψ ( ν ) is the Fourier integral of ψ ( t ) . Wavelet analysis has been employed for the analysis and estimation of long-memory signals; special examples are the estimators of the parameter α given by Abry and Veitch [13,28], Soltani [29] and Shen [30]. For further information on the wavelet analysis of long-range dependent signals and other scaling processes, refer to [31,32,33]

2.2. Estimators of the Long-Memory Parameter

Many estimators of the long-memory parameter α (or the related Hurst index H) have been proposed in the literature [14,15,16,17,18,19]. DFA is a popular time-domain estimator of the parameter α and works even when the stationary or non-stationary signal has polynomial-type trends [34,35]. Wavelet-based estimators [12,13,28,29,30], on the other hand, provide powerful, robust and fast estimation of long-memory parameter α. Like the DFA technique, it works with polynomial-type trends and other non-stationarities in the data. For DFA, wavelet-based estimators can be applied to both stationary or non-stationary long-memory signals. Recently, more structured estimators of the long-memory parameter α have been proposed; examples of these include the signal summation conversion (SSC) of Eke [10] and the methodology introduced by Esposti [36]. Mean level-shifts in fGn signals impact the accuracy of estimators of α, giving rise to biased estimations and incorrect conclusions of the data. Therefore, there is a need for a computationally-efficient technique to detect and locate mean level-shifts within fGn signals. This paper proposes a mean level-shift detection and location technique in fGn signals based on wavelet-Tsallis q-entropy and a standard peak detection methodology. For further information on current estimators of α, the reader is referred to [16,17,18,19,35,37].

3. Wavelet-Tsallis q-Entropy

Entropy has traditionally been used as a measure of disorder and complexity within random signals [38,39] and has found application in fields as diverse as medicine, engineering and geophysics, to name but a few. Entropy, for instance, has been used to quantify nonlinearities and complexity in electroencephalogram (EEG) signals [40], event-related potentials in neuroelectrical signals [41,42], structural damage identification [43] and characterization of complexity in random processes [44,45,46]. In order to obtain an entropy estimate from measured data, a probability mass function (pmf) is required. Depending on the nature of the pmf (frequency, wavelet), entropies are usually called spectral entropies (when a frequency pmf is used) or wavelet-based entropies (when a wavelet pmf is used instead) [41,42]. This article proposes a mean level-shift technique using a wavelet-Tsallis entropy; therefore, the pmf is obtained in the wavelet domain, specifically in the discrete wavelet domain of fGn signals. As a matter of fact, the pmf used in the computation of the wavelet-Tsallis q-entropy is determined by substituting the p-th-order wavelet moment in the following formula:
π j = E d X p ( j , k ) j E d X p ( j , k ) ,
to obtain:
π j = 2 ( j - 1 ) α p / 2 1 - 2 α p / 2 1 - 2 α p M / 2 , j = 1 , 2 , M - 1
Equation (9) represents (for every j) the probability that the energy of a long-memory process lies at wavelet scale j. Equation (9) is indeed a pmf since 0 < π j < 1 , j π j = 1 and j 1 π j j 2 π j when j 1 j 2 . Equation (9) is usually called in the literature the relative wavelet energy (RWE) of long-memory signals. By using Equation (9) and the following equation of time domain normalized Tsallis entropy,
H q T ( π j ) = 1 1 - M 1 - q 1 - j = 1 M π j q , = - j = 1 M π j q ln q ( π j ) ,
where ln q ( x ) = ( x 1 - q - 1 ) / ( 1 - q ) , the normalized wavelet-Tsallis q-entropy is obtained. In fact, substitution of Equation (9) into (10) results in the wavelet-Tsallis q-entropy of fGn signals of parameter α = 1 - 2 H , which is given by,
H ^ q T ( π j ; α ) = 1 1 - M 1 - q 1 - 1 - 2 α p / 2 1 - 2 α p M / 2 q 1 - 2 α p q M / 2 1 - 2 α p q / 2
= 1 1 - M 1 - q 1 - P M - 1 2 cosh ( α p q ln 2 4 ) P M - 1 2 cosh ( α p ln 2 4 ) q ,
where P M - 1 ( u ) is a polynomial of the form,
P M - 1 ( u ) = n M - 1 - ( M - 2 ) 1 ! ( u ) M - 3 + ( M - 3 ) ( M - 4 ) 2 ! ( u ) M - 5 -
Equations (11) and (12) represent the wavelet-Tsallis q-entropy of long-memory signals of parameter α using the p-th-order wavelet moment. Equation (12) generalizes the cosh-window behavior of the wavelet-Tsallis q-entropy presented in [47] and can be regarded as a ( p , q ) -cosh window behavior, which permits increased flexibility in the analyses. In the following, the wavelet-Tsallis q-entropy planes for long-memory signals are derived, and the contributions of parameters p, α and M, on the shape and behavior of entropies, are studied. The motivation behind the construction of wavelet-Tsallis q-entropy planes is that they provide useful information of the complexities associated with long-memory signals and, in the same way, permit one to identify potential applications for their analysis/estimation. As derived in [47], wavelet-Tsallis q-entropy planes follow a cosh-window shape; however, the contribution of the wavelet moment order p was not taken into account; therefore, one of the objectives of the article is to generalize these results and show that by using p, increased flexibility in the analyses is obtained. Figure 1 displays the wavelet-Tsallis q-entropy planes for several values of α, M, fixed q and different values of p. For the case q = 5 (left plot), four planes were stacked to compare the rate of decay of entropies as p increases. Note that as p increases, the rate of decay of entropies increases, and therefore, by taking into account the wavelet moment order p in the calculation of the wavelet-Tsallis q-entropy, increased flexibility in the values of entropies is obtained. Similar results are obtained when using q = 10 , i.e., entropies decay more rapidly with higher p. These results complement those presented in [21] and show that different configurations of values for p and q will lead to similar or identical behavior of the wavelet-Tsallis q-entropy. Figure 2 shows a more refined view of the effect of p on wavelet-Tsallis q-entropies for the cases q = 10 and q = 15 . As can be observed from the theoretical wavelet-Tsallis entropies, long-memory processes, which lie in a given range of dependence, are regarded as having the maximum allowable entropy, while long-memory processes lying in the complement range experiment decaying entropies. Since maximum entropy is usually observed in purely random signals, wavelet-Tsallis q-entropy performs a whitening operation in long-memory signals.
Figure 1. Wavelet-Tsallis q-entropy planes for α ( - 1 , 3 ) and M ( 5 , 15 ) . The left plot displays Tsallis planes for q = 5 and the right one for q = 10 . Variations of the entropy planes for different values of the wavelet moment p are also shown stacked. Within each plot, the lower graph corresponds to H p = 5 , q = 5 T , the next on top to H p = 5 , q = 4 T + 0 . 33 , the next to H p = 5 , q = 3 T + 0 . 66 and the upper one to H p = 5 , q = 2 T + 1 .
Entropy 17 07856 g001
Figure 2. Wavelet-Tsallis planes for fixed length M. The left plot displays the wavelet-Tsallis entropies for q = 10 and different values of the parameter p. The right plot depicts the wavelet-Tsallis entropies for q = 5 and p = { 3 , 4 , 5 } .
Entropy 17 07856 g002
The range of maximum entropy is controlled not only by parameter q, but also by the order p of the wavelet moments. This behavior of wavelet-Tsallis q-entropies, for the case p = 2 , has been employed in the literature for the problem of model classification in scaling signals [21]. Wavelet-Tsallis q-entropy can also be used for the problem of mean level-shift detection and location. In fact, the work of Stoev [12] demonstrates that an fGn signal with a single level-shift results in an estimate of H = 1 (using the wavelet technique). Note that this H = 1 value is inadmissible in the definition of long-memory signals and can be advantageously used for the detection and location of level-shifts in long-memory signals using wavelet-Tsallis q-entropy and a standard peak detection methodology. In the following, we run an experimental study to observe the behavior of wavelet-Tsallis q-entropy in fGn signals with single and multiple mean breaks.

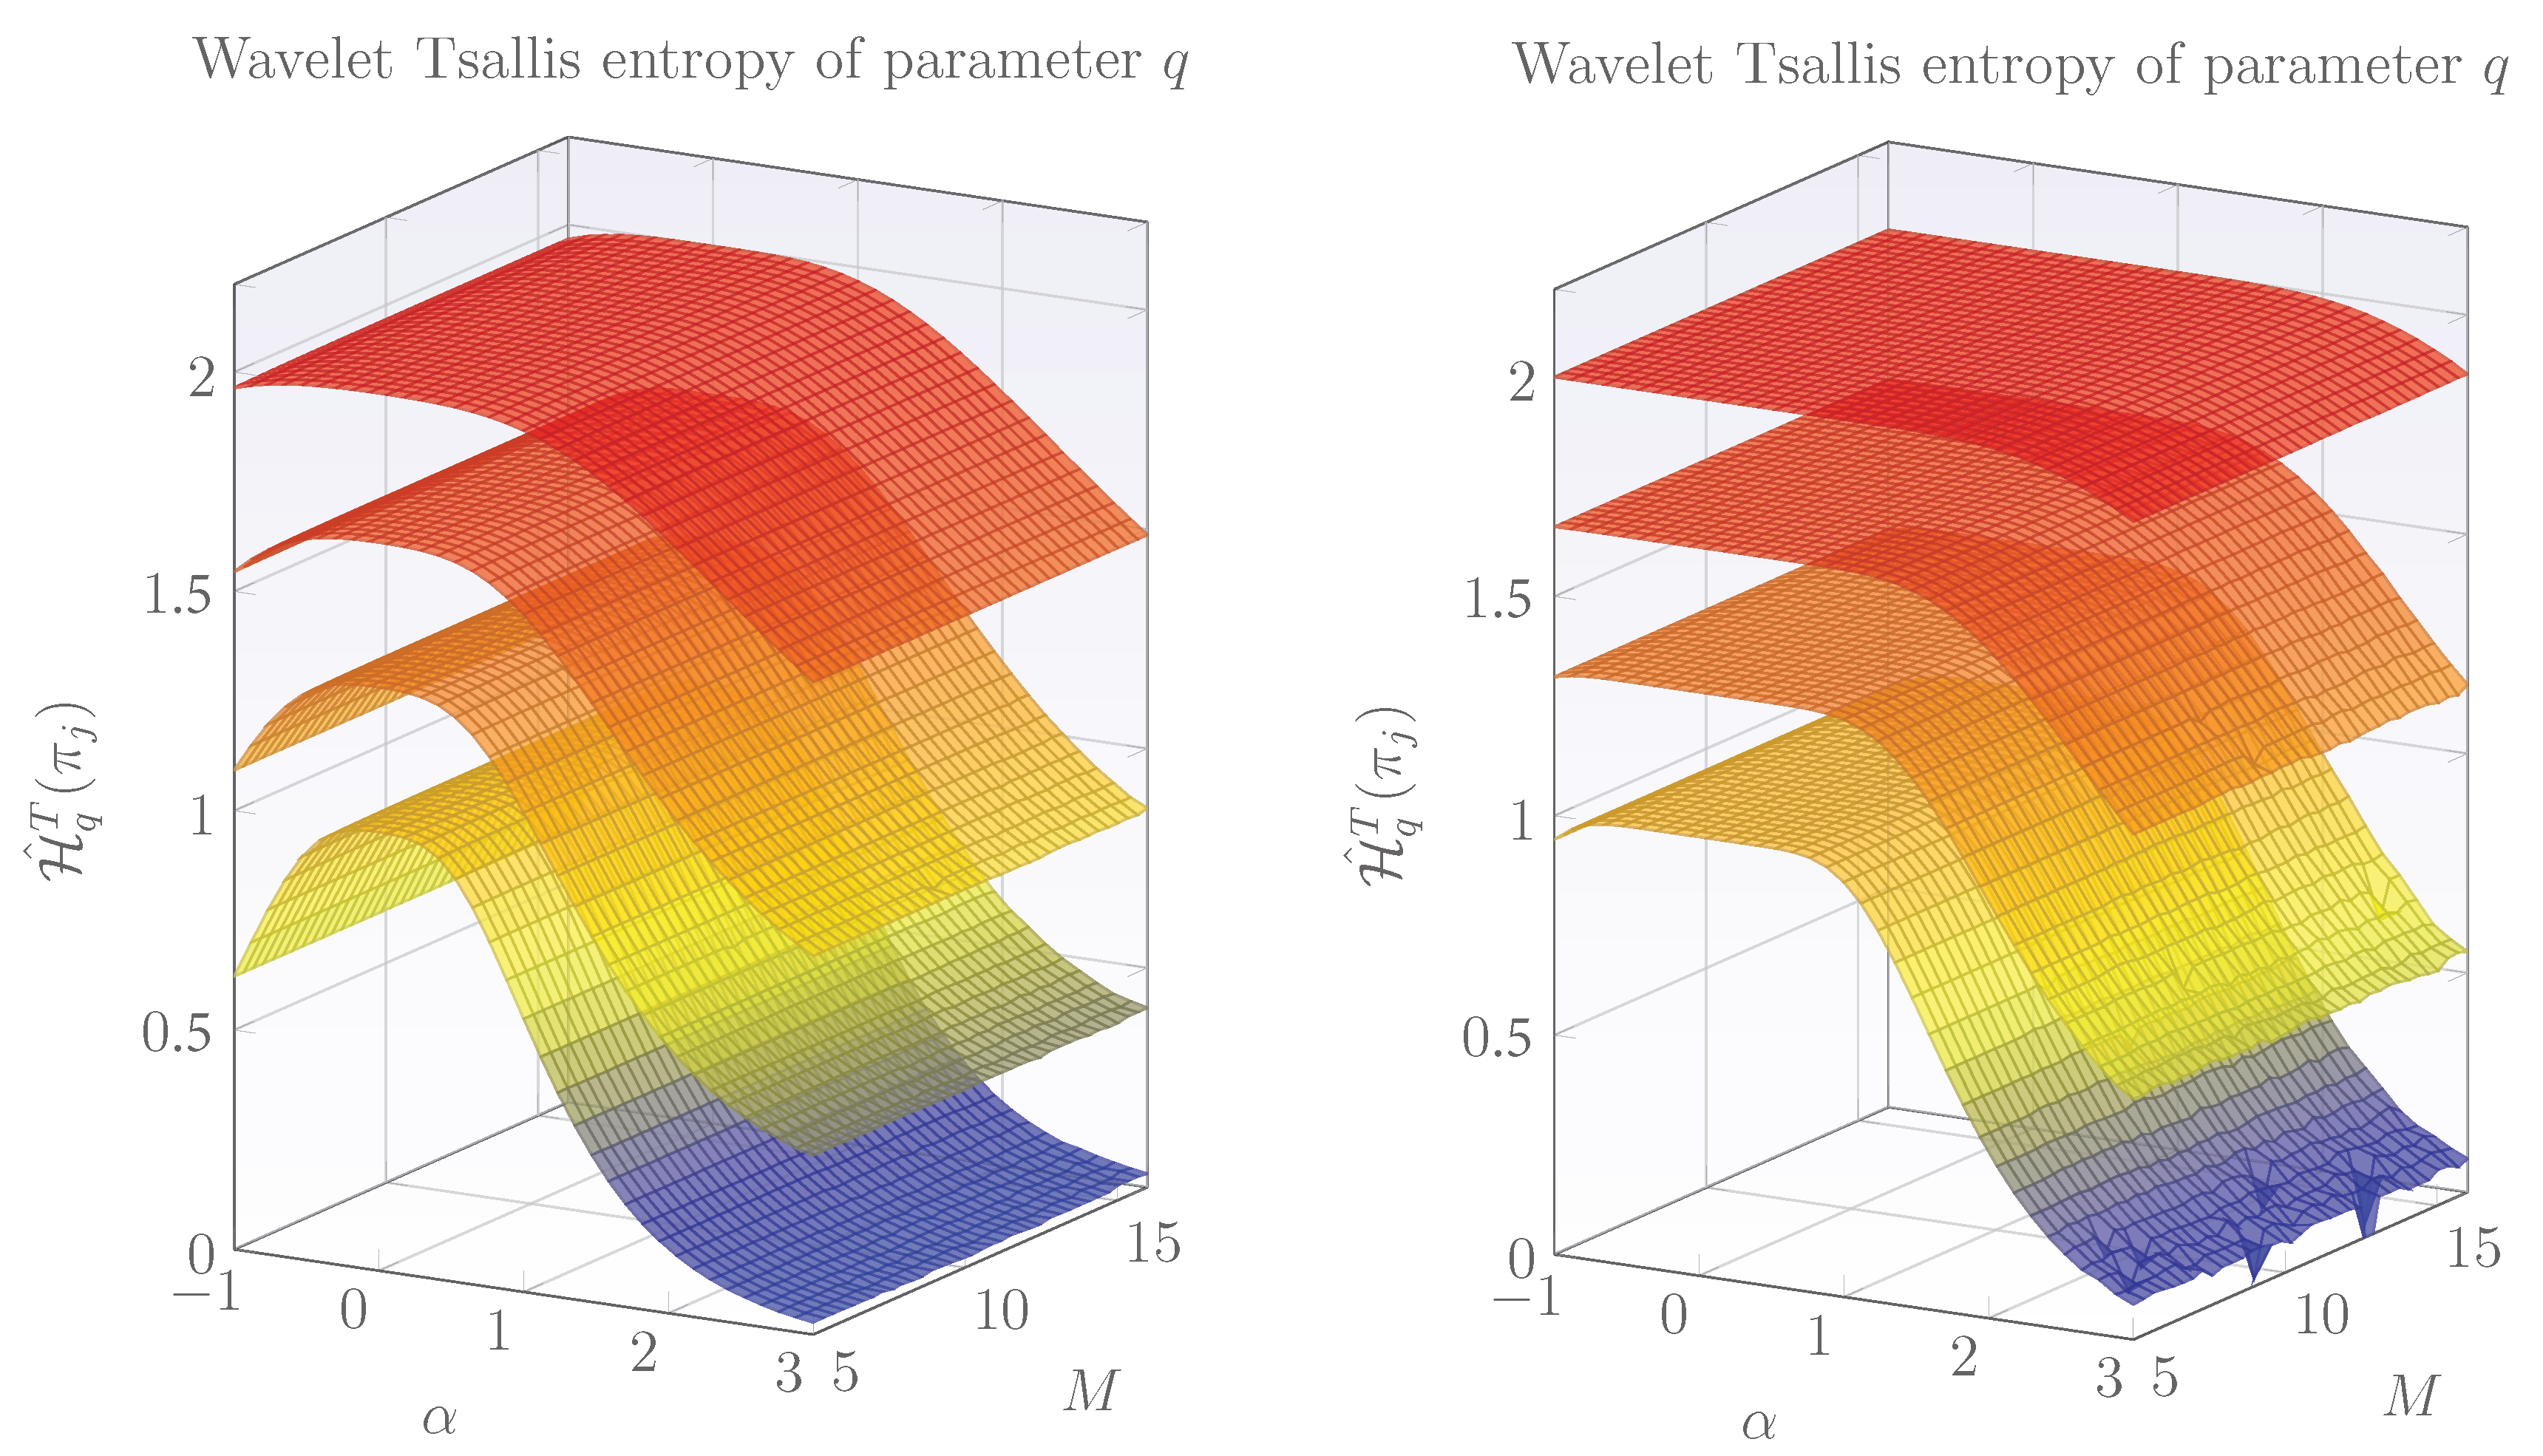
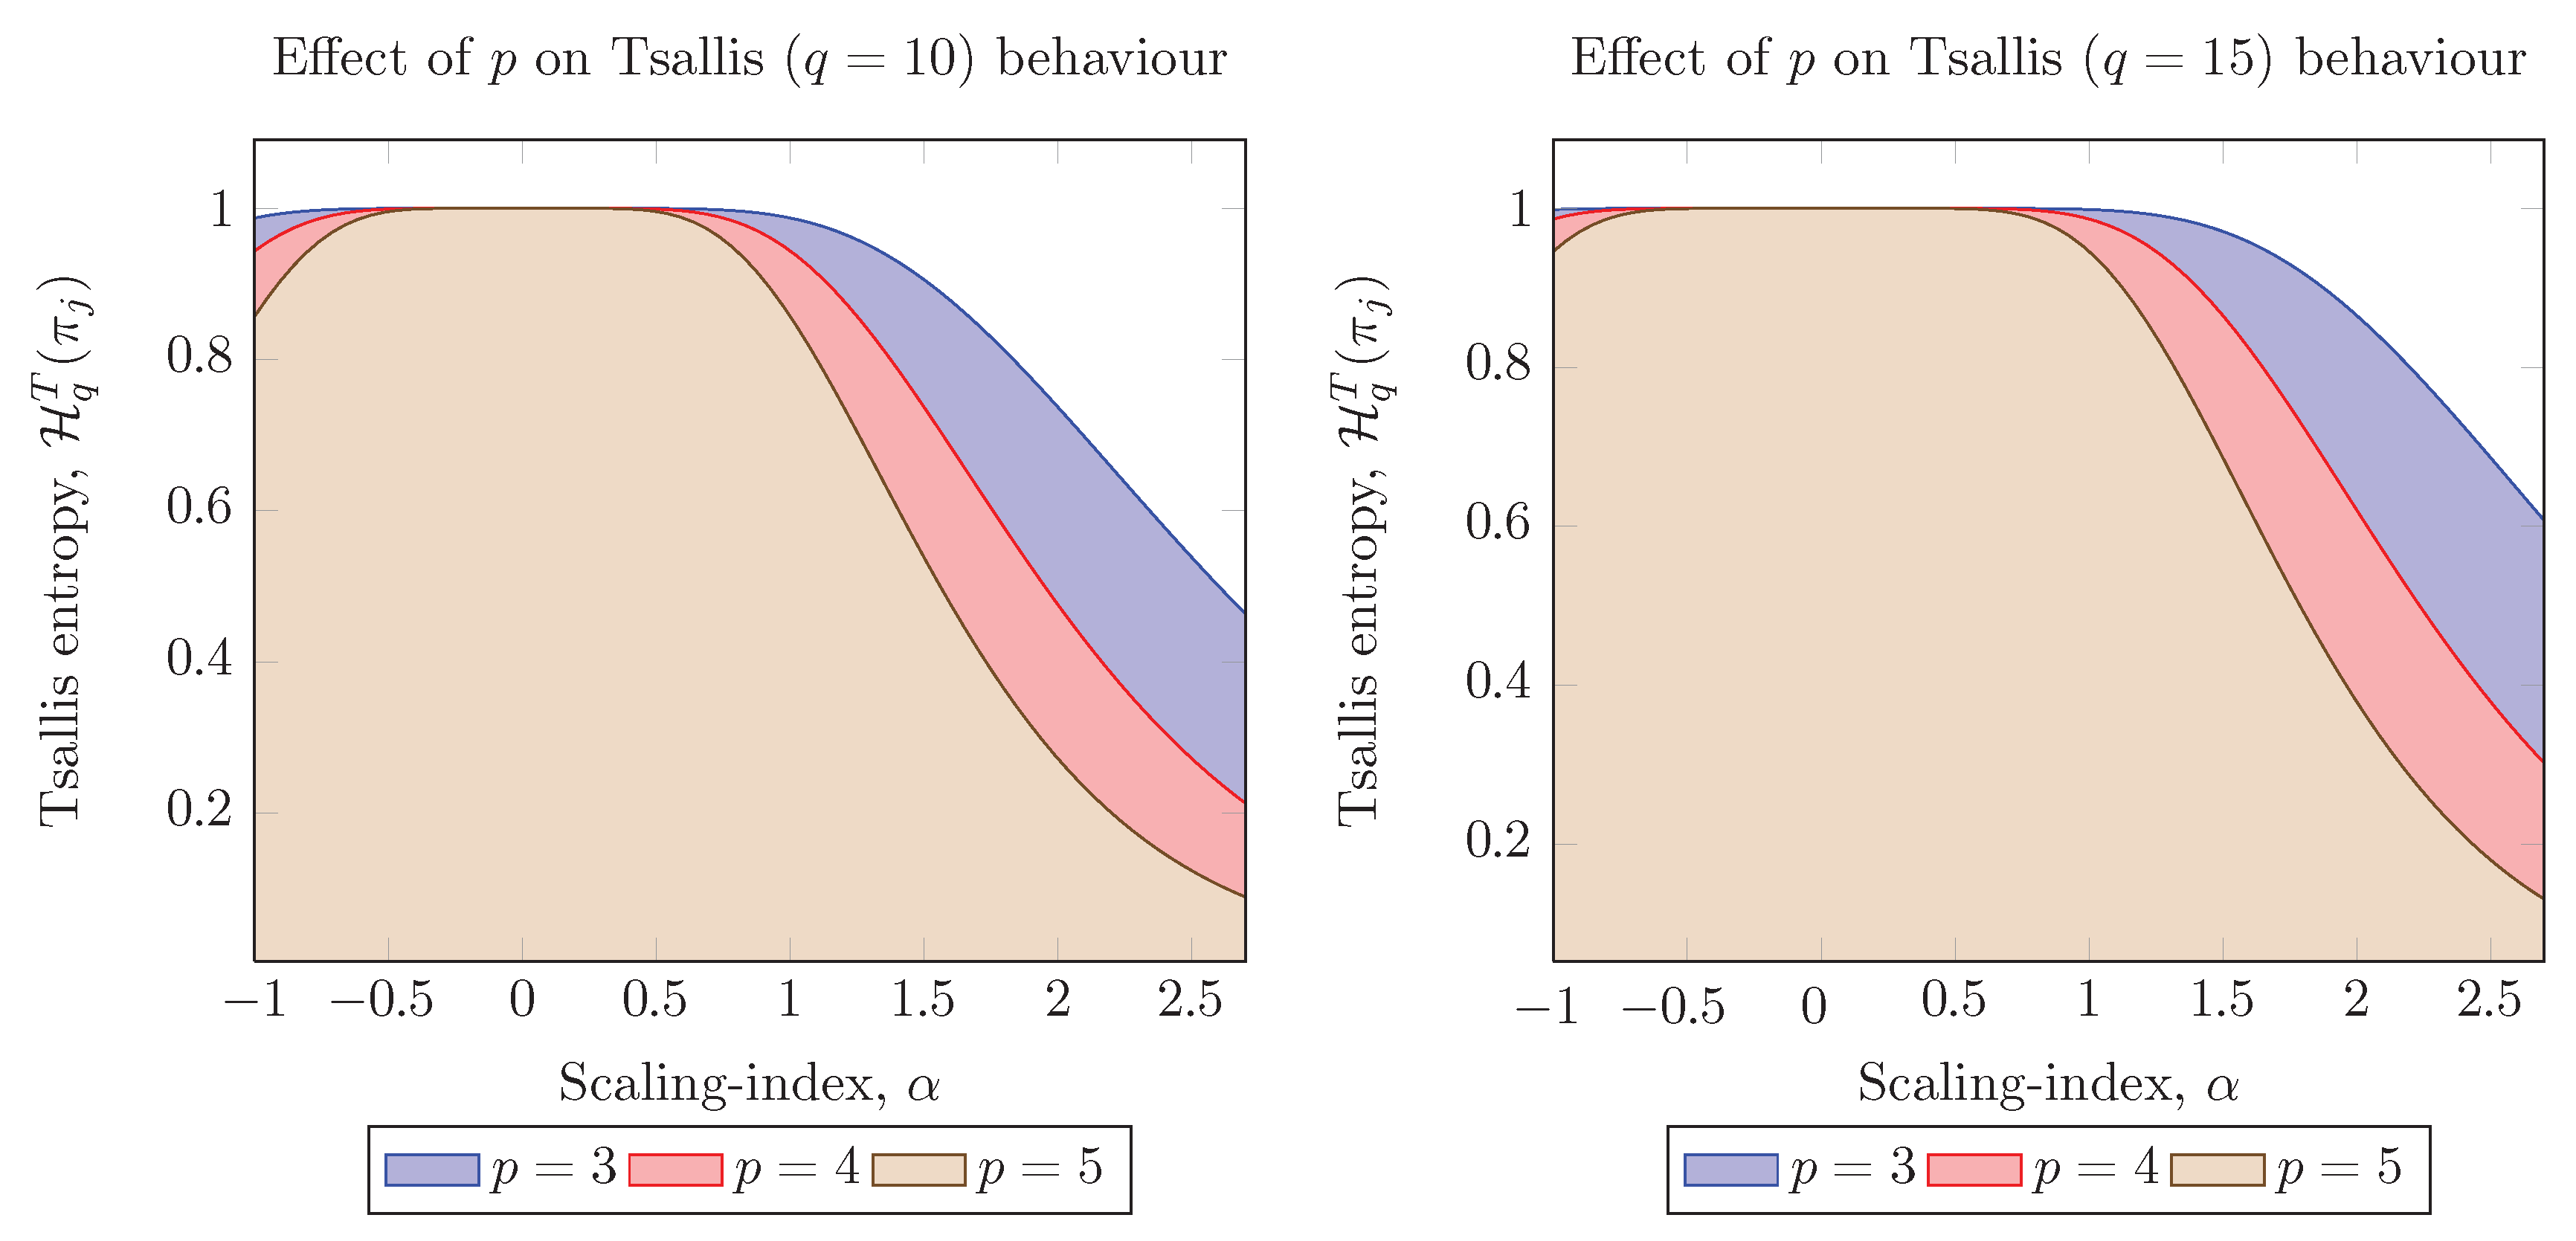
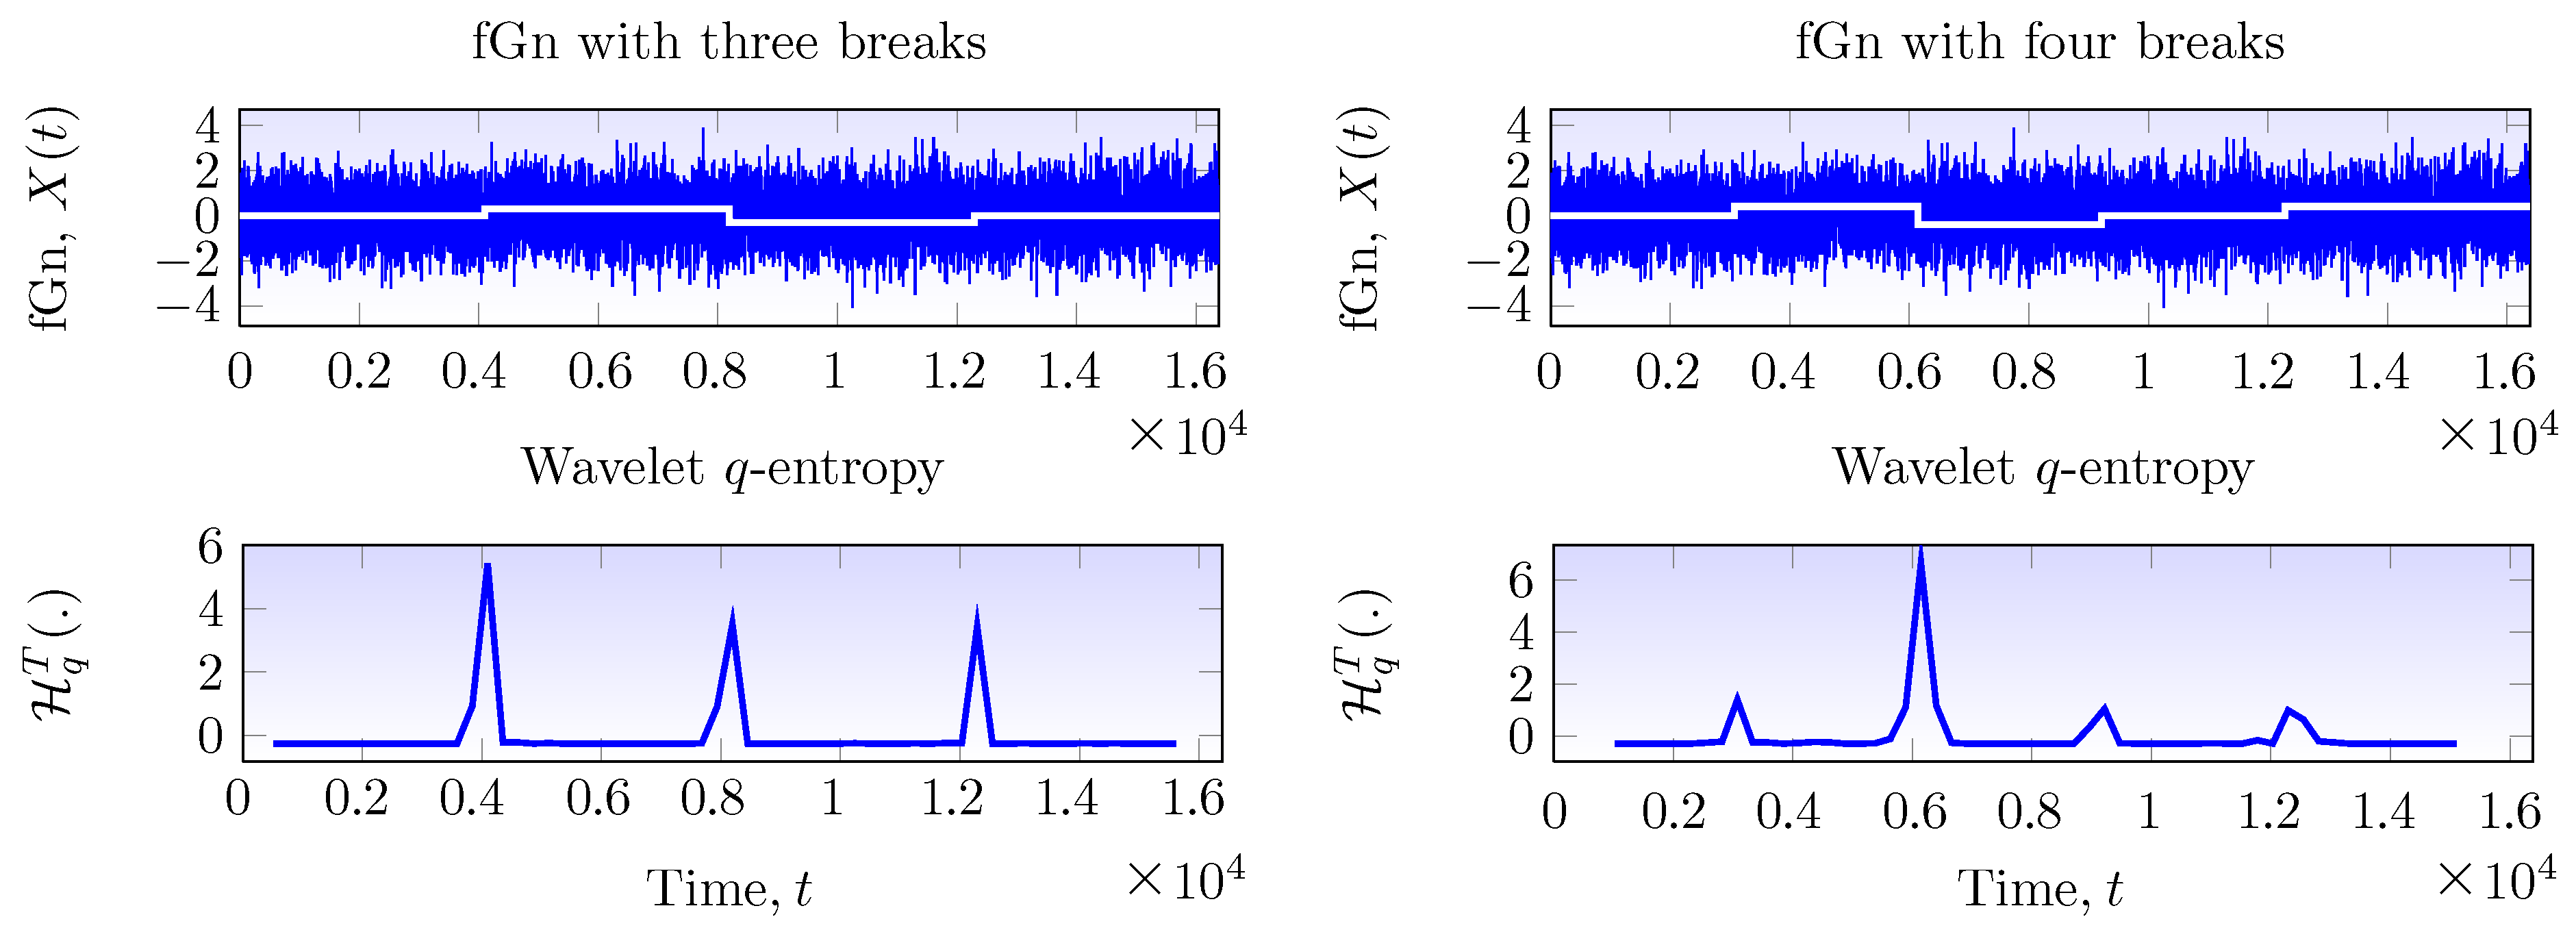
3.1. The Analysis of fGn Signals with Level-Shifts via Wavelet-Tsallis q-Entropy

To verify the appropriateness of wavelet-Tsallis q-entropy for the level-shift detection and location problem, an experimental study is run on long-memory fGn signals with level-shifts. FGn signals with multiple mean breaks are synthesized, and then, the wavelet-Tsallis q-entropy of these signals is obtained as a function of time to observe the behavior of entropies. Figure 3 displays the wavelet-Tsallis q-entropy of an fGn signal (length N = 2 14 and H = 0 . 6 ) with two mean level-shifts. Two types of mean level-shifts are considered in this figure; two opposite breaks and two positive breaks. The first column of Figure 3 shows an fGn signal with two opposite breaks with amplitudes ± σ / 5 along with their wavelet-Tsallis q-entropies. Note that the wavelet-Tsallis q-entropies (after applying a 1 - H q T ( . ) and baseline correction) are almost zero, except in the break date, where they display an impulse-shaped or peak form. It is important to note at this point that the amplitude of the level-shifts within the fGn signal are imperceptible, and the white lines of the plot are for reference purposes only. The second column of Figure 3 displays the analysis of an fGn signal (same N and H) with two positive breaks ( σ / 5 and 2 σ / 5 ). Note that entropies experience similar behavior, i.e., peaks are observed, and the location of these coincide with that of the break date.
Figure 3. Fractional Gaussian noise (fGn) signals with two mean level-shifts. The first column displays the signal with two opposite breaks and their corresponding wavelet-Tsallis q-entropy. The second column displays the same type of analysis using two positive breaks within the fGn signal with H = 0 . 6 .
Entropy 17 07856 g003
Therefore, the presence of weak level-shifts within fGn signals is detected by the presence of peaks in their wavelet-Tsallis q-entropies. The break date is obtained by estimating the location of the peak within the entropies. Figure 4 considers the case in which three and four breaks are located within the fGn signal of length N = 2 14 and parameter H = 0 . 6 . The first column of Figure 4 considers the case in which three breaks are within the fGn signal and the second column when four. Observe that in either case, level-shifts are mapped into peaks, and the location of each peak coincides with that of the break date. This behavior is also observed in fGn signals with a different value of H = 0 . 6 . In fact, the peaks are more prominent in H < 1 / 2 values, while for H > 1 / 2 , the peaks are of lower amplitudes. As a matter of fact, the amplitude of the peak may be modified with parameters p and q to increase detection and location capability. Based on these results, a computationally-efficient methodology for level-shift detection and location is proposed. The methodology, based on the wavelet-Tsallis q-entropy as a pre-processing technique and a standard peak detection and location methodology, permits one to detect and locate weak level-shifts within fGn signals. In the following, a description of the proposed methodology is detailed, and a comparison study with standard level-shift detection and location methodologies is performed.
Figure 4. fGn signals with multiple mean level-shifts. The first column displays the signal with three breaks and their corresponding wavelet-Tsallis q-entropy. The second column displays the same type of analysis using four multiple mean breaks within the fGn signal with H = 0 . 6 .
Entropy 17 07856 g004

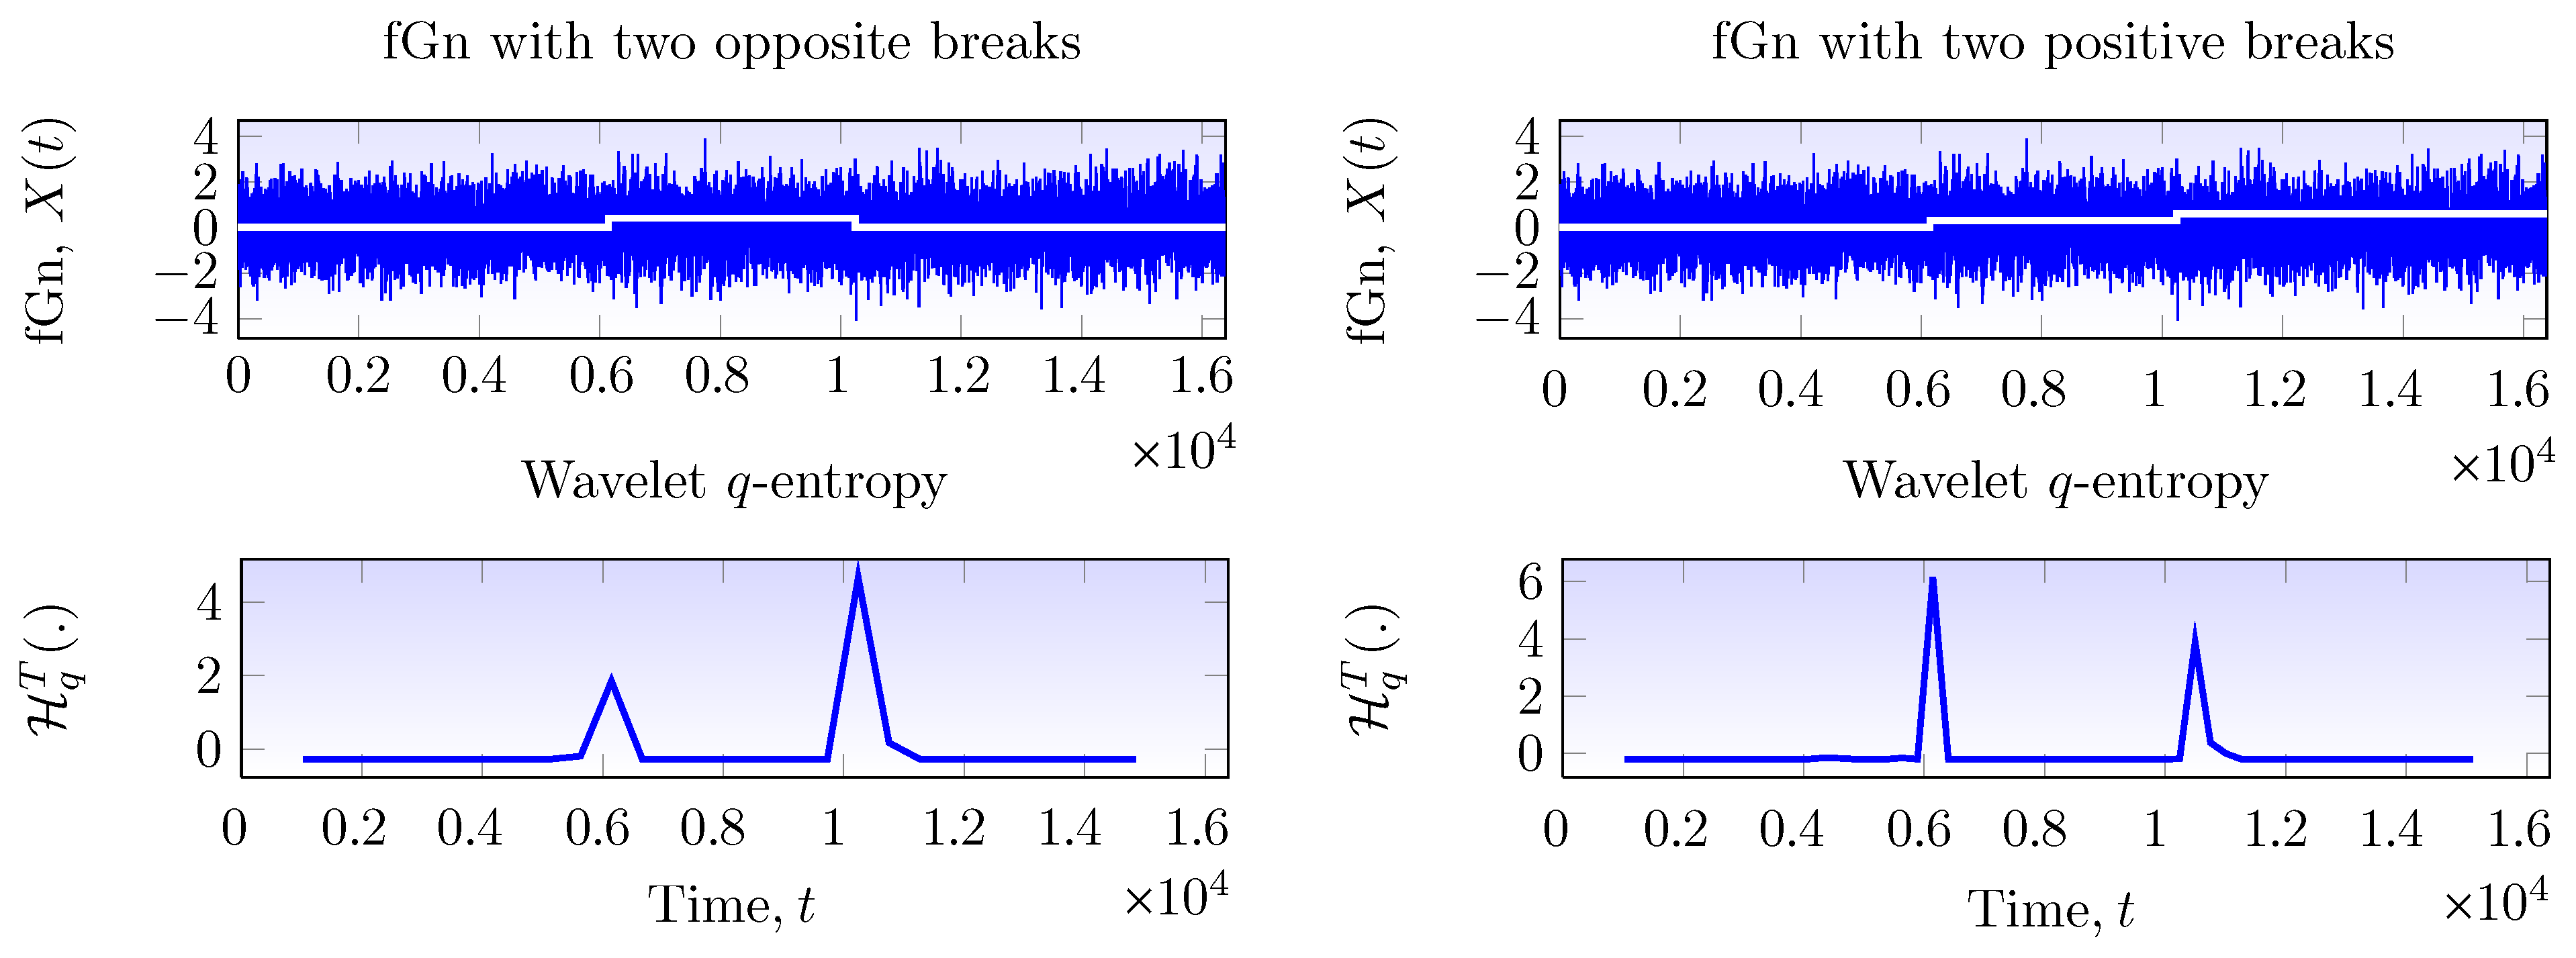
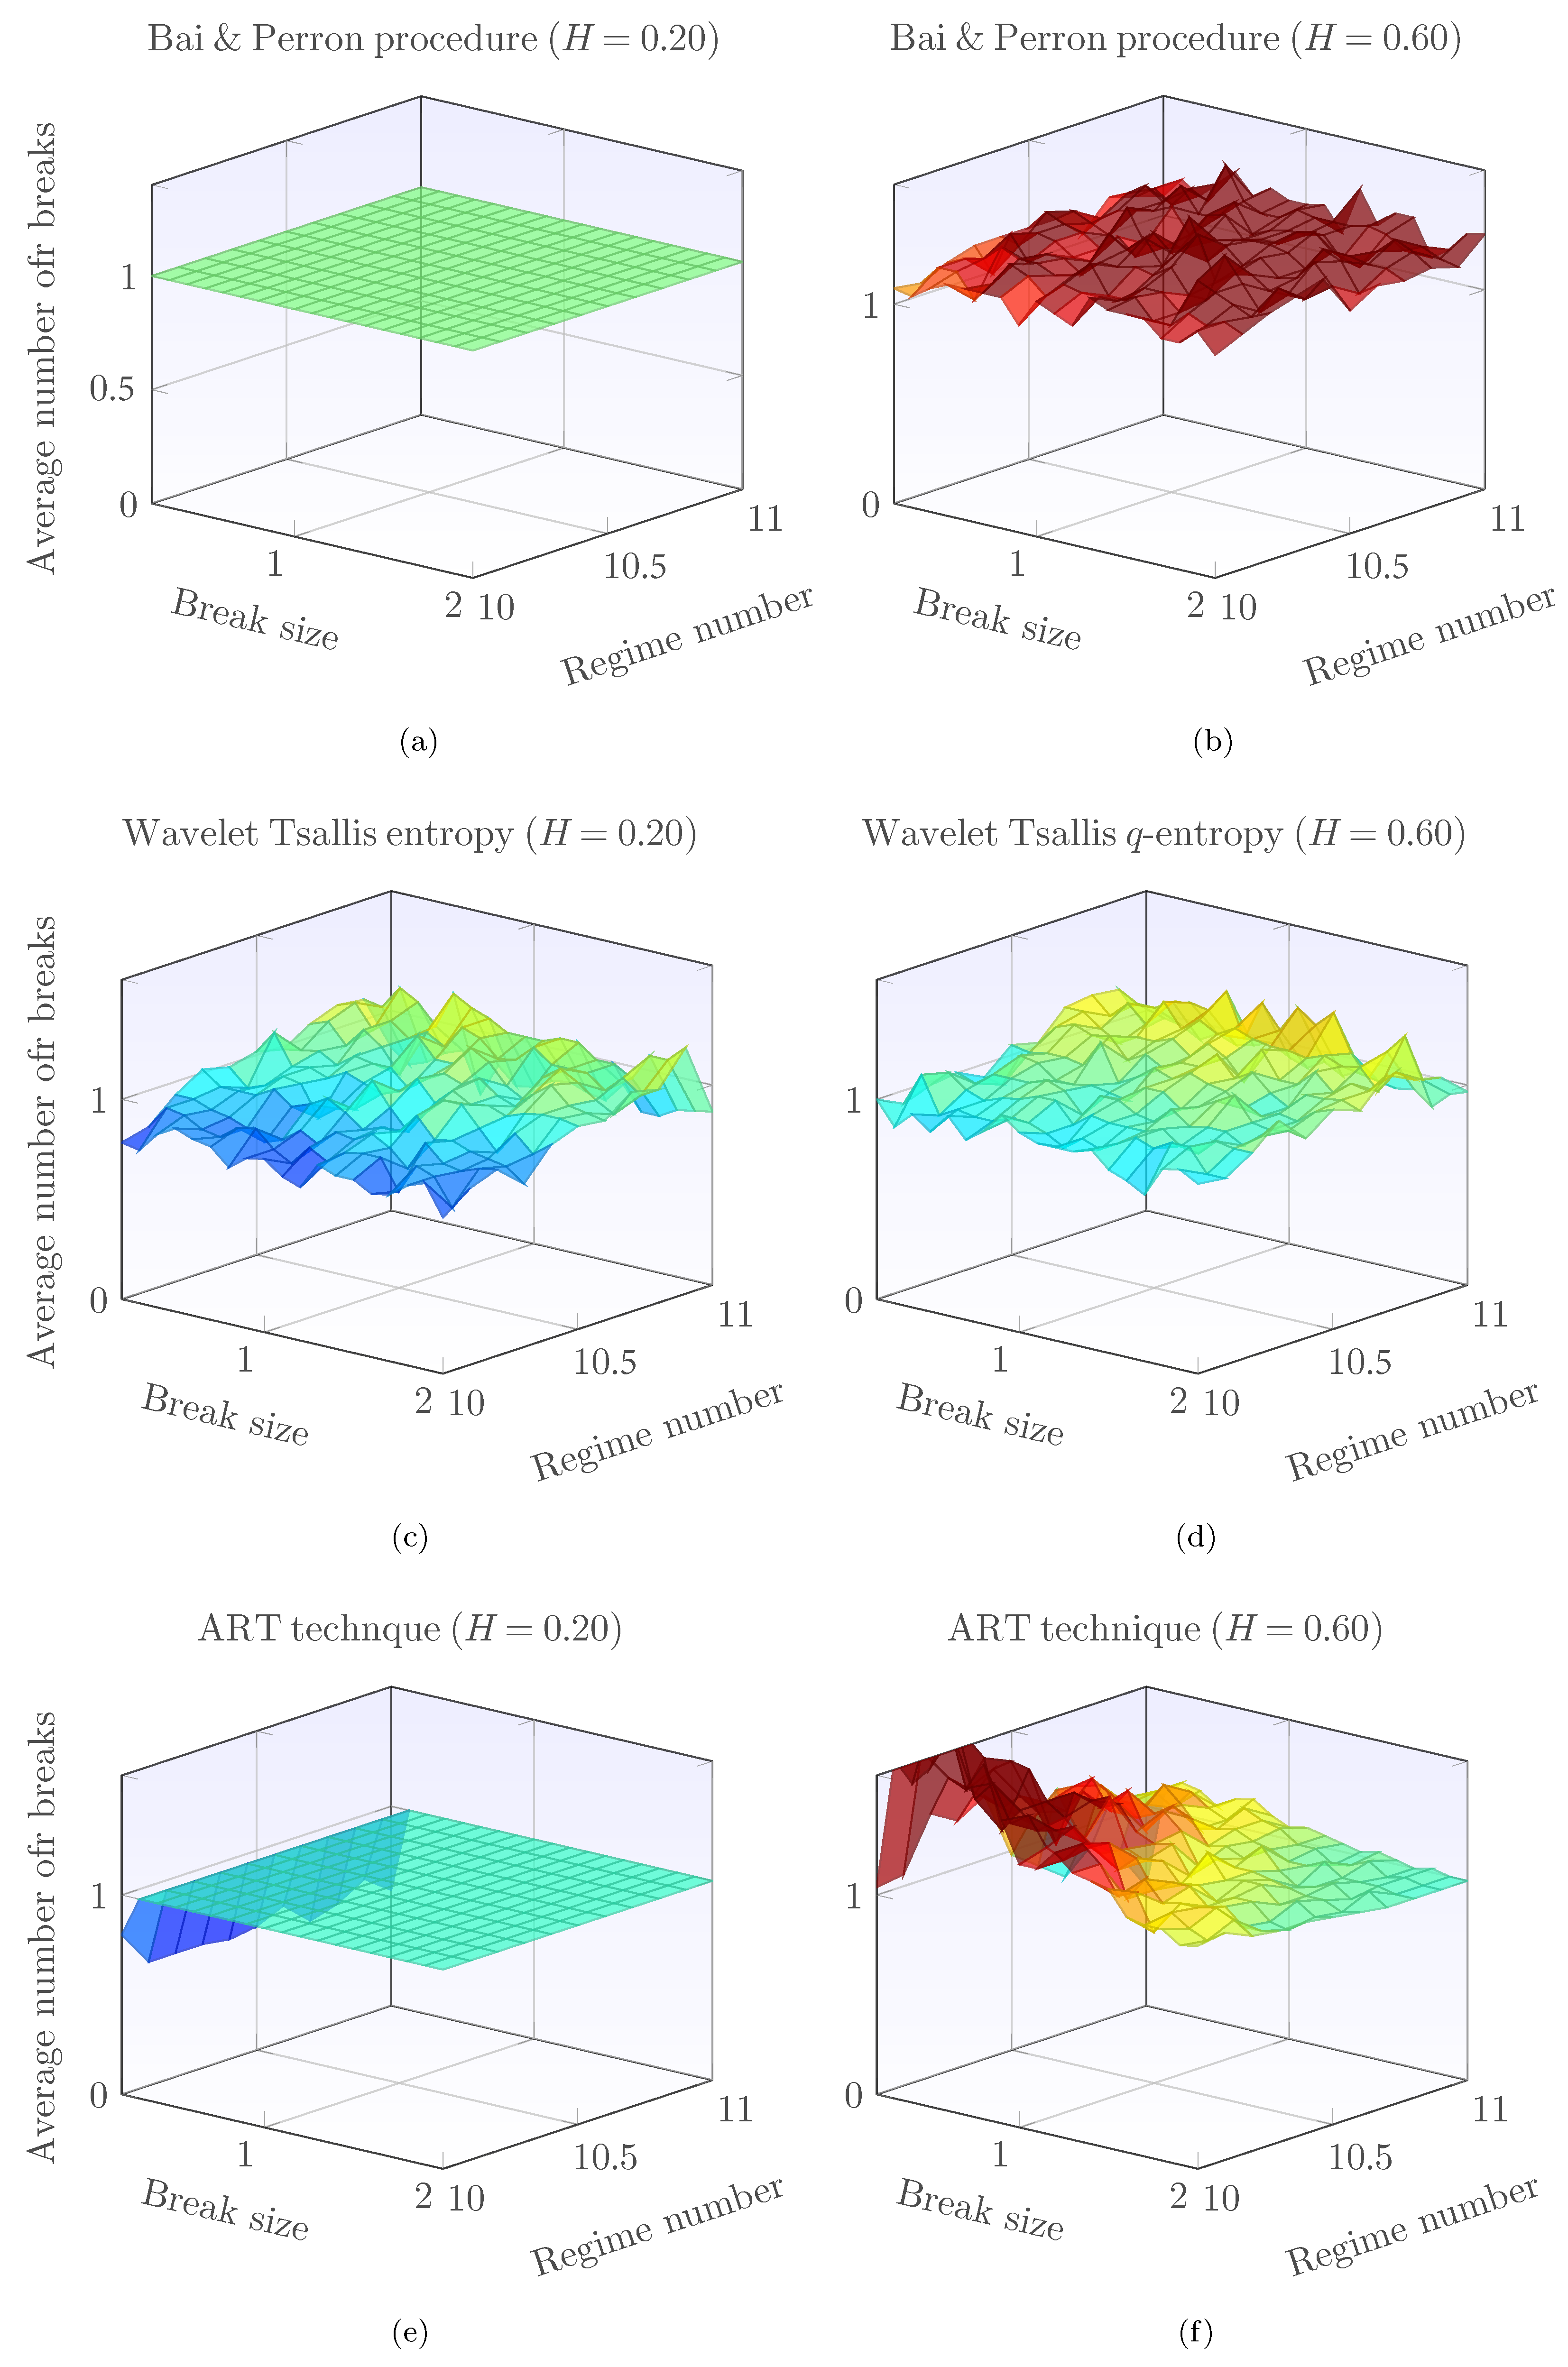
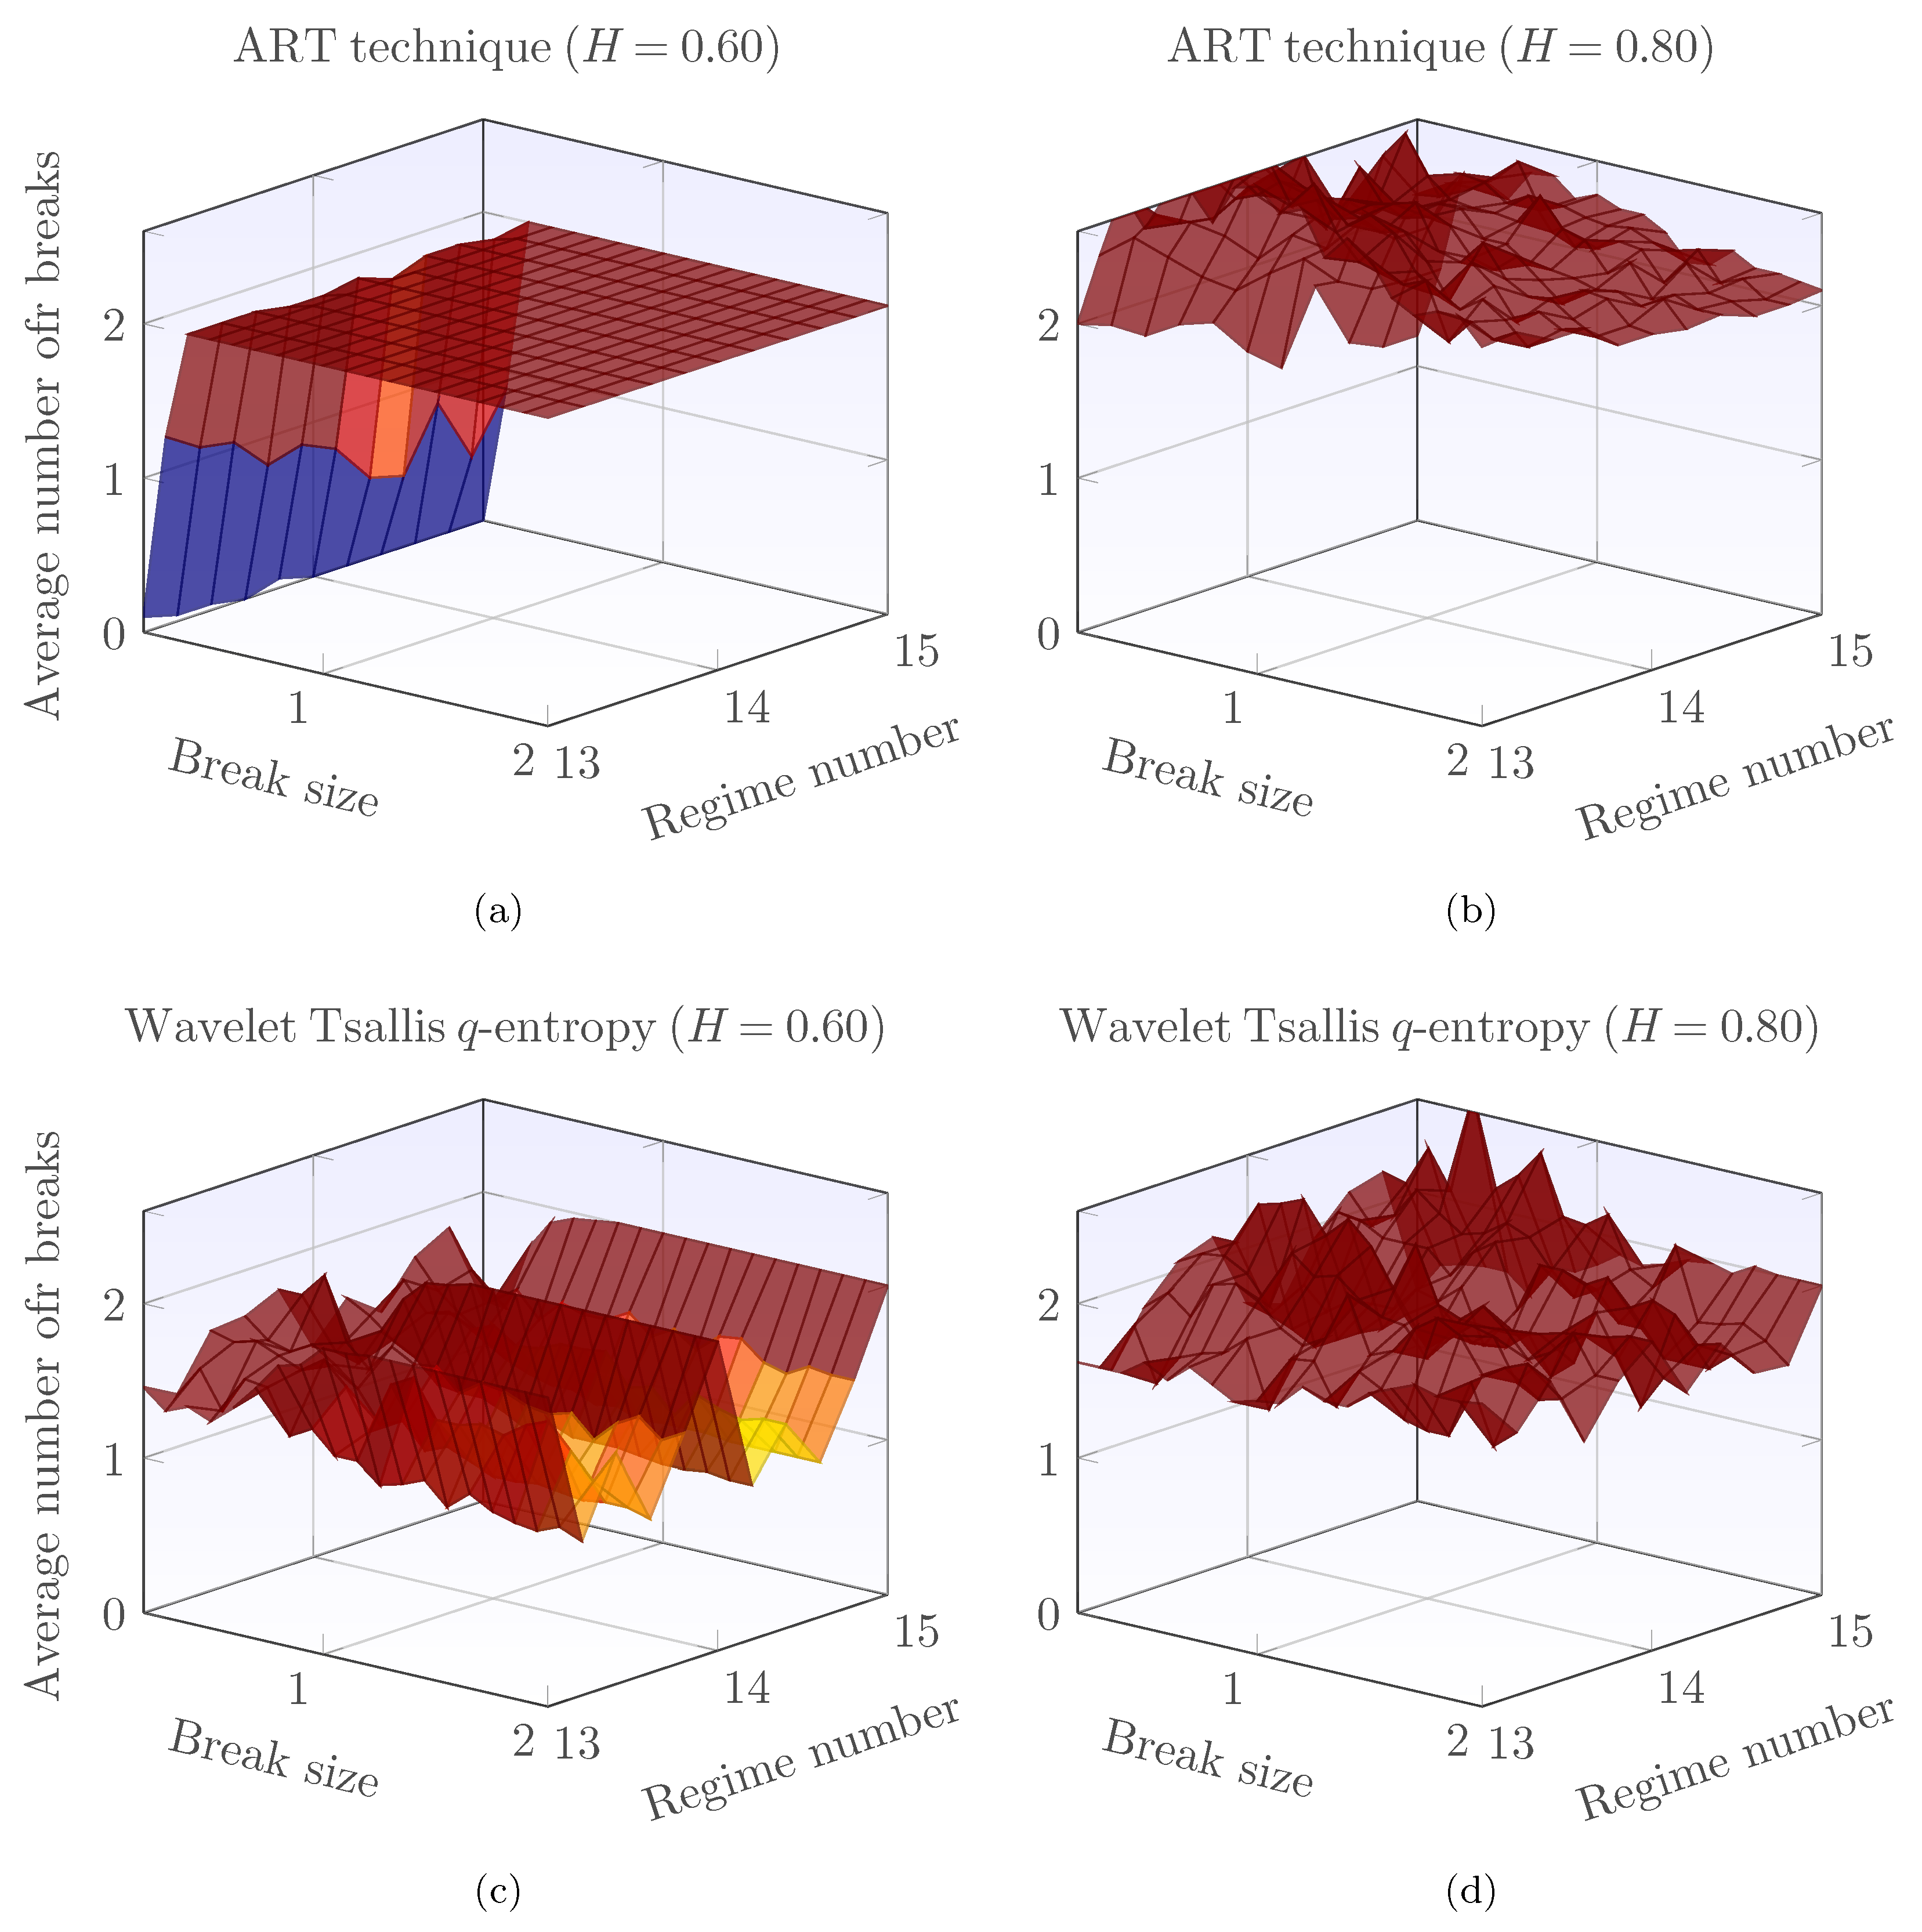
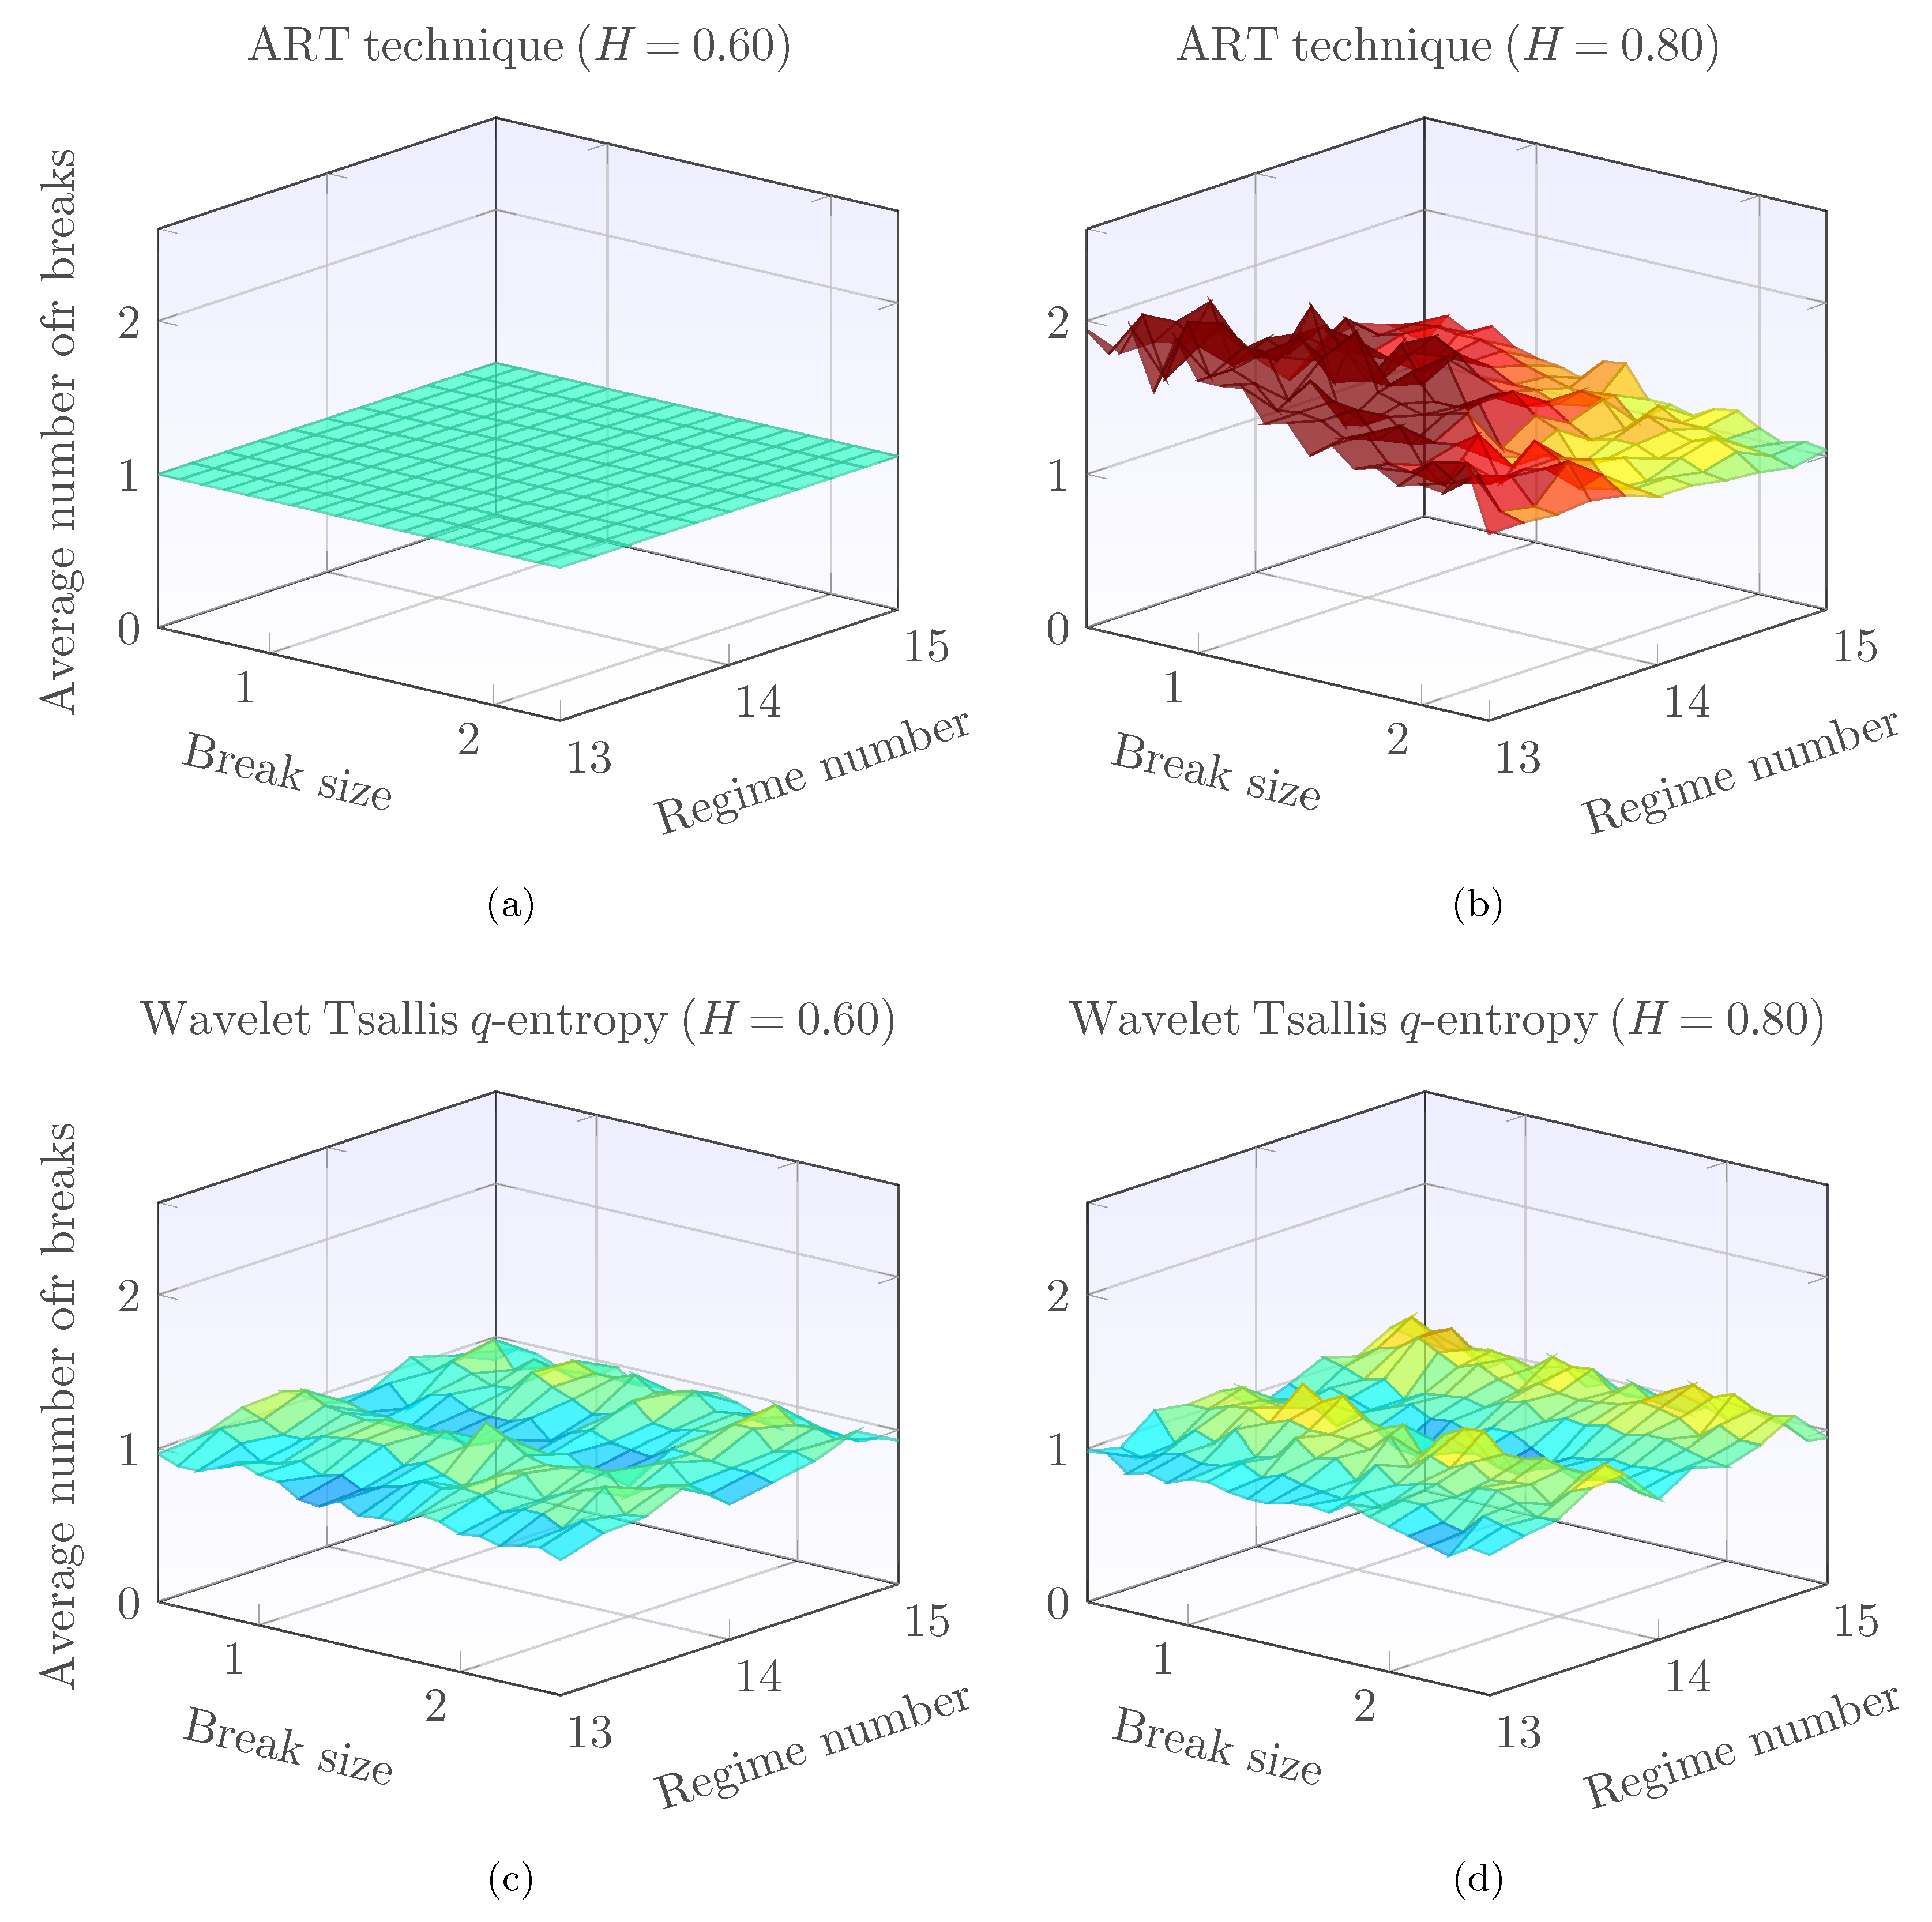
4. A Technique Based on Wavelet-Tsallis q-Entropy for Level-Shift Detection and Location

Structural breaks are common in time series [48], and their presence is the source of many forecast failures in econometrics and finance. Structural breaks have also been observed in geophysics [49,50] and computer network traffic [12], among others [51]. In this contribution, a fast and robust technique for level-shift detection and location based on wavelet-Tsallis q-entropies and a simple peak detection procedure are proposed [52]. Let X ( t ) be an fGn signal; suppose N level-shifts are added to this fGn signal; thus, the fGn signal with N level-shifts is given by the following equation,
B ( t ) = X ( t ) + j = 1 N μ j u ( t - t j )
where u ( t ) is the unit step function and μ j is a constant. The level-shift detection and location problem considered in this paper is therefore a problem of estimating the number of breaks within B ( t ) and the break dates t j . Many procedures for the level-shift detection and location problem have been proposed [53]. The Bai and Perron technique along with the classification and regression trees (CART) methodology [49,50,51] have gained particular prominence. In this article, a novel methodology for level-shift detection and location using wavelet-Tsallis q-entropy is proposed. The motivation behind the application of wavelet-Tsallis q-entropy is based primarily on the analysis results in fGn signals with multiple mean breaks presented above. Based on these observed results (of the previous subsection), the new level-shift detection and location technique is composed of the following steps:
(1)
Compute the wavelet-Tsallis q-entropy as a function of time to signal B ( t ) to obtain H q T ( . ) .
(2)
Perform a 1 - H q T ( . ) transformation and a baseline correction to obtain positive peaks.
(3)
Detect and locate peaks in the baseline-corrected wavelet-Tsallis signal using a standard peak detection and location methodology.
The peaks detected and located in the wavelet-Tsallis signal coincide with the location of the mean level-shifts of the original signal B ( t ) . In the following, the accuracy of the proposed technique in locating and detecting multiple mean breaks is tested. In parallel, a comparison study against the Bai and Perron and the atheoretical regression (ART) technique is performed.

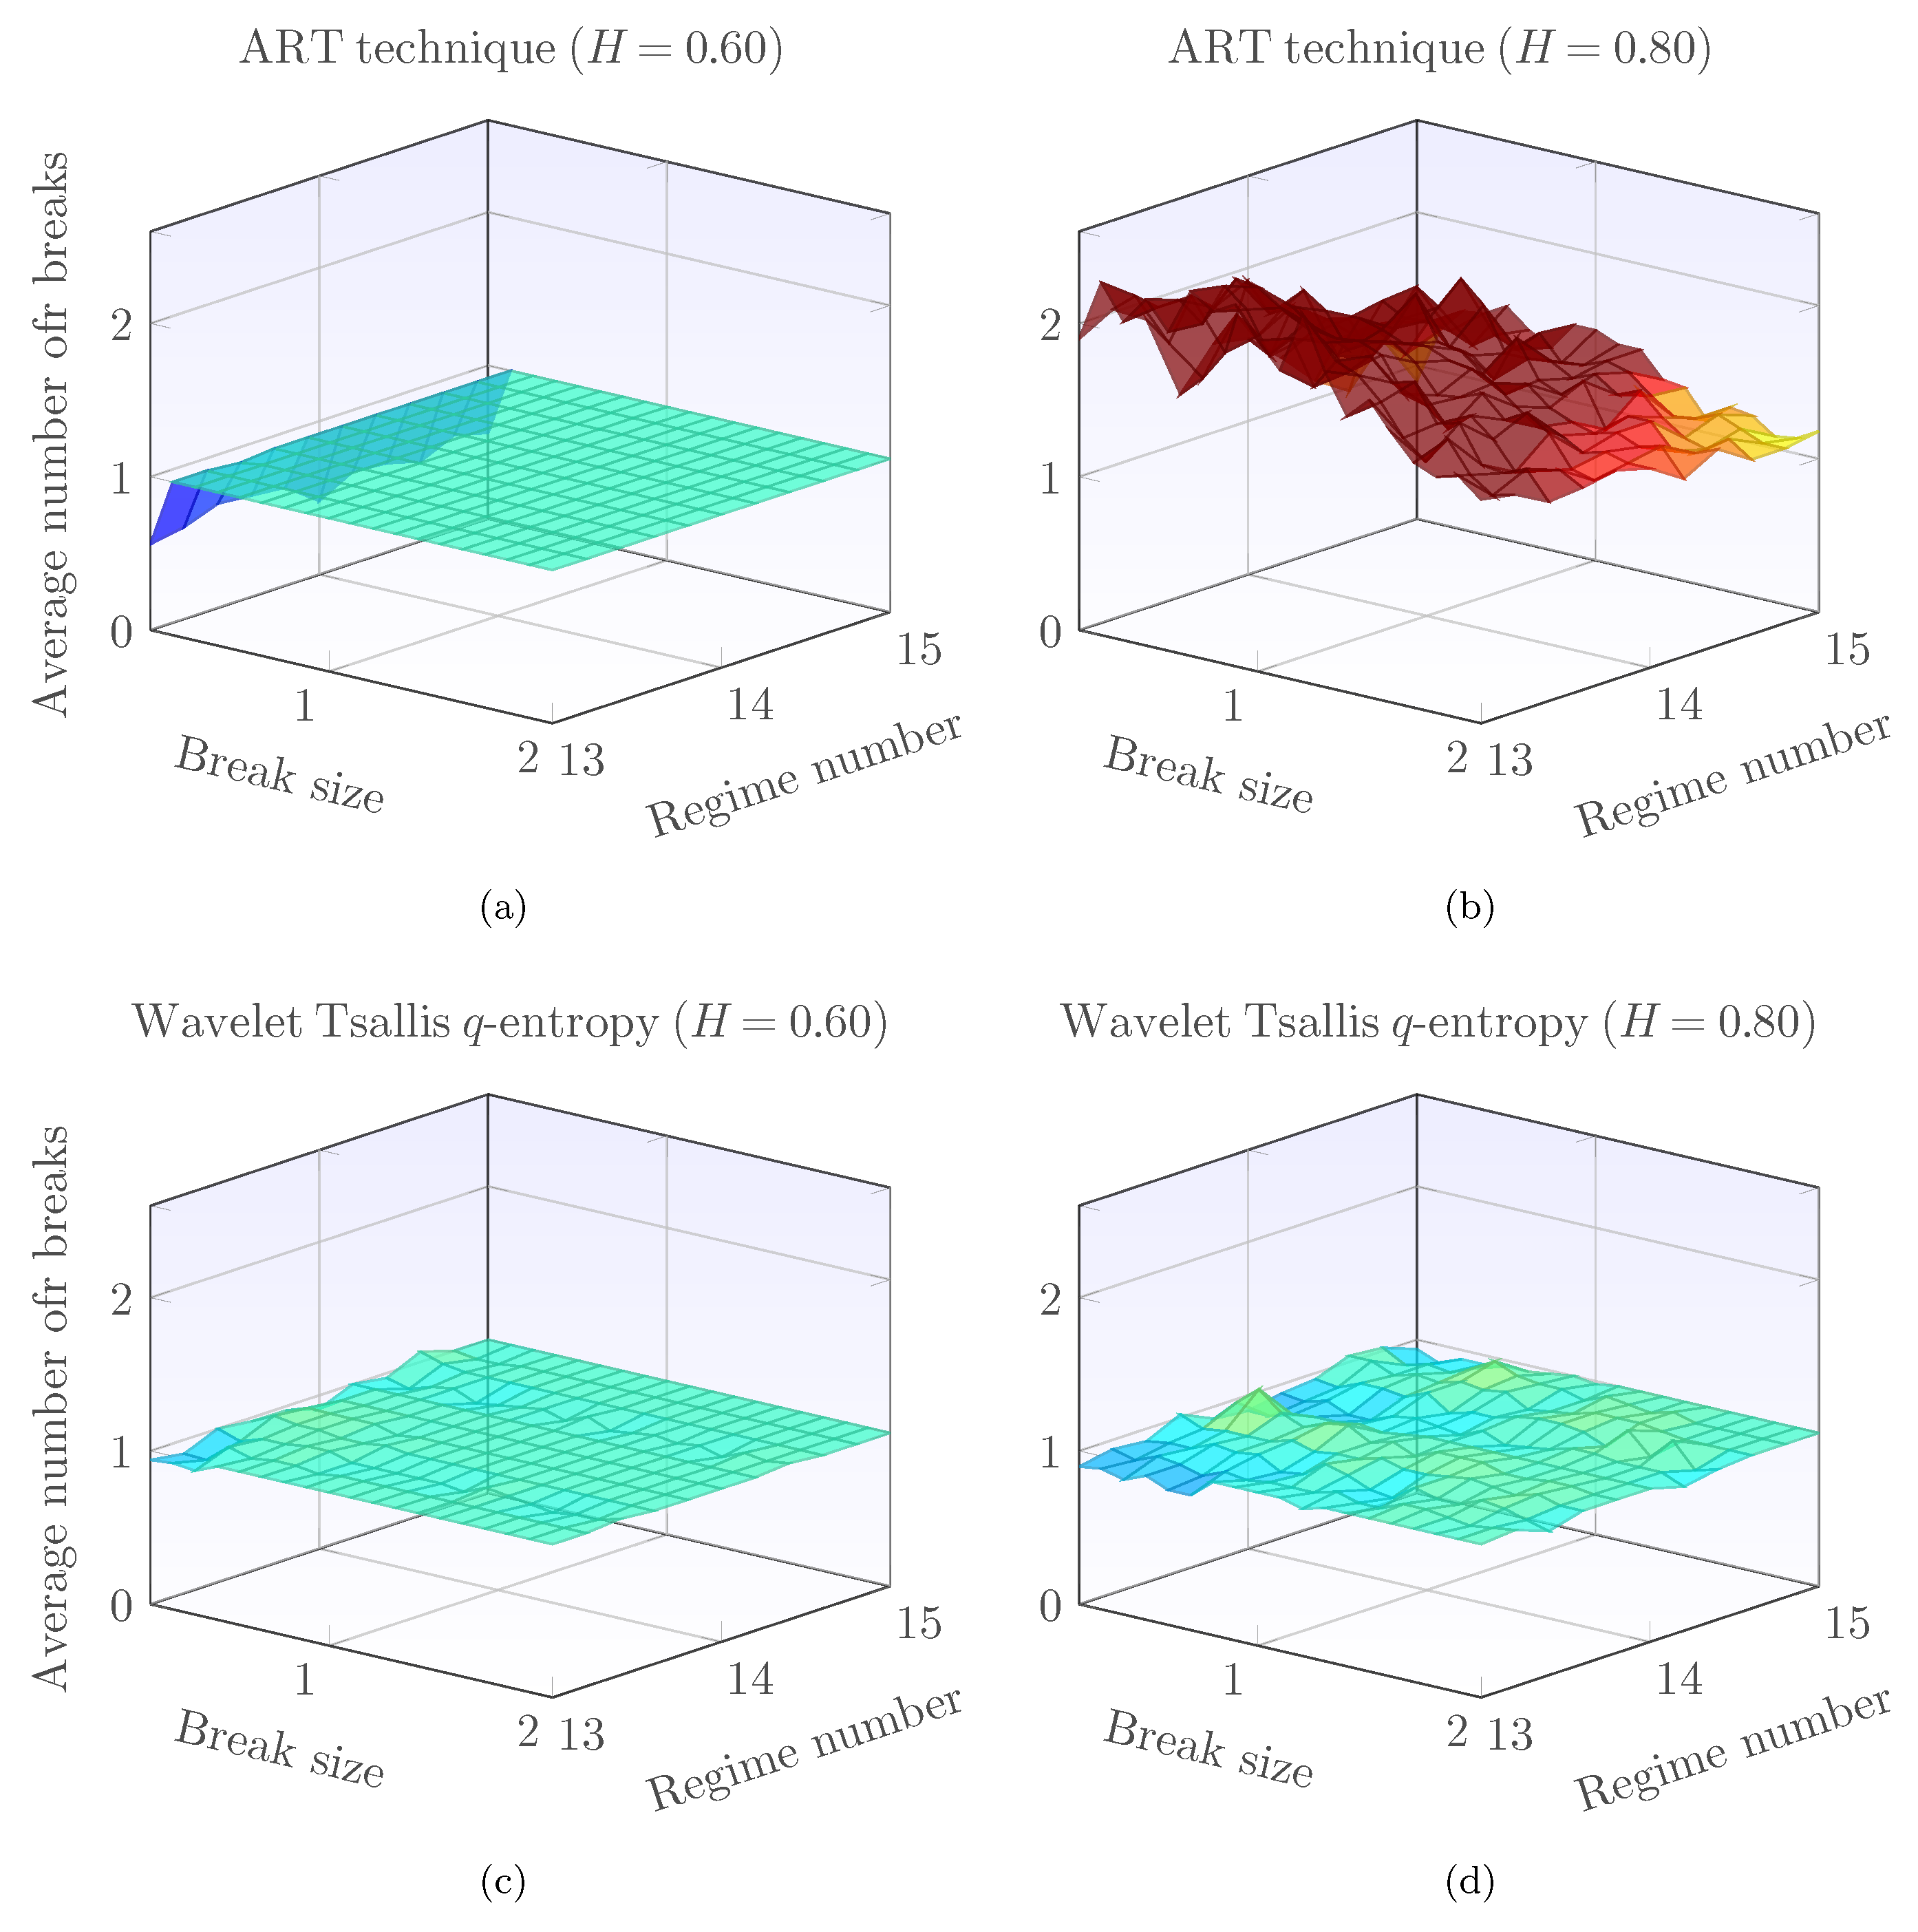
5. Results and Discussion

In the following, the results of a simulation experiment to test the accuracy of the proposed methodology are presented. In parallel, the results of the Bai and Perron and the CART technique are also presented, and a comparison study is performed. The CART technique was implemented using the tree package of the R statistical computing environment, and the wavelet-Tsallis q-entropy was implemented using the wavethresh package. The strucchange package of R was used for the Bai and Perron technique. The synthesized fGn signals are generated using the Davies and Harte algorithm implemented in the fractal package of R.

5.1. Detection of Single Level-Shifts in Short-Length fGn Signals

Figure 5 displays the average number of breaks estimated in synthesized, short-length fGn signals with a single level-shift. Each point in the plot represents the mean of the estimated number of breaks in 50 fGn signals. The Bai and Perron technique (Figure 5a) has excellent detection capabilities for short-memory fGn signals, since it presents no bias and zero variance; however, when H = 0 . 6 (Figure 5b), it presents small bias and variance. In fact, the Bai and Perron procedure experiences considerable bias and variance when H 1 . An important disadvantage of the Bai and Perron technique is the computational complexity, which makes the technique very slow and impractical for long fGn signals.
The technique based on wavelet-Tsallis q-entropy (Figure 5c,d), on the other hand, presents small bias and variance in short and long-memory scenarios, and this behavior is also preserved in other values of the parameter H. The ART technique (Figure 5e,f) presents excellent performance for fGn signals with short memory; however, in long-memory signals, it presents considerable bias in weak and medium-sized breaks. In the following, long fGn signals are considered; therefore, the Bai and Perron technique is not considered, due to is high computational cost.

5.2. Detection of Single and Multiple Mean Breaks in Long fGn Signals

In the following, the detection of single and multiple mean level-shifts in long fGn signals is considered. Figure 6a,b presents the average number of breaks detected by the ART technique in synthesized fGn signals with a single breakpoint. For light dependence (Figure 6a), the ART technique performs well, except for small break sizes, where it has a considerable bias. For strong dependence (Figure 6b), the ART technique has considerable bias and variance. The technique based on wavelet-Tsallis q-entropy, on the other hand, has small bias and variance in light (Figure 6c) and strong dependence (Figure 6d). In fact, increasing the dependence structure in the fGn signal has the effect of increasing the bias and variance of the level-shift detection procedures; however, for the wavelet-Tsallis q-entropy, this increase is slight.
Figure 5. Average number of breaks reported by the Bai and Perron, wavelet-Tsallis q-entropy and atheoretical regression (ART) techniques as a function of break size and length of series (regime). The regime is the exponent y of the length of the signal M, obtained as M = 2 y . Two types of dependence structures are considered, low dependence ( H = 0 . 20 ) and long-range dependence ( H = 0 . 60 ).
Entropy 17 07856 g005
Figure 6. Average number of breaks reported by ART and the technique based on wavelet-Tsallis q-entropy. The top row shows the ART results, while the bottom one displays the ones of wavelet-Tsallis q-entropy.
Entropy 17 07856 g006
Figure 7 presents the average number of breaks reported by ART and the technique based on wavelet-Tsallis q-entropy for fGn signals with two mean breaks. In light dependence (Figure 7a) and high break sizes, the ART technique has no biases. In strong dependence (Figure 7b), however, it overestimates the number of correct breaks within the fGn signal. For the technique based on wavelet-Tsallis q-entropy, on the other hand, the following behavior is observed. In light dependence (Figure 7c), it is almost unbiased in signals that have a power of two lengths and slightly underestimates the number of breaks for the rest of the signals. In strong dependence (Figure 7d), it is slightly biased and displays a lower bias and variance than in the ART counterpart. Based on these results, it is clear that the proposed methodology based on wavelet-Tsallis q-entropy and a standard peak detection and location algorithm outperforms the procedure based on ART and the Bai and Perron technique, as well. The proposed methodology can work in light and strong dependence scenarios and can handle long signals. In the following, the performance of the proposed methodology and that of the ART technique is tested in Gaussian noise scenarios.
Figure 7. Average number of breaks reported by ART and the technique based on wavelet-Tsallis q-entropy and a single peak detection and location algorithm. The top row shows the results of ART, while the bottom row shows the results of the wavelet-Tsallis q-entropy technique.
Entropy 17 07856 g007

5.3. Detection of Single Level-Shifts in the Presence of Gaussian Noise

Figure 8 displays the average number of breaks reported by ART and our proposed methodology in fGn signals with a single break and Gaussian noise. For light dependence, ART has excellent performance with no bias and variance; the technique based on wavelet-Tsallis q-entropy, on the other hand, presents very small bias and variance. For strong dependence ( H = 0 . 8 ), ART displays considerable bias and variance, while the proposed methodology based on wavelet-Tsallis q-entropy displays low bias and variance. Therefore, the ART technique is significantly affected by the amplitude of the break under Gaussian noise.
Figure 8. Average number of breaks reported by ART and the proposed technique based on Tsallis entropies in fGn signals with a single break and Gaussian noise. The top row shows the results of ART, while the bottom row shows the results of the wavelet-Tsallis q-entropy technique.
Entropy 17 07856 g008

5.4. Location of Single Mean Breaks in fGn Signals

In the following, attention is turned to the capabilities of each methodology for locating the exact position of the break date. Table 1 presents the estimation of the break dates using ART and the technique based on wavelet-Tsallis q-entropy in long- and short-length signals with a single level-shift at the midpoint of the signal. The amplitude of the break is set in 0 . 6 σ . Note that similar results are obtained for both techniques; however, the technique based on CART has smaller variation. These results confirm that the technique based on wavelet-Tsallis q-entropy presents efficient detection and location capabilities that are comparable to those of the ART technique.
Table 1. Location of single level-shifts in fGn signals with long-memory behavior. The break is located at the midpoint of the time series, and its amplitude is 0 . 6 σ , where σ is the standard deviation of the fGn signal. Two different lengths are considered: N = 2 12 and N = 2 14 .
Atheoretical regression (ART) resultsTsallis q-entropy results
StatisticsNominal HNominal H
0.60.70.80.90.60.70.80.9
Length N = 2 12
BIAS5.0026.00-67.0028-7.0013630-11
σ91437584447649935871937
MSE 91436585446646940867932
μ20422021211420192054191120172058
Length N = 2 15
BIAS4.00014.002434890.000-114431419
σ43.00479179521410.000165438664075
MSE 43.00477180321860.000164938704075
μ81878177794877028192830577607772

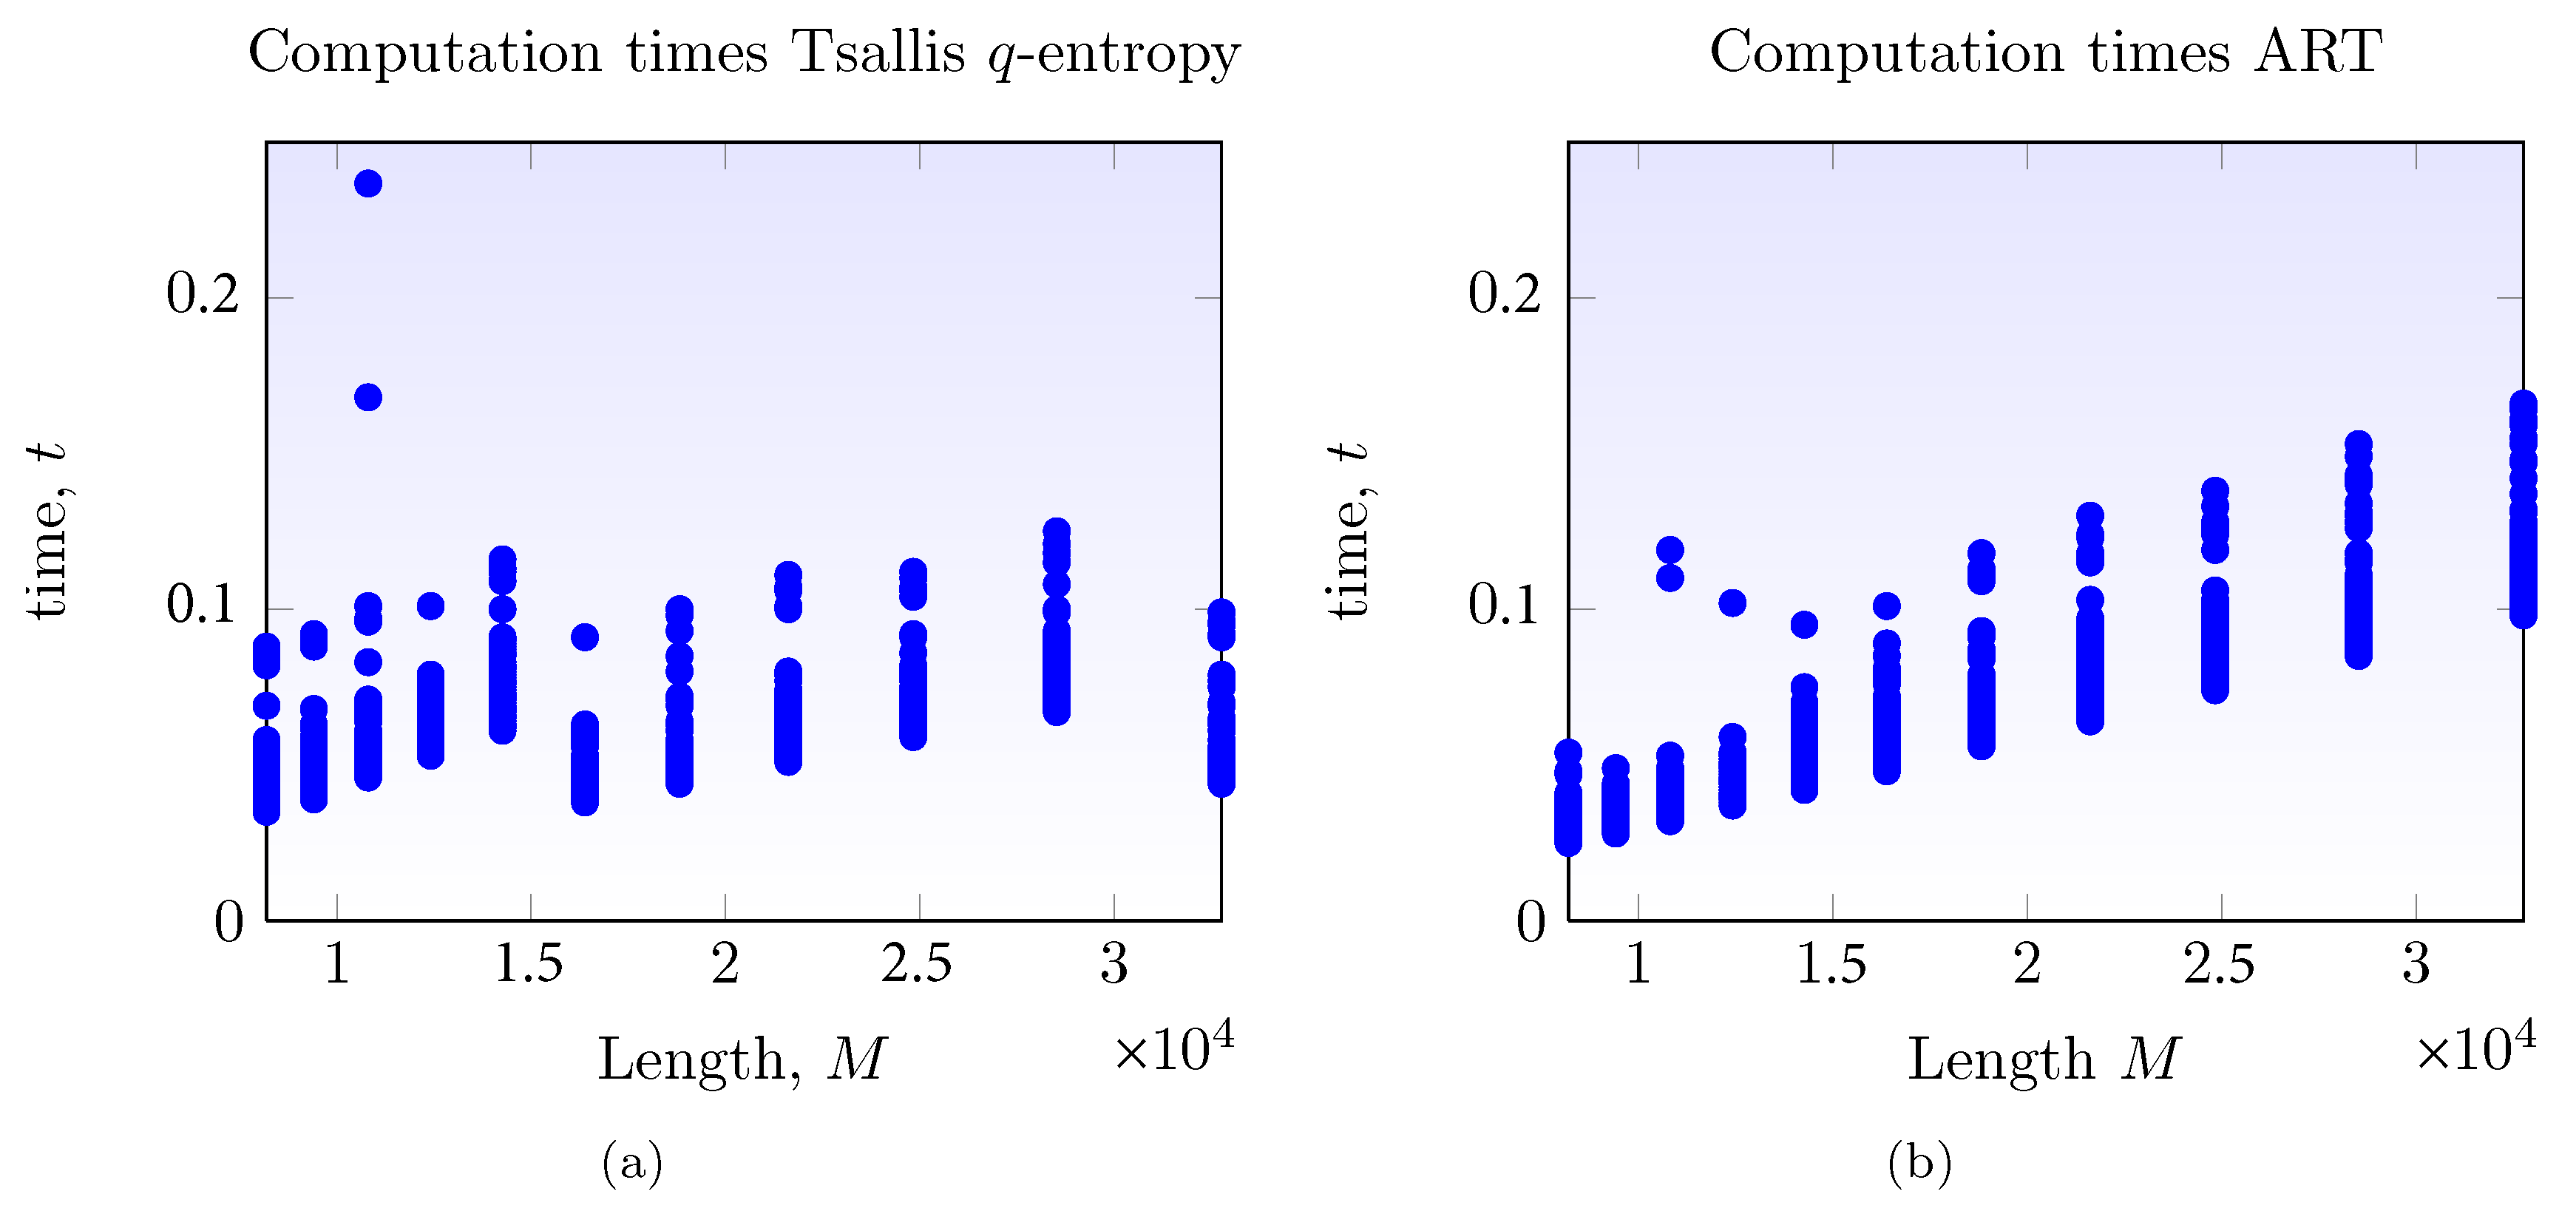
5.5. Computation Times

An important point to consider in a mean level-shift detection and location technique is the time required to obtain an estimate of the number of breaks and the break dates within a signal. The computation times for the Bai and Perron technique are very high, and some examples can be found in [50]. In the following, the computation times for the ART and the proposed technique are presented. The scatterplots of Figure 9 display the computation times of ART and the technique based on wavelet-Tsallis q-entropies when analyzing fGn signals with single level-shifts. The time required to get an estimate is similar for both procedures and takes less than a second, even in signals that have a length of 2 15 points. This similarity in time can be explained by observing the fact that the complexity of the DWT algorithm is O ( n ) and the complexity of the ART algorithm is O ( n ( h ) ) , where n ( h ) is the number of values in node h [50]. Therefore, the proposed algorithm based on wavelet-Tsallis q-entropy is fast and robust and can detect and locate single and multiple mean breaks in light and strong long-memory scenarios.
Figure 9. Computation times for ART and the technique based on wavelet-Tsallis q-entropy as a function of signal length M. The times are given in seconds.
Entropy 17 07856 g009

6. Conclusions

In this article, a novel technique for mean level-shift detection and location within long-memory fGn signals was proposed. The methodology is based on the joint application of wavelet-Tsallis q-entropy and a single peak detection and location algorithm. First, a closed-form expression for the wavelet-Tsallis q-entropy, based on the p-th-order wavelet moment, was obtained, and a detailed study of their properties was performed. The wavelet-Tsallis q-entropy planes for several values of q were obtained, and the effect of the parameter p on the shape and behavior of entropies was studied. It was shown that by considering p, increased flexibility in the analyses is obtained. Finally, a procedure for detecting and locating mean level-shifts in long-memory fGn signals was presented. The methodology, based on wavelet-Tsallis q-entropy and a simple peak detection and location procedure, permits one to detect and locate weak mean level-shifts in fGn signals of parameter H. A comparative study against standard procedures for level-shift detection and location demonstrated that the proposed technique outperforms both the ART and Bai and Perron technique in a diversity of scenarios and is computationally efficient, making it suitable for long signals.

Acknowledgments

The present article was jointly funded by the National Council of Science and Technology (CONACYT) under a grant for project infrastructure and the program for the professorship development (PROMEP) grant. Julio César Ramírez-Pacheco thanks the support from center for research and advanced studies of Instituto Politécnico Nacional (CINVESTAV-IPN) Unidad Guadalajara. Joaquin Cortez-González thanks the financial support of PROFOCIE 2014.

Author Contributions

Julio César Ramírez-Pacheco conceived of the idea. Luis Rizo-Domínguez and Joaquin Cortez-González performed the numerical experiments. All authors discussed the numerical results and wrote the article. All authors have read and approved the final version of the manuscript.

Conflicts of Interest

The authors declare no conflict of interest.

References

  1. Martín-Montoya, L.A.; Aranda-Camacho, N.M.; Quimbary, C.J. Long-range correlations and trends in Colombian seismic time series. Physica A 2015, 421, 124–133. [Google Scholar] [CrossRef]
  2. Molino-Minero-Re, E.; García-Nocetti, F.; Benítes-Pérez, H. Application of a time-scale local Hurst exponent analysis to time series. Digit. Signal Process. 2015, 37, 92–99. [Google Scholar] [CrossRef]
  3. Setty, V.A.; Sharma, A.S. Characterizing Detrended Fluctuation Analysis of Multifractional Brownian Motion. Physica A 2015, 419, 698–706. [Google Scholar] [CrossRef]
  4. Hausdorf, J.M.; Zemany, L.; Peng, C.K.; Goldberger, A. L. Maturation of Gait Dynamics: Stride to stride variability and its temporal organization in children. J. Appl. Physiol. 1999, 86, 1040–1047. [Google Scholar]
  5. Eke, A.; Herman, P.; Kocsis, L.; Kozak, L.R. Fractal characterization of complexity in temporal physiological signals. Physiol. Meas. 2002, 23, R1–R38. [Google Scholar] [CrossRef] [PubMed]
  6. Van Orden, G.C.; Holden, J.G.; Turvey, M.T. Human cognition and 1/f scaling. J. Exp. Psychol. Gen. 2005, 134, 117–123. [Google Scholar] [CrossRef] [PubMed]
  7. Szolgayova, E.; Laaha, G.; Bloschl, G.; Bucher, C. Factors influencing long range dependence in streamflow of European rivers. Hydrol. Process. 2014, 28, 1573–1586. [Google Scholar] [CrossRef]
  8. Beran, J.; Sherman, R.; Taqqu, M.S.; Willinger, W. Long-Range Dependence in Variable-Bit-Rate Video Traffic. IEEE Trans. Commun. 1995, 43, 1566–1579. [Google Scholar] [CrossRef]
  9. Shi, Y. Can we distinguish regime switching from long-memory? A simulation evidence. Appl. Econ. 2015, 22, 318–323. [Google Scholar] [CrossRef]
  10. Eke, A.; Hermán, P.; Bassingthwaighte, J.B.; Raymond, G.; Percival, D.B.; Cannon, M.; Balla, I.; Ikrényi, C. Physiological Time Series: Distinguishing Fractal Noises and Motions. Pflügers Arch. 2000, 439, 403–415. [Google Scholar] [CrossRef] [PubMed]
  11. Deligneres, D.; Torre, K.; Lemoine, L. Methodological issues in the application of monofractal analyses in psychological and behavioral research. Nonlinear Dyn. Psychol. Life Sci. 2005, 9, 451–477. [Google Scholar]
  12. Stoev, S.; Taqqu, M.S.; Park, C.; Marron, J.S. On the Wavelet Spectrum Diagnostic for Hurst Parameter Estimation in the Analysis of Internet Traffic. Comput. Netw. 2005, 48, 423–445. [Google Scholar] [CrossRef]
  13. Abry, P.; Veitch, D. Wavelet Analysis of Long-Range Dependent Traffic. IEEE Trans. Inf. Theory 1998, 44, 2–15. [Google Scholar] [CrossRef]
  14. Stadnitski, T. Measuring Fractality. Front. Physiol. 2012, 3, 127. [Google Scholar] [CrossRef] [PubMed]
  15. Rea, W.; Oxley, L.; Reale, M.; Brown, J. Not all estimators are born equal: The empirical properties of some estimators of long-memory. Math. Comput. Simulat. 2013, 93, 29–42. [Google Scholar] [CrossRef]
  16. Serinaldi, F. Use and misuse of some Hurst parameter estimators applied to stationary and non-stationary financial time series. Physica A 2010, 389, 2770–2781. [Google Scholar] [CrossRef]
  17. Beran, J. Statistics for Long-Memory Processes; Chapman and Hall/CRC Press: Boca Raton, FL, USA, 1994. [Google Scholar]
  18. Malamud, B.D.; Turcotte, D.L. Self-affine time series: Measures of weak and strong persistence. J. Statist. Plann. Inference 1999, 80, 173–196. [Google Scholar] [CrossRef]
  19. Gallant, J.C.; Moore, I.D.; Hutchinson, M.F.; Gessler, P. Estimating the Fractal Dimension of Profiles: A Comparison of Methods. Math. Geol. 1994, 26, 455–481. [Google Scholar] [CrossRef]
  20. Fattahi, M.H.; talebbeydokhti, N.; Rakhshandehroo, G.R.; Shamsai, A.; Nikooee, E. The robust fractal analysis of time series: Concerning signal class and length. Fractals 2011, 19, 29–49. [Google Scholar] [CrossRef]
  21. Ramirez-Pacheco, J.; Torres-Román, D.; Toral-Cruz, H. Distinguishing Stationary/Nonstationary Scaling Processes Using Wavelet Tsallis q-Entropies. Math. Probl. Eng. 2012, 2012, 1–18. [Google Scholar] [CrossRef]
  22. Holden, J.G.; Riley, M.A.; Gao, J.; Torre, K. Fractal Analyses: Statistical and methodological innovations and best practices. Front. Physiol. 2013, 4, 97. [Google Scholar] [CrossRef] [PubMed]
  23. Mandelbrot, B.; van Ness, J.W. Fractional Brownian motions, fractional noises and applications. SIAM Rev. 1968, 10, 422–437. [Google Scholar] [CrossRef]
  24. Samorodnitsky, G.; Taqqu, M. Stable Non-Gaussian Random Processes: Stochastic Models with Infinite Variance; Chapman and Hall/CRC Press: Boca Raton, FL, USA, 1994. [Google Scholar]
  25. Percival, D.B. Stochastic Models and Statistical Analysis for Clock Noise. Metrologia 2003, 40, S289–S304. [Google Scholar] [CrossRef]
  26. Hudgins, L.; Friehe, C.A.; Mayer, M.E. Wavelet Transforms and Atmospheric Turbulence. Phys. Rev. Lett. 1993, 71, 3279–3283. [Google Scholar] [CrossRef] [PubMed]
  27. Cohen, A.; Kovacevic, J. Wavelets: The Mathematical Background. Proc. IEEE 1996, 84, 514–522. [Google Scholar] [CrossRef]
  28. Veitch, D.; Abry, P. A Wavelet Based Joint Estimator of the Parameters of Long-Range Dependence. IEEE Trans. Inf. Theory 1999, 45, 878–897. [Google Scholar] [CrossRef]
  29. Soltani, S.; Simard, P.; Boichu, D. Estimation of the self-similarity parameter using the wavelet transform. Signal Process. 2004, 84, 117–123. [Google Scholar] [CrossRef]
  30. Shen, H.; Zhu, Z.; Lee, T.C.M. Robust estimation of the self-similarity parameter in network traffic using the wavelet transform. Signal Process. 2007, 87, 2111–2124. [Google Scholar] [CrossRef]
  31. Flandrin, P. Wavelet Analysis and Synthesis of Fractional Brownian Motion. IEEE Trans. Inf. Theory 1992, 38, 910–917. [Google Scholar] [CrossRef]
  32. Bardet, J.M. Statistical Study of the Wavelet Analysis of Fractional Brownian Motion. IEEE Trans. Inf. Theory 2002, 48, 991–999. [Google Scholar] [CrossRef]
  33. Pesquet-Popescu, B. Statistical Properties of the Wavelet Decomposition of certain Non-Gaussian Self-Similar Processes. Signal Process. 1999, 75, 303–322. [Google Scholar] [CrossRef]
  34. Bryce, R.M.; Sprague, K.B. Revisiting Detrended Fluctuation Analysis. Sci. Rep. 2012, 2, 1–6. [Google Scholar] [CrossRef] [PubMed]
  35. Deligneres, D.; Ramdani, S.; Lemoine, L.; Torre, K.; Fortes, M.; Ninot, G. Fractal Analyses of short time series: A re-assessment of classical methods. J. of Math. Psychol. 2006, 50, 525–544. [Google Scholar] [CrossRef]
  36. Esposti, F.; Ferrario, M.; Signorini, M.G. A Blind Method for the estimation of the Hurst exponent in time series: Theory and Methods. Chaos 2008, 18, 033126. [Google Scholar] [CrossRef] [PubMed]
  37. Schaefer, A.; Brach, J.; Perera, S.; Sejdic, E. A comparative analysis of spectral exponent estimation techniques for 1/fβ processes with applications to the analysis of stride interval time series. J. Neurosci. Methods 2014, 222, 118–130. [Google Scholar] [CrossRef] [PubMed]
  38. Bonachela, J.; Hinrichsen, H.; Muñoz, M.A. Entropy estimates of small data sets. J. Phys. A Math. Gen. 2008, 41, 202001. [Google Scholar] [CrossRef]
  39. Kumar, U.; Kumar, V.; Kapur, J.N. Normalized measures of entropy. Int. J. Gen. Syst. 1986, 12, 55–69. [Google Scholar] [CrossRef]
  40. Martin, M.T.; Plastino, A.R.; Plastino, A. Tsallis-like information measures and the analysis of complex signals. Physica A 2000, 275, 262–271. [Google Scholar] [CrossRef]
  41. Zunino, L.; Perez, D.G.; Garavaglia, M.; Rosso, O.A. Wavelet Entropy of Stochastic Processes. Physica A 2007, 379, 503–512. [Google Scholar] [CrossRef]
  42. Quiroga, R.Q.; Rosso, O.A.; Basar, E.; Schumann, M. Wavelet entropy in event-related potentials: A new method shows ordering of EEG oscillations. Biol. Cybern. 2001, 84, 291–299. [Google Scholar] [CrossRef] [PubMed]
  43. Ren, W.X.; Sun, Z.S. Structural damage identification by using wavelet entropy. Eng. Struct. 2008, 30, 2840–2849. [Google Scholar] [CrossRef]
  44. Perez, D.G.; Zunino, L.; Martin, M.T.; Garavaglia, M.; Plastino, A.; Rosso, O.A. Model-free stochastic processes studied with q-wavelet-based information tools. Phys. Lett. A 2007, 364, 259–266. [Google Scholar] [CrossRef]
  45. Zunino, L.; Pérez, D.G.; Martin, M.T.; Plastino, A.; Garavaglia, M.; Rosso, O.A. Characterization of Gaussian Self-similar stochastic processes using wavelet-based information tools. Phys. Rev. E 2007, 75, 021115. [Google Scholar] [CrossRef] [PubMed]
  46. Rosso, O.A.; Zunino, L.; Pérez, D.G. Extracting features of Gaussian self-similar stochastic processes using wavelet-based information tools. Phys. Rev. E 2007, 76, 061114. [Google Scholar] [CrossRef] [PubMed]
  47. Ramirez-Pacheco, J.; Torres-Roman, D. Cosh window behavior of wavelet Tsallis q-entropies in 1/fα signals. Electron. Lett. 2011, 47, 186–187. [Google Scholar] [CrossRef]
  48. Bauwens, L.; Koop, G.; Korobilis, D.; Rombouts, J.V.K. The contribution of structural break models to forecasting Macroeconomic series. J. Appl. Econom. 2014, 30, 596–620. [Google Scholar] [CrossRef]
  49. Rea, W.; Reale, M.; Capelli, C.; Brown, J.A. Identification of changes in mean with regression trees: An application to market research. Economet. Rev. 2010, 29, 754–777. [Google Scholar] [CrossRef]
  50. Rea, W.; Reale, M.; Brown, J.; Oxley, L. Long-memory or shifting means in geophysical time series? Math. Comput. Simulat. 2011, 81, 1441–1453. [Google Scholar] [CrossRef]
  51. Capelli, C.; Penny, R.N.; Rea, W.S.; Reale, M. Detecting multiple mean breaks at unknown points with Atheoretical Regression Trees. Math. Comput. Simulat. 2008, 78, 351–356. [Google Scholar] [CrossRef]
  52. Yang, C.; He, Z.; Hu, W. Comparison of public peak detection algorithms for MALDI mass spectometry data analysis. BMC Bioinform. 2009, 10, 4. [Google Scholar] [CrossRef] [PubMed]
  53. Bai, J.; Perron, P. Computation and analysis of multiple structural breaks models. J. Appl. Econom. 2003, 18, 1–22. [Google Scholar] [CrossRef]

