Article

Multi-Scale Entropy Analysis of Body Sway for Investigating Balance Ability During Exergame Play Under Different Parameter Settings

1
Department of Industrial Management, National Taiwan University of Science and Technology, No. 43, Sec. 4, Keelung Road, Da’an District, Taipei 106, Taiwan
2
Department of Industrial Engineering and Management, Yuan Ze University, 135 Yuan Tung Road, Chungli District, Taoyuan 320, Taiwan
*
Author to whom correspondence should be addressed.
Entropy 2015, 17(11), 7608-7627; https://doi.org/10.3390/e17117608
Submission received: 7 September 2015 / Revised: 22 October 2015 / Accepted: 26 October 2015 / Published: 4 November 2015
(This article belongs to the Special Issue Multiscale Entropy and Its Applications in Medicine and Biology)

Abstract

:
The goal of this study was to investigate the parameters affecting exergame performance using multi-scale entropy analysis, with the aim of informing the design of exergames for personalized balance training. Test subjects’ center of pressure (COP) displacement data were recorded during exergame play to examine their balance ability at varying difficulty levels of a balance-based exergame; the results of a multi-scale entropy-based analysis were then compared to traditional COP indicators. For games involving static posture frames, variation in posture frame travel time was found to significantly affect the complexity of both the anterior-posterior (MSE-AP) and medio-lateral (MSE-ML) components of balancing movements. However, in games involving dynamic posture frames, only MSE-AP was found to be sensitive to the variation of parameters, namely foot-lifting speed. Findings were comparable to the COP data published by Sun et al., indicating that the use of complexity data is a feasible means of distinguishing between different parameter sets and of understanding how human design considerations must be taken into account in exergame development. Not only can this method be used as another assessment index in the future, it can also be used in the optimization of parameters within the virtual environments of exergames.

1. Introduction

Balance is a basic human motor skill and is one of the most important functions involved in maintaining normal body posture and ensuring normal body movements. Balance is an important factor in the performance of both day-to-day activities and athletic skills, and people can typically improve their balance by means of regular exercises [1]. The importance of balance to human beings can be demonstrated from two different perspectives, those of health and sports. From a health perspective, accidental falls, diseases associated with aging, and other problems can all affect balance. In the worst case, falling due to loss of balance can result in accidental death. Age-related diseases and other problems can cause deterioration in the sense of balance, limiting the mobility of the elderly; this narrows the space of possible activities in which they can partake, resulting in decreased involvement in social interactions and causing many other problems beyond physical disability [2]. From an athletic perspective, athletes wishing to enhance their athletic performance must first consider establishing balance and stability in their movements before they can achieve their full potential [3,4,5].
Many of the physiological signals collected empirically are non-linear, such as heartbeats [6,7], brain waves [8], and the balancing state of the body [9,10]. The goal of non-linear analysis is to present non-linear data quantitatively. Complexity denotes a state of affairs that one can easily appreciate when confronted with it [11]. Piasecki [12] discussed the multi-scale complexity of binary and grey level pattern characteristics. Such an entropic descriptor can be also employed to reconstruct microstructure details [13]. Complex systems are neither absolutely regular nor absolutely random [14,15]. Thus, multi-scale entropy (MSE) [6,16], a recent method of measuring the complexity of finite length time series, has been proposed. Entropy describes a measure of statistical or dynamical disorder, whereas complexity rather refers to the structural organization arising in the system. Both terms are obviously closely related, but can provide complementary information [11]. This computational tool groups data points according to multiple different timescales to reveal repeated patterns, enabling the theoretical quantification of the complexity of the data using a variety of measures of entropy. MSE can be applied both to physical and physiological data sets; for example, this can be used to measure the complexity of physiological signals during the process of inhibitory control [
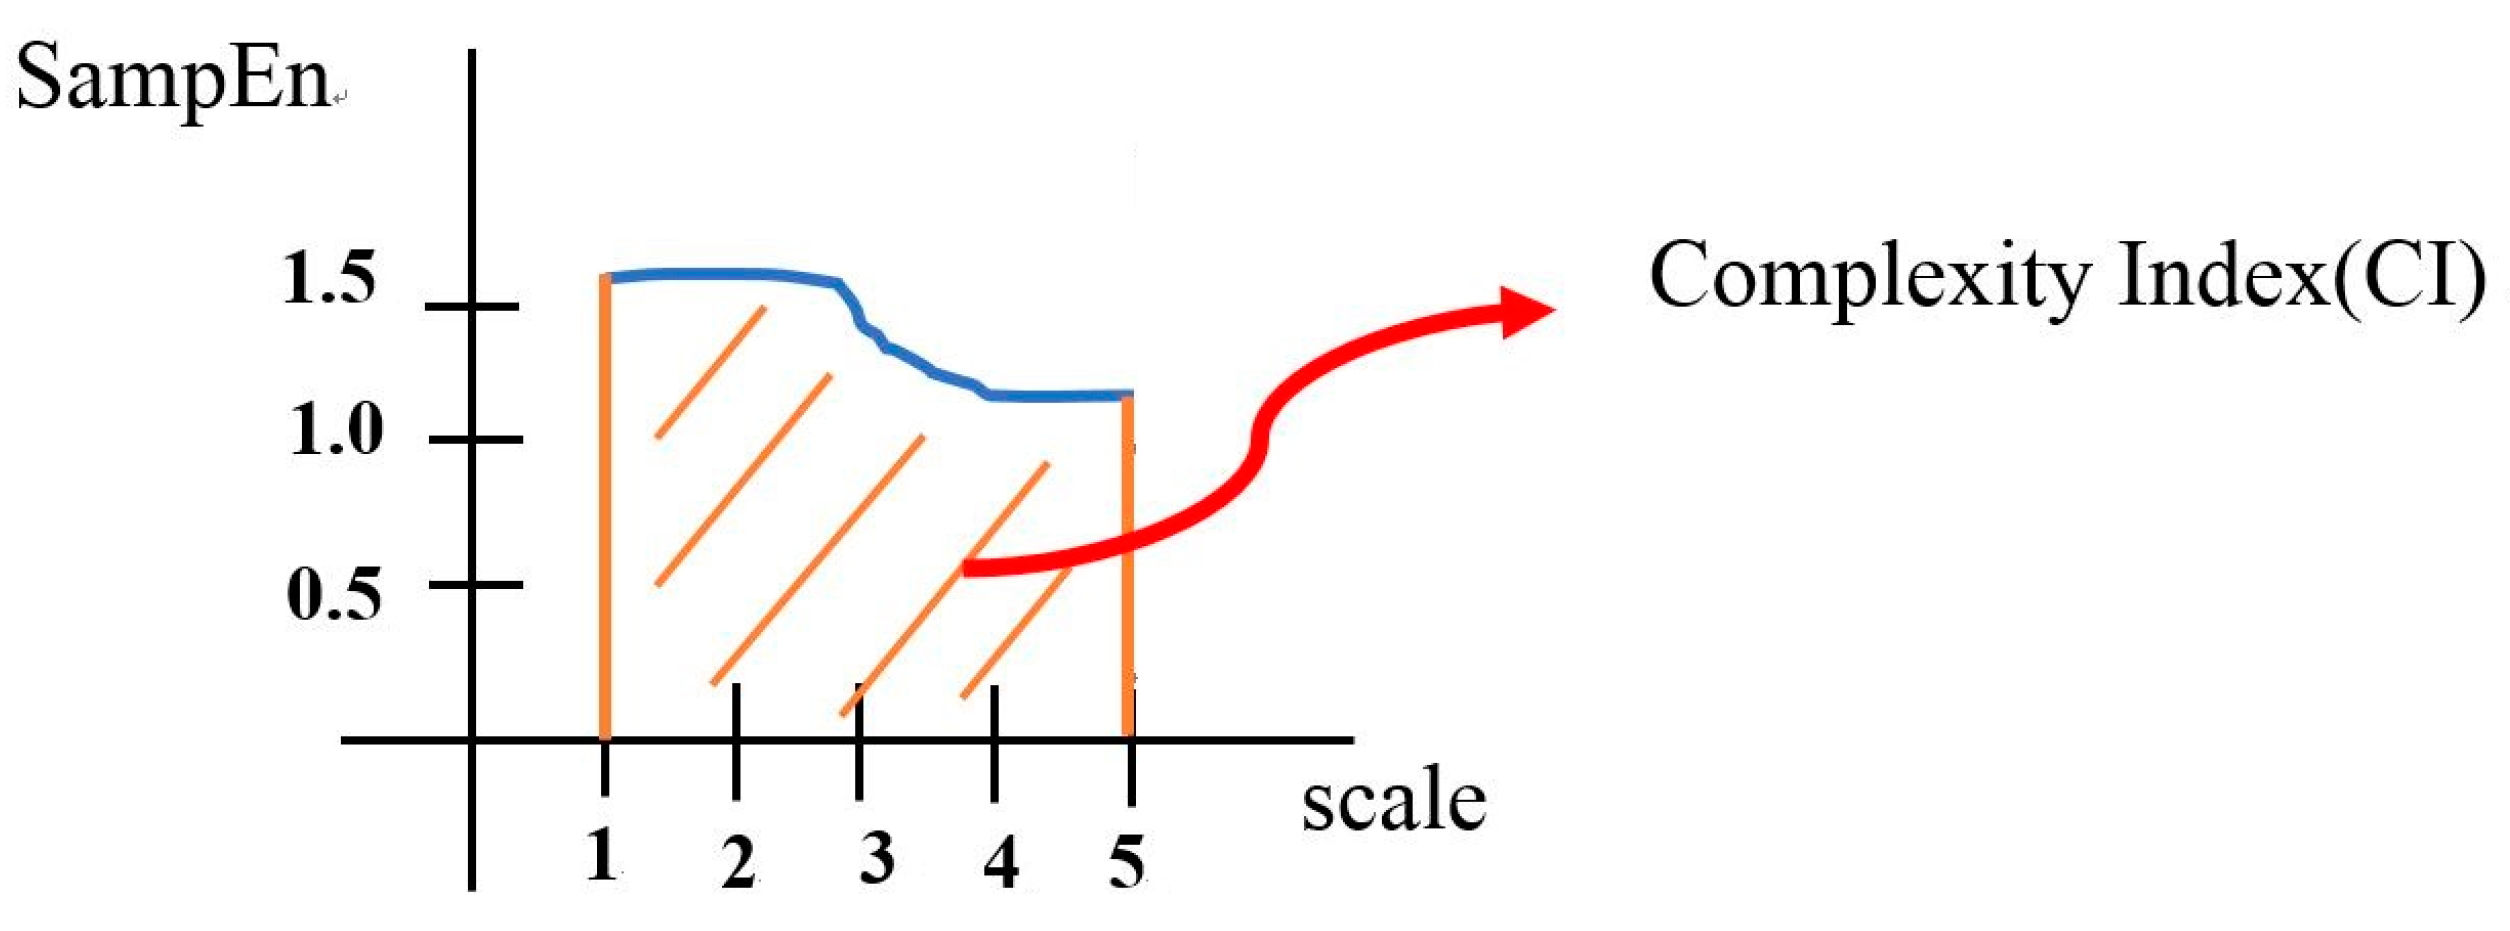
17]. Higher MSE values signify that the signal is less predictable and information-rich, whereas lower MSE values imply that the time series is more regular and less complex [6,16,18]. In recent years, MSE analysis has become increasingly adopted to quantify the complexity of physiological signals. Many previous studies discuss the complexity differences between groups to demonstrate changes in balance ability [19,20,21], while others explore the changes in complexity under different situations within a single group to elucidate the effect of different factors on balance ability [2,10]. Costa et al. [22] used MSE curves to show that diseased hearts have a significant decrease in sample entropy on multiple time scales, indicating a lower degree of complexity. Additionally, Cai et al. [23] used MSE to investigate the complexity of heart rate range. Such studies have demonstrated that MSE reveals valuable hidden information by measuring signal characteristics at various scales [16].
It is a relatively new to use a method for analyzing complexity in physics to elucidate hidden information in physiological data. Entropy is a concept of complexity. Multiple entropy measures, such as approximate entropy, sample entropy and multi-scale entropy, can be used to investigate non-linear data. After a gradual evolution, MSE is now being used in clinical trials and human factor research to quantitatively analyze physiological data [6,16,22,24]. Gruber et al. [21] compared the time-to-contact (TtC), multi-scale entropy, and traditional center of presure (COP) indicator methods to analyze COP displacement data when standing still in order to rank disease severity amongst Adolescent Idiopathic Scoliosis patients and healthy controls. Compared to traditional measurements and time-to-contact (TtC), multi-scale entropy uses methods in dynamics to interpret changes in displacement data. Therefore, the multi-scale entropy method provides a better understanding of the hidden information. Busa et al. [20] indicated that compared to the COM or COP methods, multi-scale entropy, similar to sample entropy, enabled a deeper understanding of spacial and time-related parameter induced physiological changes in subjects in relation to sequences of times and posture control in an active sequence. Duarte et al. [25] believed that multi-scale entropy could be used to analyse the complexity of posture control during long-term standing as well as in the adapation of subjects to systemetic changes, whereas the Detrended Fluctuation Analysis (DFA) indicator cannot be used to reflect adaption.
Currently, balance training is available as part of various exercise classes and in fitness and sports training. However, these options are not appealing to all demographics; hence the demand for alternative forms of balance training, such as can be provided through exergames. To this end, Sun et al. [19] investigated how the parameters of a Kinect-based exergame can influence the balance control ability and intensity level tolerated by the player, by analyzing both objective metrics and gameplay-based player experience. Sun 
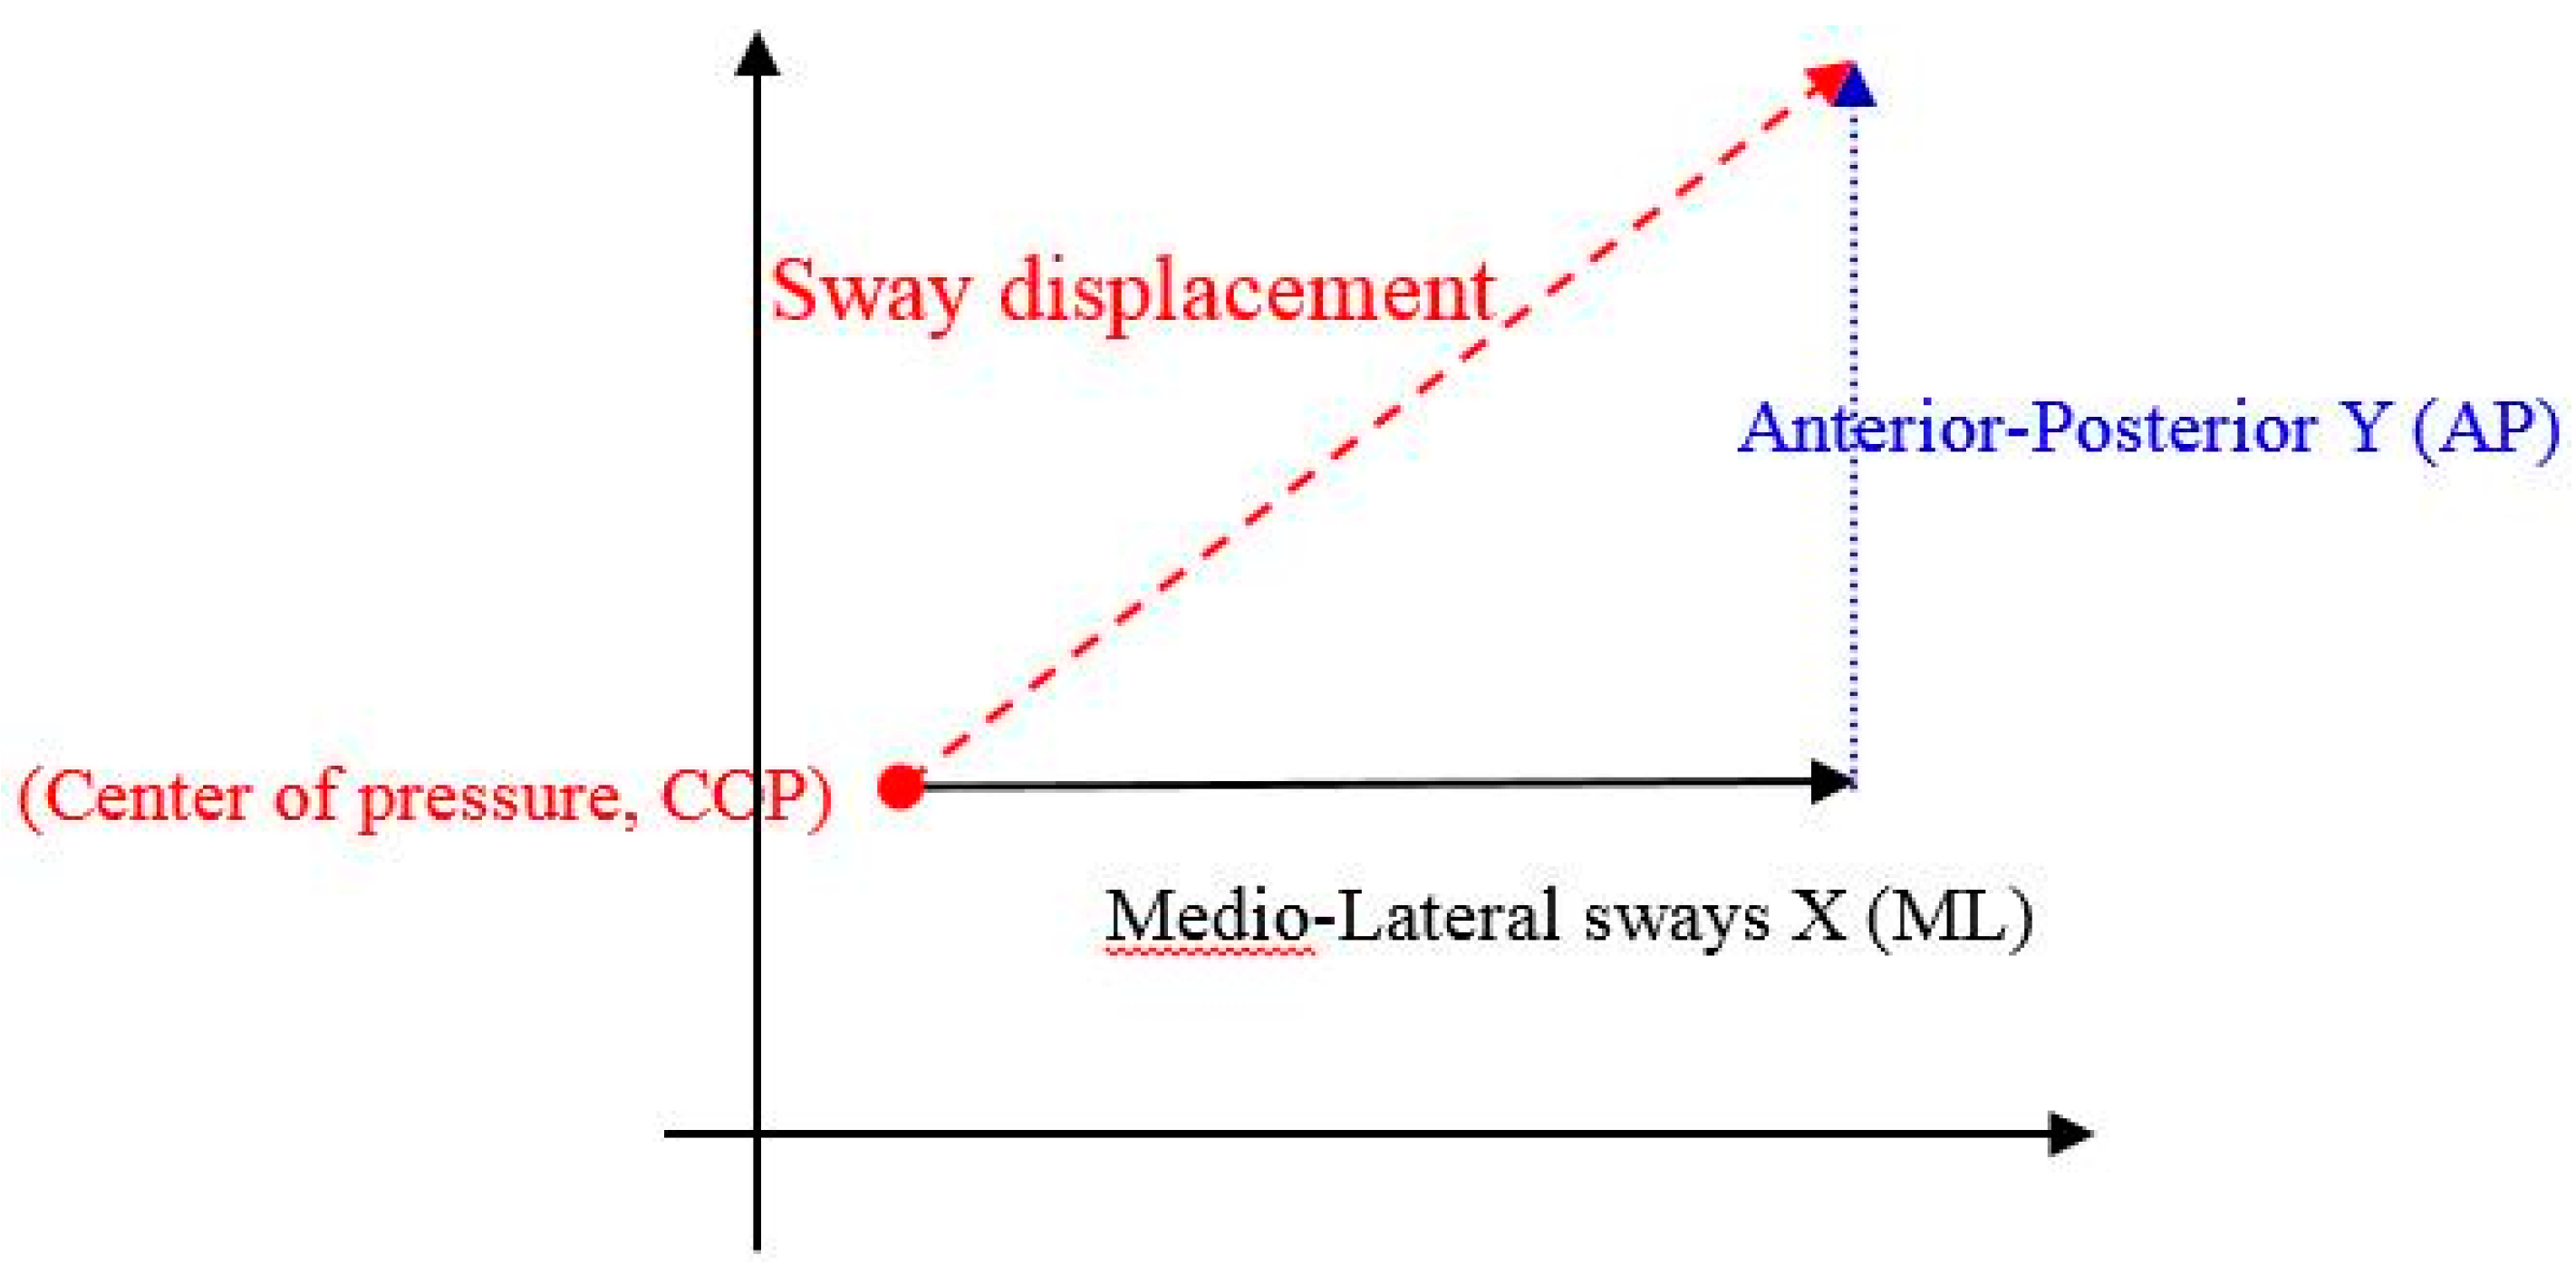
et al., used traditional balance indicators to analyze postural stability, including Mean Distance-Anterior Posterior (MDISTAP), Mean Distance-Medial Lateral (MDISTML), Sway Area (AREA_SW), and Total Excursions (TOTEX). Please see the Appendix for more details.
Traditional single-scale methods of analyzing time series ignore sequential properties that emerge across multiple time scales; as a result, they tend to confound low-complexity signals with signals whose order emerges across multiple different time series [26]. Costa et al. [27] mention that, in the study of positional complexity, such hidden information can more effectively highlight the differences between two groups, in order to assess the risk and to predict the effectiveness of medical treatment. Busa et al. [20] also mention that, instead of using discrete data such as COP range, standard deviation, or path length to calculate statistical parameters, it is more important to define the mechanism of position control complexity. This investigation of the utility of multi-scale entropy complexity is motivated by these observations.
In our previous study analyzing traditional balance indicators, the parameters of a Kinect-based exergame were combined with balance training exercises, which influenced the balance control ability and intensity level that players could tolerate [28]. The goal of the present study is to flexibly modify the exergame so that it can be tailored to the needs of various individuals using the same set of parameters. The exergame consists of virtual reality combined with the Kinect-based interactive equipment and collects movement data objectively using a force plate. The adaptability of the exergame will then be analyzed and explored using complexity analysis, in order to optimize the parameters of video game-based fitness training routines, and to inform future developments in personalized training. Thus, this study will achieve the following goals:
(1)
Collect COP data using a force plate and assess the complexity of the displacement variable with multi-scale entropy analysis to determine the parameters affecting leg movement during a Kinect-based exergame.
(2)
Characterize the responsiveness of the complexity index to the manipulation of various exergame parameters; for example, investigate how complexity varies under parameters corresponding to increasing levels of difficulty.
(3)
Compare the results of traditional indicator analysis [28] to those of multi-scale entropy analysis, to determine the viability of multi-scale entropy analysis as a tool for human-centered design, or as another assessment in the future.

2. Methods

Our study combined Xbox Kinect technology and virtual reality to optimize the parameters of an exergame intended to boost physical performance. With respect to physical performance, in light of the results of studies based on traditional indicator analysis [28] and multi-scale entropy, our hope was to find the optimal parameter settings using multi-scale entropy analysis to analyze physical performance and to use this information to guide the design of the game. To successfully train the user, an exergame presents a particular set of body movements as a game. However, both the choice of parameter values in the game, as well as the performance of the activity, affect the quality of the activity, and in turn affect the results of the training. In light of this, the evaluation of the performance of the movements is of particular importance.

2.1. Test Subjects

Twenty-three healthy individuals, 12 male and 11 female, between 21 and 30 years of age, participated in this study, with height ranging from 150 to 180 cm and weight ranging from 48 to 80 kg. All participants were required to obtain a full score on the Berg Balance Scale test to reduce their risk of falling, and were screened to ensure that they had no medical history of central nervous system impairments or relevant skeletal and muscular diseases; this made it possible to maintain a certain standard for evaluating the intensity level of exercises. All experimental subjects signed consent forms prior to the experiments.

2.2. Apparatus

The hardware used in this study included one Microsoft Xbox360 Kinect with an embedded motion capture system; a 55″ LCD TV; a computer to install the Kinect-related software, including Unity3D, OpenNI, Prime Sense, and NITE; and a computer with AMTINetForce installed to drive the force plate and to collect center of pressure (COP) data. CP data were used to evaluate the intensity level of exercise in terms of the subjects’ balance control skills. Based on the study by Perito et al. [29], a sample rate of 100 Hz was chosen.

2.3. Experimental Protocol

This work uses a Kinect-based balance training exergame, based on a posture frame that makes the subject stand on one leg, as illustrated in Figure 1. The posture frame initially appears and gradually approaches the avatar in the virtual scene. The subject then needs to assume a one-legged stance to make the avatar pass through the posture frame without colliding with it.
Figure 1. Diagram of the posture frame.
Entropy 17 07608 g001
The design of the game parameters is described in detail below; the 1st and 2rd are for the static design, and the 3rd and 4th are for the dynamic design.
(1)
Offset of the posture frame: This denotes the distance between the posture frame boundary and the avatar, which might have a negative effect on the stability of the subject’s balance control due to a sense of tension induced by the posture frame, as shown in Figure 2. In this study, the offset of the posture frame is designed with two levels, a larger frame of 10 units (a), and a smaller frame of 5 units (b).
(2)
Travel time of the posture frame: This parameter denotes the amount of time during which the posture frame (PF) approaches the avatar once it appears. This is designed to examine the impact of the subject’s reaction to the appearance of the posture frame on the subject’s movements, as shown in Figure 3. Two values are used in this study, 1 and 2 seconds, respectively.
(3)
Leg-raising angle: The leg-raising angle is determined by the height of an obstacle when the individual steps over it, as depicted in Figure 4. This study has two values for the leg raising angle, 45 and 90 degrees, respectively. This parameter denotes the amount of time during which the posture frame (PF) approaches the avatar once it appears, the subject’ have one or two seconds to go from a two legged stance to either 45 degree or 90 degree leg lift.
(4)
Leg-raising rate: This parameter specifies the length of the time interval during which the subject must go from standing on two legs to one leg. When the raising time is short, the subject needs to reach the required one legged posture quickly due to the relatively high leg-raising rate, whereas when the raising time is longer, the subject must raise their leg more slowly and maintain their balance prior to passing through the PF.
Figure 2. Diagram of the frame width (a) posture frame with larger width; (b) posture frame with smaller width.
Entropy 17 07608 g002
Figure 3. Diagram of the design of posture frame travel time to the avatar.
Entropy 17 07608 g003
Figure 4. Diagram of the design of leg-rising angle (a) a raising angle of 45 degrees; (b) a raising angle of 90 degrees.
Entropy 17 07608 g004
The experimental environment was divided into static and dynamic posture frames, respectively. Both of the frames had two game parameters, each of which had two different levels, resulting in four different challenge levels for each PF scenario. Each test subject attempted each level three times in a row for 10 min. The researcher first chose the PF from either a static or a dynamic frame, in a random manner. The selected PF then appeared 12 times, each of which was associated with a certain challenge level randomly selected from the four aforementioned challenge levels, resulting in each challenge level being played three times. Each experimental subject had to play the game 24 times (three times for each of the four challenge levels for two PFs) in order to finish the experiment. All the design values for both PFs were interspersed and randomly assigned within the aforementioned 24 challenges, in order to avoid the learning effect.
The exergame is played via Kinect and requires the subject to maintain their balance while standing on one leg. The experimental design is based on analysis from the viewpoint of a within-subjects design and comparative analysis between different parameter settings of static and dynamic PFs.

2.4. Center of Pressure (COP)

Traditional approaches rely on COP measurements to assess balance performance [19,20,21,25,27,30,31]. The COP represents a weighted average of all the pressures over the surface of the area in contact with the ground [31]. For example, the diminished muscular strength of elderly people results in a higher COP displacement, which is interpreted as more body sway. Body sway can be quantified in terms of the components of COP path displacement, measured while the subject stands upright and keeps his or her balance; these are medio-lateral (ML, X) and anterior-posterior (AP, Y), as shown in Figure 5. This study aims to investigate the relevance of multi-scale entropy analysis to the parameters of a balance training exergame, and to use the resulting complexity data to inform the design of a training program that can be easily adapted to users of different skill levels.
Figure 5. Schematic of COP displacement path.
Entropy 17 07608 g005
Forces and moments along the x, y, and z axes, namely, Fx, Fy, Fz, Mx, My, and Mz, were collected by the force plate. These data were preprocessed, and manipulated in Matlab to calculate body sway trajectories based on Equations (1) and (2), which resolved the COP trajectory into Py (equivalent to AP) and Px (equivalent to ML) rectangular components. Finally, the data were analyzed to assess the balance control ability of the experimental subject. In the equation below, P represents the coordinate of the x, y, and z axis, F represents the force, and M represents the moment:
P x = ( P z * F x M y ) / F z
P y = ( P z * F y + M x ) / F z
Based on the study by Perito et al. [29], a sample rate of 100 Hz with a 30-s sample time interval results in 3000 data points. Because there was some discrepancy in the exact location at which each test subject stood on the force plate, each collected data point needed to be calibrated prior to being manipulated and analyzed in terms of the four aforementioned COP metrics. As formulated in Equations (3) and (4), the mean displacements along the anterior-posterior and mediolateral directions were calculated, in which AP0[n] and ML0[n] represented the raw COP data along the AP and ML directions at time point n, respectively:
A P ¯ = 1 N n = 1 N A P O [ n ]
M L ¯ = 1 N n = 1 N M L O [ n ]
Zero-point correction was then performed by subtracting the raw COP data with the mean value that was obtained previously, as formulated in Equations (5) and (6), where N denotes the total number of data points:
A P [ n ] = A P O [ n ] A P ¯                      n = 1 , , N .
M L [ n ] = M L O [ n ] M L ¯                      n = 1 , , N .

2.5. Multi-Scale Entropy

Multi-scale Entropy (MSE) is a mathematical method used to analyze the complexity of information within a time series; by using the entropy of different time-spatial scales of a computer system, it provides a quantified standard for assessing signal complexity. MSE can be used to quantify complexity in widely varying timescales; it is also worthwhile to explicitly compare the results of MSE used for time series analysis to classical characterizations of scaling and self-similarity. Signals with a higher level of complexity have greater self-similarity. For example, the complexity of the ML and AP components of COP data is lower for healthy elderly people than it is for young people. This is because the control of balance is weaker in elderly people and their body functions are in a process of gradual decline; compared to young people, their physiological functions are slower to react, therefore their complexity is lower. In the context of biomedicine, greater physiological complexity indicates greater adaptability to the external environment; the reverse also holds true. This method is commonly used in the study of physiological signals and pathology [19,20,21].
Costa et al. [16] proposed that the MSE method is based on three premises: (1) the complexity of a biological system reflects its ability to adapt and function in an ever-changing environment; (2) biological systems need to operate across multiple spatial and temporal scales, and hence, their complexity is also multi-scaled; and (3) a wide range of diseases, as well as aging—Both of which reduce the adaptive capacity of the individual—Appear to degrade the information carried by output variables. Currently, clinical investigations and ergonomics-related research regularly apply MSE to perform quantitative analysis on recorded physiological signals [16,19,20,21,22,24,25,32].
The calculation of MSE is based on SampEn; SampEn is a single-scale analysis and multi-scale entropy involves analysis using multiple scales. Before calculating SampEn, we must define the following parameters:
(a)
Data length (N): the number of data points in the time series data. For the MSE method, the suggested minimum number of data points for the shortest coarse-grained time series is 1000 [16]. Too few data points can result in large errors in the calculation of the regularity of the data, and too many data points result in longer calculation times.
(b)
Embedding dimension (m): in the time series, the embedding dimension is used to understand the repeatability and regularity of the data. The higher the repeatability of the data, the greater its regularity and the lower its complexity. It is typically recommended to set the value of m to 2 or 3 [33]. If m is too large, the comparison of data would become more difficult and lengthen the calculation time.
(c)
Tolerance (r): a value representing the comparability among groups. If the difference between groups is less than r * SD, it is defined as consistent; if the difference is greater than r * SD, it is defined as inconsistent. SD is the standard deviation of the original data. Pincus [34] recommends setting r between 0.1 and 0.2.
Having defined the parameters above, we can proceed to the calculation of multi-scale entropy. The procedure is as follows:
(1)
Transform the original signal to a time series in one-dimensional space { x { i } } . For example, raw COP data represents displacement in two-dimensional space; through transformation it can be separated into separate time series for the X and Y components.
(2)
Then, with { y ( τ ) } we can construct the time series for each scale factor τ. The scale factor reflects the degree to which the signal is segmented to obtain an average. J represents the number of data points in the transformed data, τ is the scale of segmentation and N is the size of the original dataset. Costa [16] recommends that N/τ (the size of the transformed dataset) should be at least 1000:
y j ( t ) = 1 τ i = ( j 1 ) τ + 1 j τ x i ,     1 j N τ
For example:
Scale 1. { y ( 1 ) } The original untransformed time series, which can be used for simple sample entropy calculations.
y 1 = x 1 ,     y 2 = x 2 ,     y 3 = x 3 ,     y 4 = x 4 ,   y 5 = x 5 , y i = x i ,   y i + 1 = x i + 1 ,    
Scale 2. { y ( 2 ) }
y 1 = x 1 + x 2 2   ,     y 2 = x 3 + x 4 2   ,     y 3 = x 5 + x 6 2   ,     ,     y j = x i + x i + 1 2   ,  
Scale 3. { y ( 3 ) }
y 1 = x 1 + x 2 + x 3 3   ,     y 2 = x 4 + x 5 + x 6 3   ,   ,     y j = x i + x i + 1 + x i + 2 3   ,
(3)
We then use the formula for SampEn, which, being a measure of regularity, is the negative of the logarithmic conditional probability that two sequences of m consecutive data points are similar to each other (within given tolerance r) will remain similarity at the next point (m + 1) in the data set, and take the logarithm (ln) of the resulting fraction, giving the sample entropy for different scales, or multi-scale entropy.
(a)
Take the vector with length m:
u m ( j ) = { y j ,   y j + 1 ,   ,   y j + m 1   } ,     1 j N τ m
(b)
Calculate the distance:
d [ u m ( j ) ,   u m ( k ) ] = m a x { | y ( j + 1 ) y ( k + 1 ) | : 0 l m 1 }  
d [ u m + 1 ( j ) ,   u m + 1 ( k ) ] = m a x { | y ( j + 1 ) y ( k + 1 ) | : 0 l m }
with  1 j N τ m   ,   1 k N τ m
(c)
Let n j m ( r ) represent the number of vectors u m [ k , k j ] that are close to the vector u m ( j ) (i.e., the number of vectors that satisfy { d [ u m ( j ) ,   u m ( k ) ] r } , The tolerance level r is set at a certain percentage of the SD of the time series:
n j m = { d [ u m ( j ) ,   u m ( k ) ] r }
n j m + 1 = { d [ u m + 1 ( j ) ,   u m + 1 ( k ) ] r }
Finally:
S E ( m ,   r ,   N τ ) = l n j = 1 N τ n j m j = 1 N τ m n j m + 1
(4)
Finally, we can plot SampEn as a function of scale factor to calculate the area under the complexity Index (CI), as shown in Figure 6.
Figure 6. Schematic illustration of the definition of the complexity index.
Entropy 17 07608 g006
Costa et al. [16] used the MSE method for defining a complexity measurement focused on quantifying the information expressed by the physiologic dynamics over multiple scales. Having obtained the complexity, more analyses can be conducted by observing the complexity curve (i.e., rising or descending), or by applying the Complexity Index (CI) proposed by Costa et al. [27], which can be calculated from Equation (7):
CI = i = 1 n SampEn ( i ) i   =  scale factor ;   n   =  total scale
It is sometimes difficult to compare the height of multiple curves or to tell whether there is a significant difference among them when the curves cross each other. In such cases, the aforementioned CI can be used, which is based on evaluating the area under a given complexity curve. Figure 6 demonstrates the Complexity Index, which is given by the total area under the complexity curve and calculated by summing up the SampEn for each scale.

3. Results and Discussion

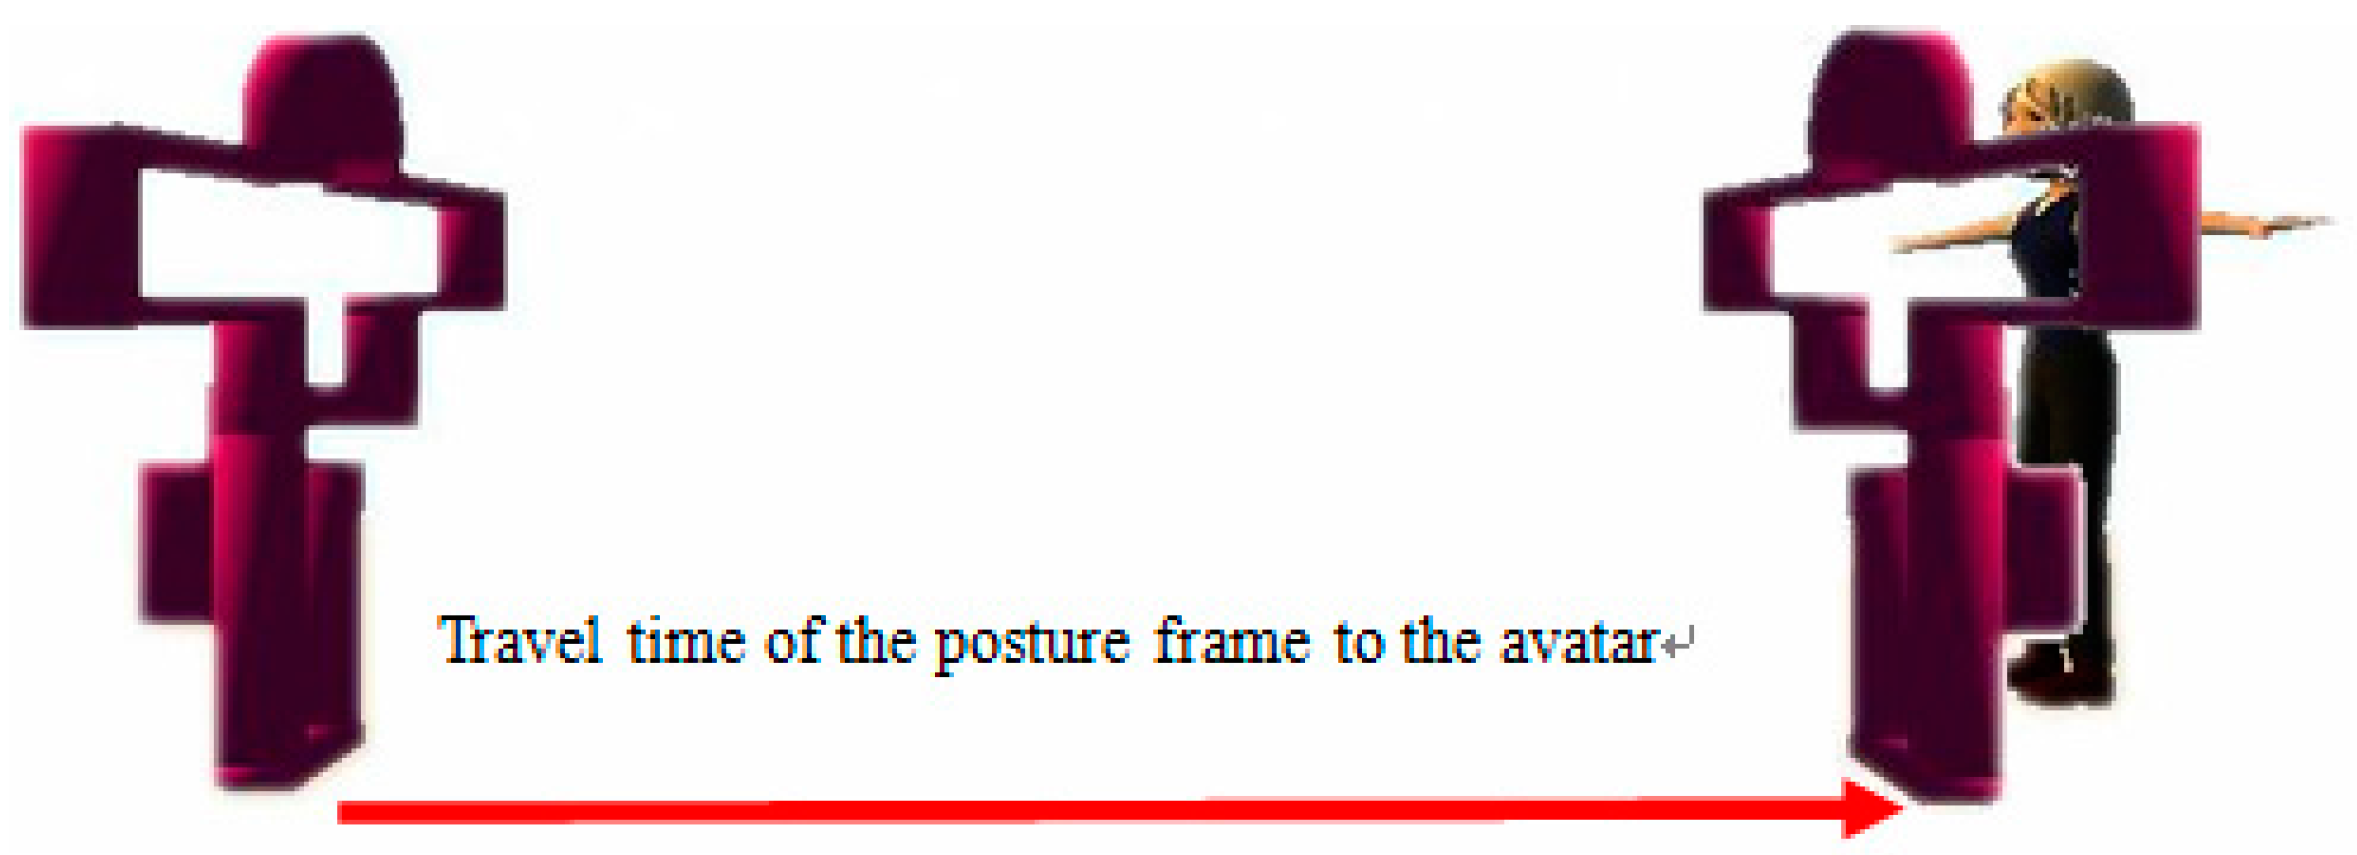
This study used multi-scale entropy analysis to compare the complexity indexes of subjects’ balancing movements under different parameter settings of both static and dynamic posture frames. The multi-scale entropy analysis parameters were set to values recommended by Costa et al. [21]: an embedding dimension (m) of 2, a tolerance (r) of 0.15. Also, the minimum number of data points required to apply the MSE method depends on the level of accepted uncertainty. Typically, in the previous study, a time series with 2 × 10⁴ data points was used for analyses extending up to scale 20 [27]. In this current study, as a sample rate of 100 Hz with a 10 min time series normally contains 5000–6000 COPs during the exergame, we used a scale of 5. All parameters were obtained from three experiments for each subject, following which descriptive statistics were used to calculate the average and standard deviation of the three tests.
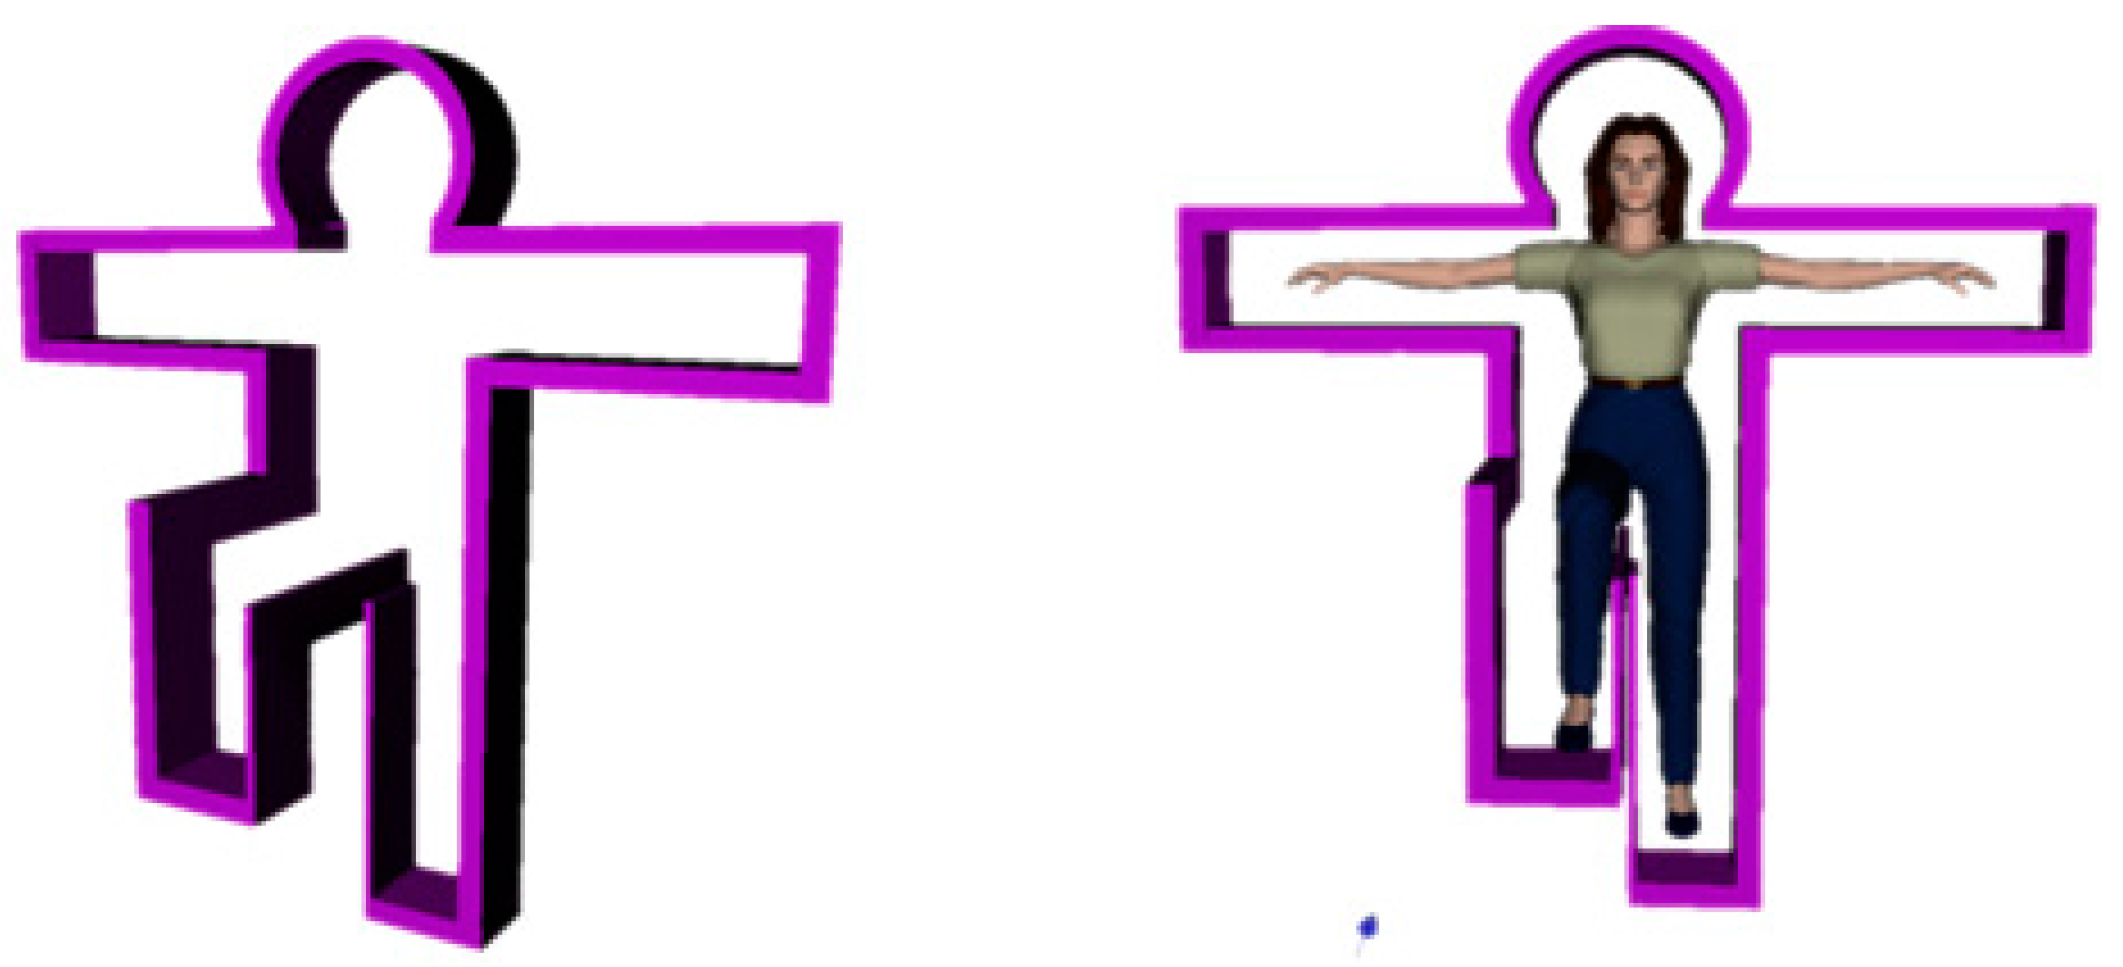
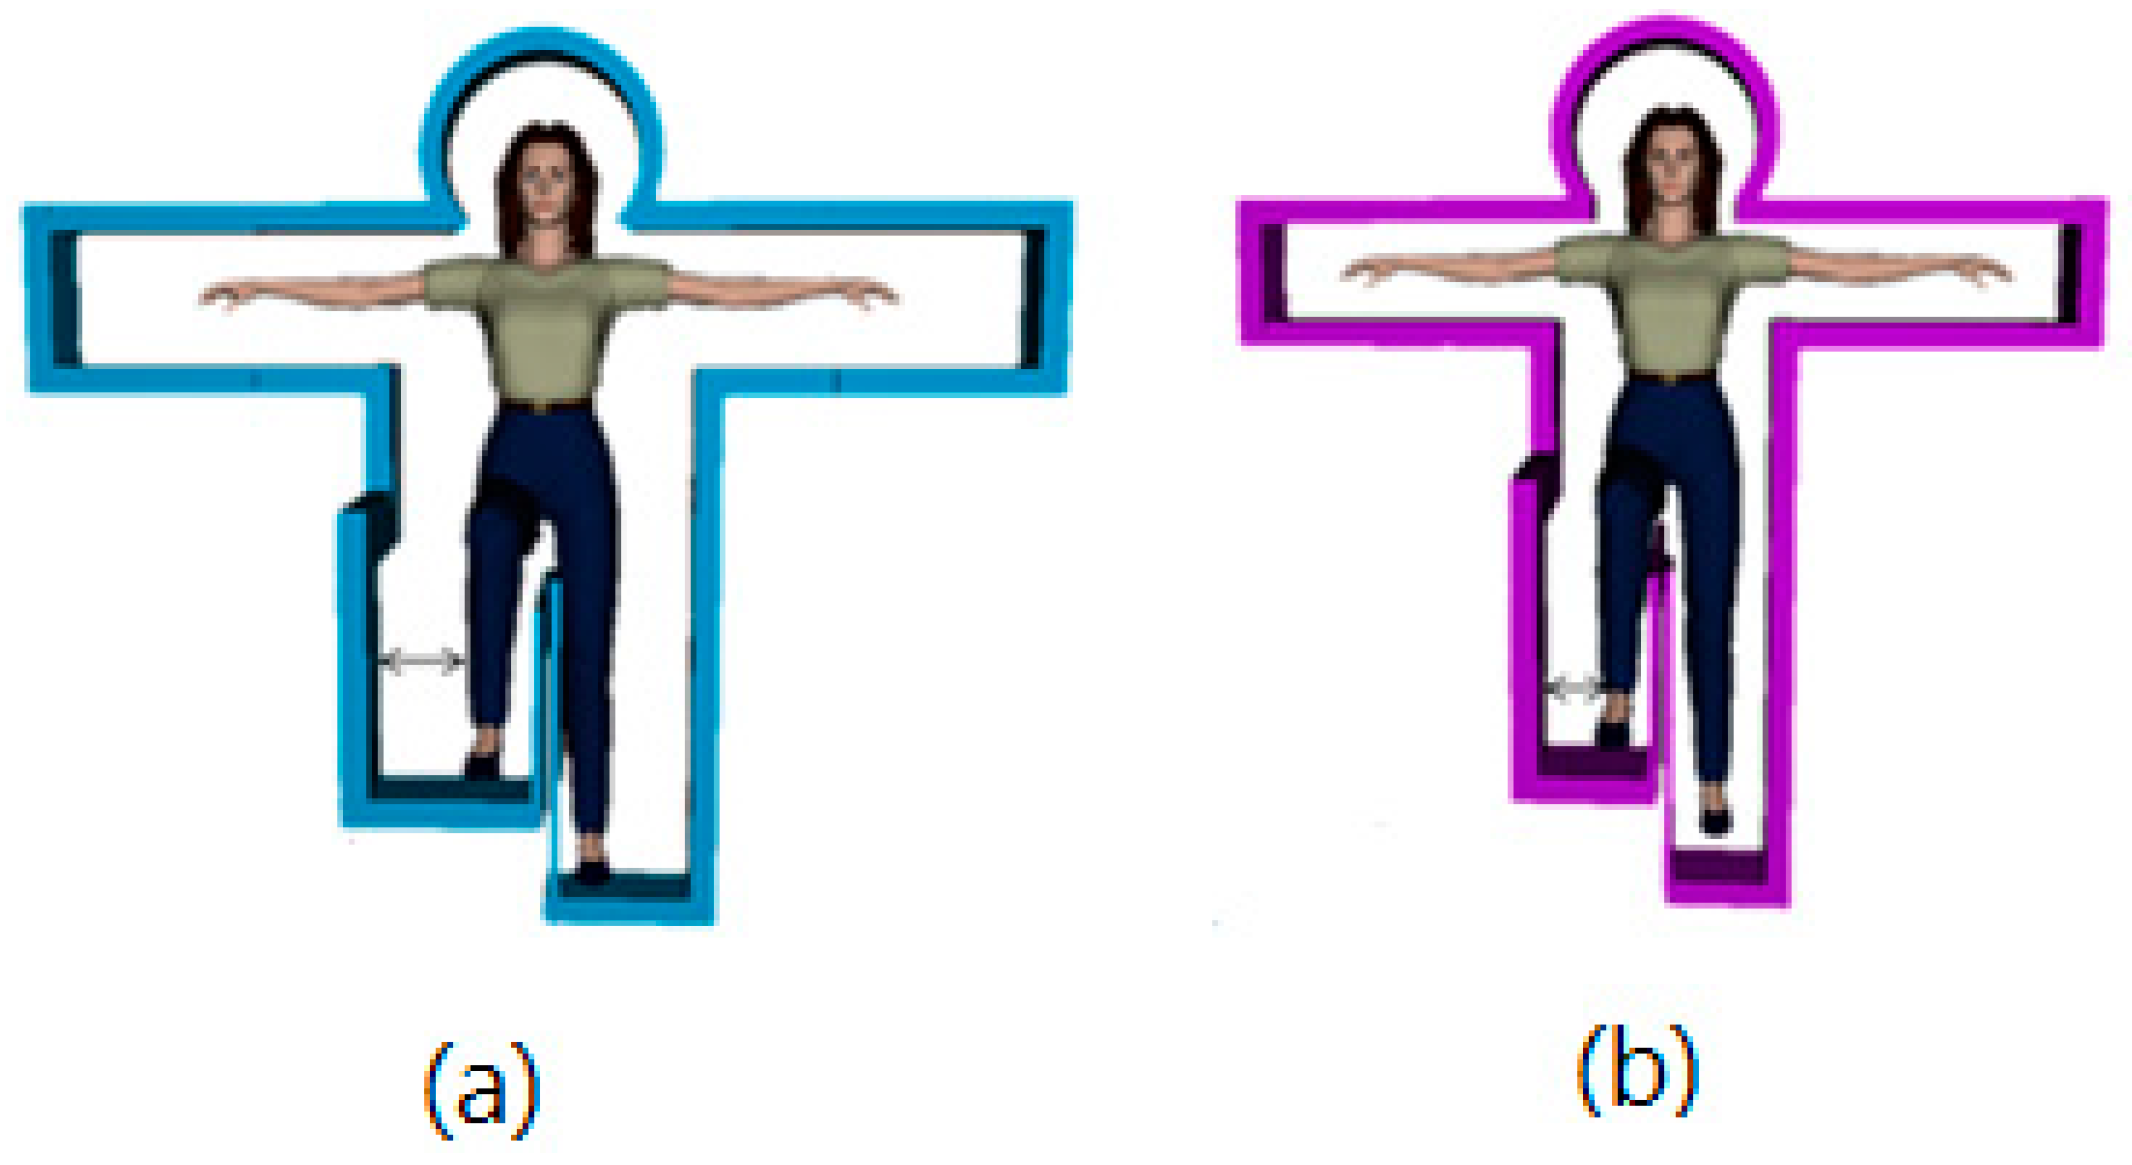
Results for the static posture frame are shown in Table 1. In both the ML and AP directions, complexity (indicating adaptability) is greatest with a wide posture frame and a 1-s posture frame travel time, while complexity is lowest with a narrow posture frame and a frame travel time of 2 s, indicating that subjects find the former parameter settings to be easier than the latter. In terms of parameter selection, the complexity of the frame travel time of 1 s is greater than that of the frame travel time of 2 s, indicating that travel time is an important factor to consider in adjusting the difficulty of the game. In terms of the direction of movement of the body’s center of mass, the complexity of anterior-posterior motion is higher than that of medio-lateral motion, indicating that for the static posture frame, maintaining medio-lateral balance is more difficult.
Table 1. MSE results for different static posture frame parameter settings.
Smaller Frame Width with a Frame Travel Time of 1 sLarger Frame Width with a Frame Travel Time of 1 sSmaller Frame Width with a Frame Travel Time of 2 sLarger Frame Width with a Frame Travel Time of 2 s
MSE-AP2.35 ± 1.042.36 ± 1.021.58 ± 0.821.92 ± 0.74
MSE-ML1.63 ± 1.191.91 ± 1.330.95 ± 0.621.10 ± 0.74
Units:mm (mean ± standard deviation).
Multiple measurements were taken to analyze the CI of the subjects under different static posture frame parameter settings (i.e., different difficulty levels). The results are shown in Table 2. It was found that for the static posture frame, MSE-AP and MSE-ML both demonstrated significant differences in complexity for different values of the posture frame travel time parameter. Of the static posture frame parameters, manipulation of posture frame travel time was found to cause significant variation in both MSE-AP and MSE-ML. These results are consistent with those obtained by Sun et al. [28] for mean distance-anterior posterior (MDIST-AP) COP measurements (see the Appendix for more details).
Table 2. P-values of MSE analysis for static posture frame parameters.
Offset (Offset of the Frame)Time (Travel Time of the Frame)Off × Time
MSE-AP0.2810.000 *0.300
MSE-ML0.2130.000 *0.566
*: p-value < 0.05
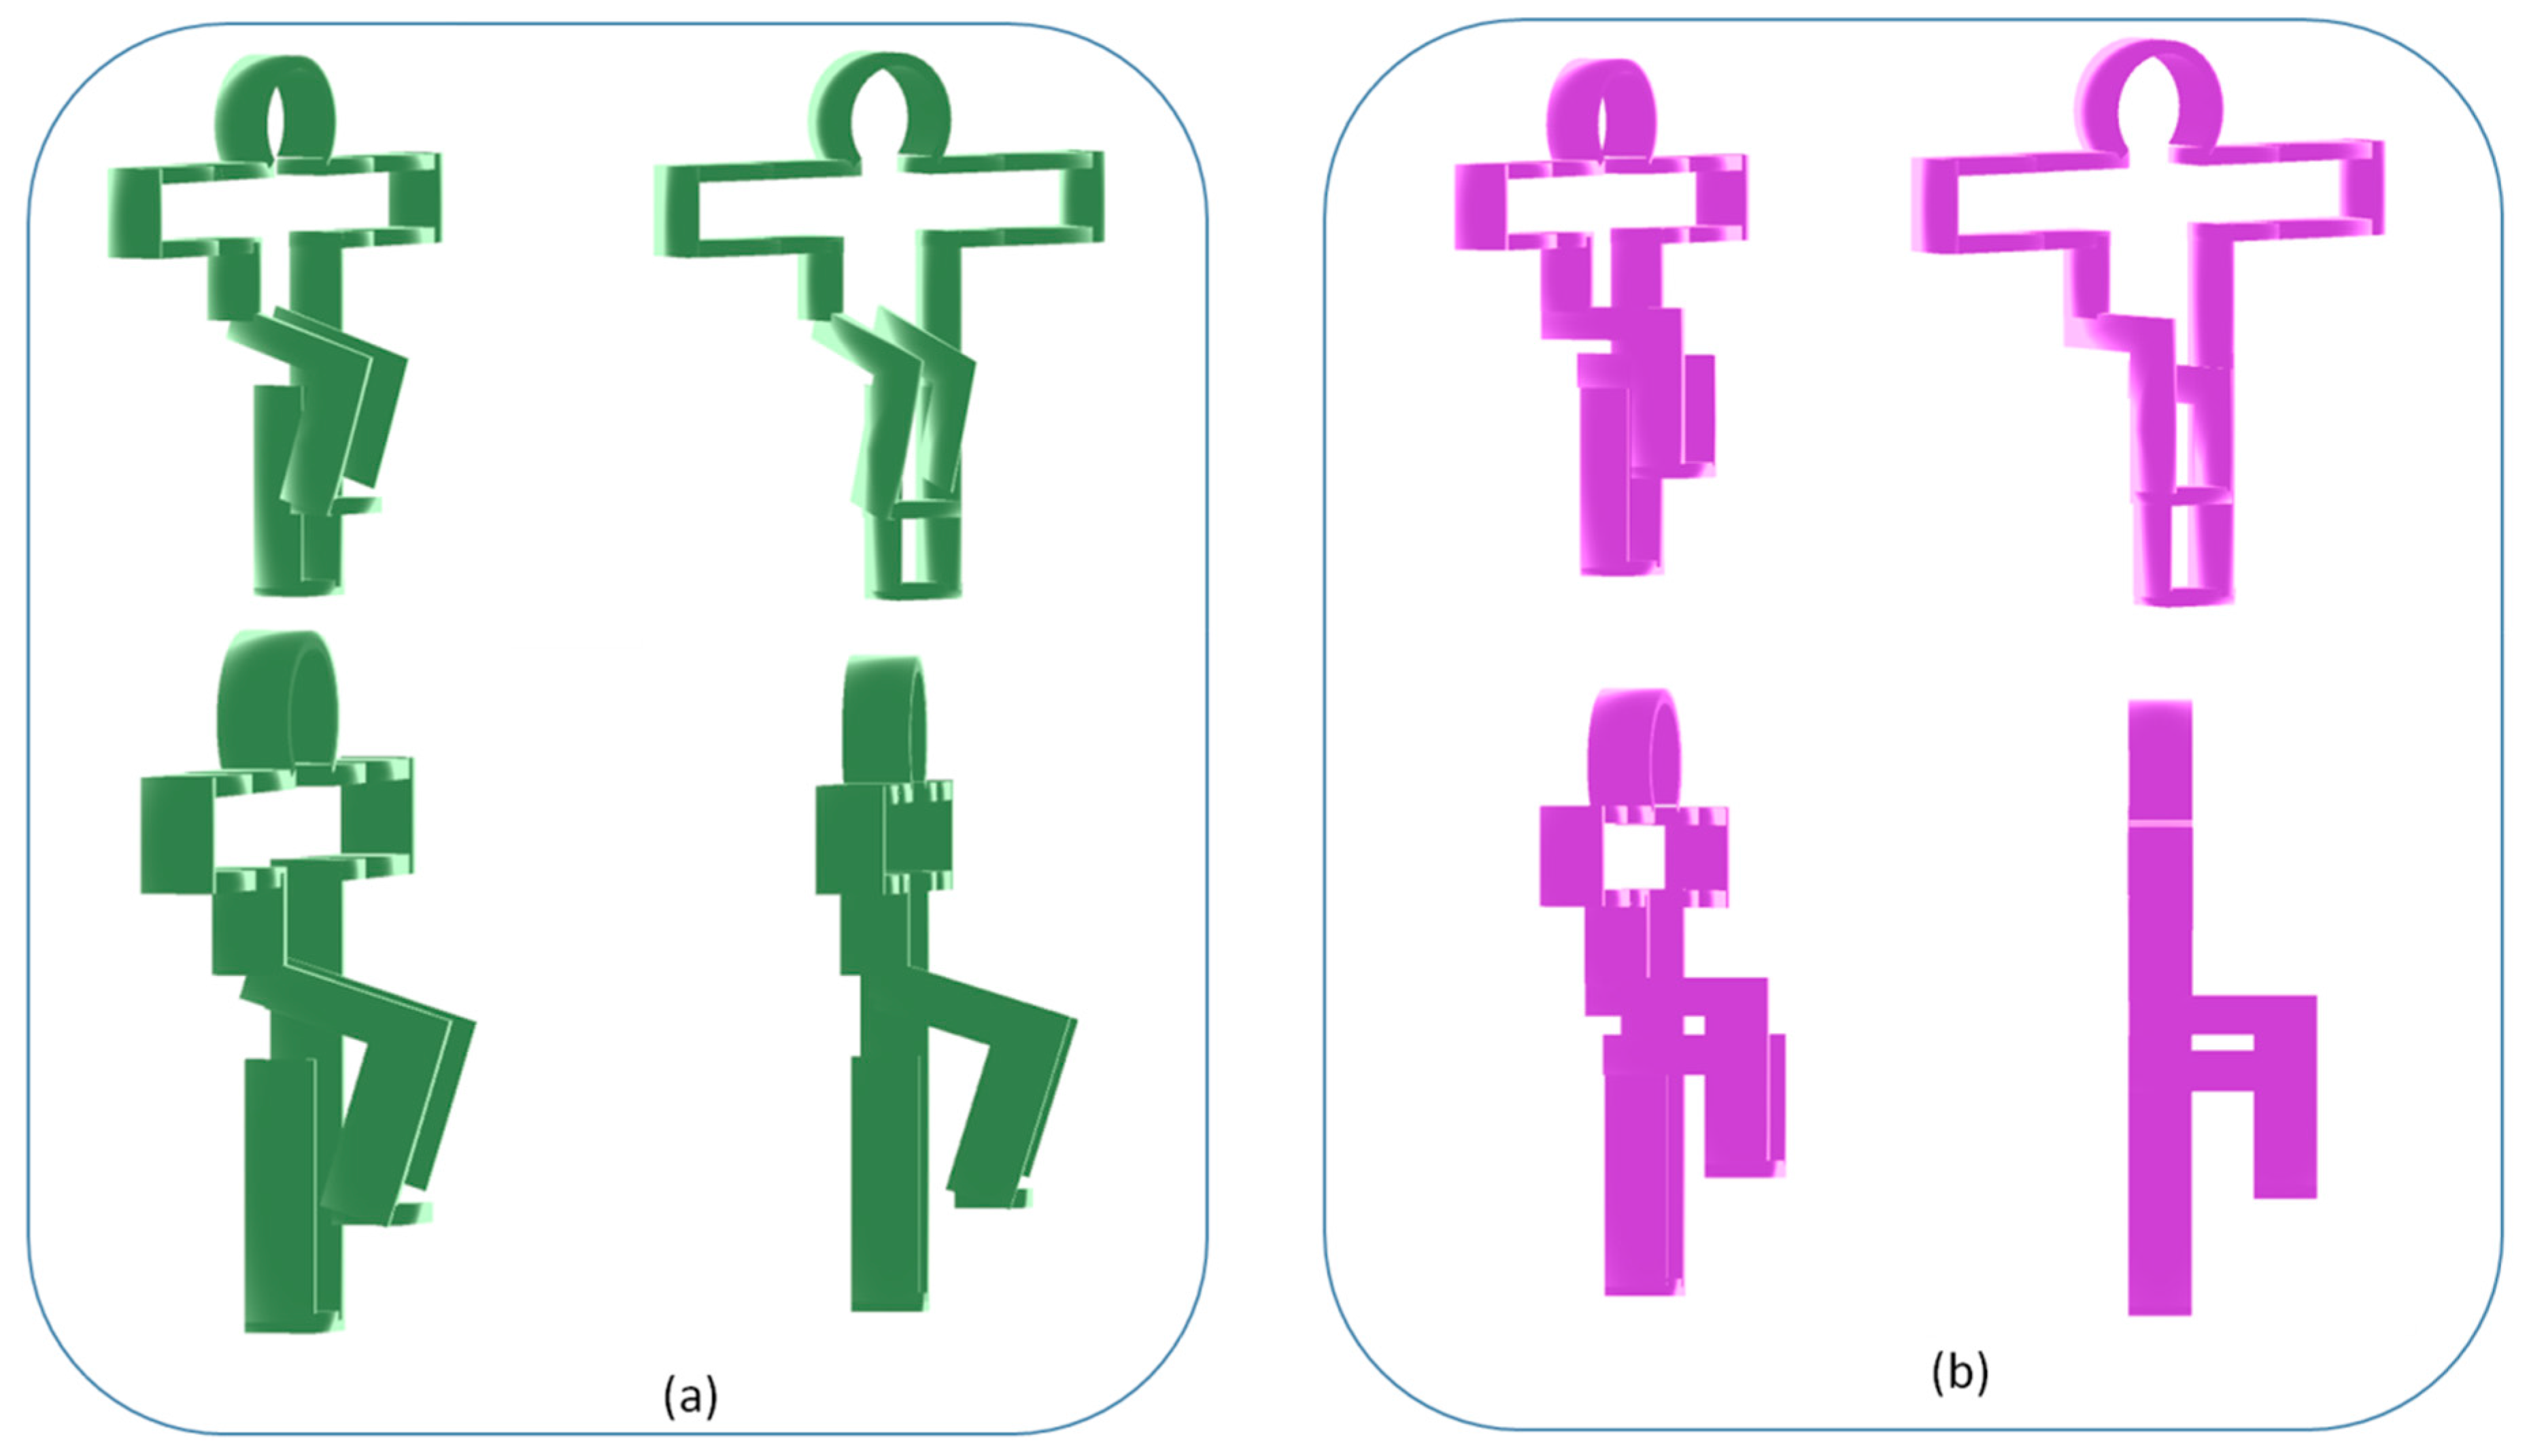
Results for the dynamic posture frame are shown in Table 3. In both ML and AP directions, complexity is greatest with a leg-raising rate of 1 s and a leg-raising angle of 45 degrees, indicating that subjects considered these parameter settings to be the easiest. In terms of parameter selection, the complexity of a leg-raising rate of 1 s is greater than 2 s, indicating that leg-raising rate is an important factor to consider in adjusting the difficulty of the game. In terms of the direction of movement of the body’s center of mass, the complexity of anterior-posterior motion is greater than that in the medio-lateral direction, indicating that for the dynamic posture frame, maintaining anterior-posterior balance is easier.
Table 3. MSE results for different dynamic posture frame parameter settings.
a Leg Raising Rate of 1 s with a Leg Raising Angle of 45 Degreesa Leg Raising Rate of 1 s with a Leg Raising Angle of 90 Degreesa Leg Raising Rate of 2 s with a Leg Raising Angle of 45 Degreesa Leg Raising Rate of 2 s with a Leg Raising Angle of 90 Degrees
MSE-AP3.56 ± 2.372.93 ± 2.272.23 ± 1.062.28 ± 1.08
MSE-ML1.93 ± 1.421.32 ± 0.991.46 ± 1.741.44 ± 1.26
Units:mm (mean ± standard deviation).
Multiple measurements were taken to analyze the value of complexity index of the subjects under different dynamic posture frame parameter settings (i.e., different difficulty levels). Results are shown in Table 4. It was found that for the dynamic posture frame, MSE-AP varied significantly for different values of leg-raising rates. Of the dynamic posture frame parameters, manipulation of leg-raising angle and leg-raising rate was found to cause significant variation in MSE-AP, which is also consistent with the results of previous work on COP indicators by Sun et al. [28], in which mean distance-medial lateral (MDIST-ML) and total excursions (TOTEX) both manifested significant differences (see Appendix).
Table 4. P-values of MSE analysis for dynamic posture frame parameters.
Angle (Leg-Raising Angle)Speed (Leg-Raising Rate)Angle × Speed
MSE-AP0.4120.019 *0.349
MSE-ML0.2540.4430.151
*: p-value < 0.05.
With respect to parameter design and difficulty level, the results of the complexity analysis indicate that the posture frame travel time and leg-raising rate parameters affect the ability of the subjects to adapt. Regarding the different types of posture frames, the performance indicators calculated from the complexity analysis suggest that the dynamic posture frame facilitates balancing and accommodates greater adaptability compared to the static posture frame.
By comparing the traditional balance indicators to the complexity index through the collection of center of pressure signals to understand the use of complexity in human-centered design, we discovered that there was no significant difference between the traditional balance indicators and the complexity index obtained from multi-scale entropy analysis. Complexity is related to our ability to provide a short description of a phenomenon [32]. Costa et al. [16] used the MSE method for quantifying the complexity expressed by physiological dynamics over multiple scales. Higher MSE values thus signify that the signal is less predictable and information-rich, whereas lower MSE values imply that the time series is more regular and less complex [6,16,18]. Lower traditional COP indictors also represent a better balancing ability. Here, our results showed the same rule; for both static and dynamic posture frames, lower complexity was associated with higher values for the traditional balance indicators. Although the MSE-ML index seemed different from the traditional balance indicators for the dynamic posture frame, the p-value suggests that this difference is insignificant. No evidence was found to show inconsistency between the results of the MSE-ML index and those of the traditional balance indicators, indicating the appropriateness of using the complexity index as a means of distinguishing between different difficulty levels (or parameter settings).
When the complexity index was examined by comparing multi-scale entropy to the traditional indicators of self-balance control, including MDISTAP, MDISTML, TOTEX and AREA_SW, we found that even the traditional COP indicators were not consistent with one another. When balance ability was determined from different COP indicators, different results could be obtained from the evaluation. When considering the results of the dynamic posture frame parameters-speed, the traditional indicators TOTEX and AREA_SW could potentially allow different interpretations of the results. These divergent results inform dramatically different outcomes in terms of parameter design. Also, in comparing these traditional indicator results to those obtained from the MSE analysis, it was discovered that MDISTML caused a significant change in balance control (as measured by COP change), but MSE-ML did not. Although the complexity of MSE and COP indictors keep to the rule, the results obtained from using different indicators differed from one another and led to different conclusions.
MDISTAP and MDISTML had no significant effect on COP in terms of balance control. However, when these results were compared to those obtained from multi-scale entropy analysis, we discovered that both MDISTAP and MDISTML caused a significant change in balance control, as measured by COP change.
Each subject was tested randomly in either a dynamic or stastic posture frame experiment. The sequences of the four different tests were randomly generated, as it was discovered that the sequence of a test may affect the subjects’ performance. As shown in Table 5 and Table 6, subjects performed best in the first test that was randomly selected. This observation was true for both male and female subjects. A previous study published by Hung et al. [32] investigated the complexity of psychological and physiological changes in undergraduates and post-graduate research students after long-term internet surfing. They showed that there was higher complexity amongst undergraduate students. Hung et al. [32] suggested that this may have been because the undergraduate students were more entertained by internet surfing than the research students. This may be because the undergraduate students were still in the beginning of their university studies, where they had just begun to realize that a wide range of information exists online and were therefore more interested in surfing. Similarly, higher complexity was obtained from the first posture frame performed by our subjects. This may because our subjects were more interested in their first test since it was their first time performing in a balance exergame and their interest diminished as they were tested in the second posture frame.
Table 5. Complexity of MSE performance of test subjects challenged to a dynamic posture four times. Test sequences were randomized.
Female Subjectsa Leg Raising Rate of 1 s with a Leg Raising Angle of 45 Degrees (PM0)a Leg Raising Rate of 1 s with a Leg Raising Angle of 90 Degrees (PM1)a Leg Raising Rate of 2 s with a Leg Raising Angle of 45 Degrees (PM2)a Leg Raising Rate of 2 s with a Leg Raising Angle of 90 Degrees (PM3)Test Sequence The Best Performance Test
MLa5.258692.8114965.8925422.16455PM(2013)PM(2,0)
c0.8682081.1890671.1302860.579494PM(1230)PM(1,2)
e0.5785810.2278820.694770.582434PM(2301)PM(2)
l0.8744471.6594340.615791.082984PM(1302)PM(1)
m4.4806450.7873680.46310.565738PM(0132)PM(0)
p3.1595860.5879870.8607270.604589PM(0231)PM(0)
APa7.6649910.439483.5336661.296804PM(1023)PM(1)
c1.4876641.3236890.927772.903727PM(3012)PM(3)
e1.3705271.7458691.2267291.18286PM(1023)PM(1)
l3.1941186.865392.5394162.363516PM(1023)PM(1)
m11.337351.7319551.7739661.846398PM(0321)PM(0)
p5.8973712.7810451.6258321.291054PM(0123)PM(0)
Male Subjectsa Leg Raising Rate of 1 s with a Leg Raising Angle of 45 Degrees (PM0)a Leg Raising Rate of 1 s with a Leg Raising Angle of 90 Degrees (PM1)a Leg Raising Rate of 2 s with a Leg Raising Angle of 45 Degrees (PM2)a Leg Raising Rate of 2 s with a Leg Raising Angle of 90 Degrees (PM3)Test SequenceThe best Performance Test
MLf0.6747360.851550.2992250.491154PM(1032)PM(1)
i2.1322511.1281262.6195241.387528PM(2031)PM(2,0)
J1.5894740.4866581.2091290.675377PM(0231)PM(0,2)
l0.3912380.3354111.087630.359725PM(2031)PM(2)
Q3.271692.2101440.0412061.180606PM(0132)PM(0)
r1.1369481.1037271.3430220.45476PM(2013)PM(2,0)
APf2.1262051.5432921.6080310.552859PM(2013)PM(0)
i4.2669380.5364383.3275522.117834PM(0231)PM(0)
J2.1005992.0235731.5606571.803152PM(0132)PM(0,1)
l1.8499033.6339181.7853881.511883PM(1023)PM(1)
Q2.0640023.5290033.4055162.145454PM(1230)PM(1)
r1.6277632.7701632.048162.773686PM(3120)PM(1,3)
Table 6. Complexity of MSE performance of test subjects challenged to a stastic posture four times. Test sequences were randomized.
Female SubjectsSmaller Frame Width with a Frame Travel Time of 1 s (PM4)Larger Frame Width with a Frame Travel Time of 1 s (PM5)Smaller Frame Width with a Frame Travel Time of 2 s (PM6)Larger Frame Width with a Frame Travel Time of 2 s (PM7)Test SequenceThe Best Performance Test
MLa2.8070410.8001310.492230.564508PM(4567)PM(4)
c2.8568323.2237831.6205551.179054PM(5467)PM(5)
e3.0668093.4295411.391682.020441PM(5476)PM(5)
l3.405713.5813971.080211.444286PM(5476)PM(5)
m3.7171842.4622080.9054310.683047PM(4756)PM(4)
p0.9808273.4993241.222450.973401PM(5674)PM(5)
APa1.0085931.7121920.9263260.922015PM(5467)PM(5)
c1.4191783.0168371.5841341.710214PM(5764)PM(5)
e2.2919595.2246991.2505061.269133PM(5476)PM(5)
l3.9571023.5477042.317772.143899PM(4567)PM(4)
m3.5849331.802520.9651742.234007PM(4756)PM(4)
p2.9125153.1394381.6727463.044492PM(5746)PM(5)
Male SubjectsSmaller Frame Width with a Frame Travel Time of 1 s (PM4)Larger Frame Width with a Frame Travel Time of 1 s (PM5)Smaller Frame Width with a Frame Travel Time of 2 s (PM6)Larger Frame Width with a Frame Travel Time of 2 s (PM7)Test SequenceThe Best Performance Test
MLf1.5988813.6714851.507582.895301PM(5746)PM(5)
i1.2278652.9950131.8072662.487046PM(5764)PM(5)
J0.3619883.9710290.6411011.58386PM(5764)PM(5)
l0.5996781.3898440.8431410.968052PM(5674)PM(5)
Q3.189012.0695051.5691670.963782PM(4567)PM(4)
r3.2624932.0328481.0201750.973401PM(4756)PM(4)
APf2.1262051.5432921.6080310.552859PM(5746)PM(5)
i4.2669380.5364383.3275522.117834PM(5764)PM(5)
J2.1005992.0235731.5606571.803152PM(5674)PM(5)
l1.8499033.6339181.7853881.511883PM(4567)PM(4)
Q2.0640023.5290033.4055162.145454PM(5476)PM(5)
r1.6277632.7701632.048162.773686PM(5467)PM(5)
According to the dynamic postures in Table 5, there was higher complexity for most subjects, regardless of gender, when tested in a ML direction “when raising the leg to an angle of 45 degrees at a rate of either one or two seconds”. This indicated that the subjects were better adapted to a leg raising angle of 45 degrees, and additionally suggests that raising a leg to 45 degrees was either than raising a leg to a 90 degree angle. When considering the AP direction, a higher complexity was observed, regardless of gender, in most subjects when the combination of “raising the leg to a 90 degree angle in one second” and “raising the leg to a 45 degree angle in one second” were performed. They could also adapt much better. This indicated that it was easier to adapt when performaing leg raise at a faster pace. According to the static postures in Table 6, female subjects could adapt much better to different speeds regardless of whether they were tested in a AP or ML direction. This observation was more obvious in the one second tests. Male subjects were better at matching the posture of the frame regardless of whether they were tested in a AP or ML direction. This was more obvious in tests that used posture frames with larger widths.
The results of this study suggest that multi-scale entropy analysis reflects subjects’ adaptability during static and dynamic activities. Gruber et al. [21] considered that, in comparison to traditional balance indicators, multi-scale entropy explains changes in displacement using knowledge of dynamics and reveals more hidden information. In light of this, they suggest including two directions of postural control assessment in traditional balance indicators. The author inferred that this method seemed to be a rigorous tool for the analysis of dynamic activity, which is consistent with the conclusions of Busa et al. [20], in which multi-scale entropy was used to analyze position control during a static activity.
This study hoped to identify the parameters affecting activity performance in exergames using multi-scale entropy. We first investigated the parameters involved in Kinect-based exergame performance, then used the concept of complexity through MSE to define their control mechanisms, rather than simply arriving at an understanding of the statistical significance of discrete data [20]. Not only is this method useful as an assessment criterion for future studies, it also opens up new avenues for exploration of the use of multi-scale entropy analysis as a tool in the design of virtual environments and in the selection of parameter settings by elucidating exergame performance mechanisms.

4. Conclusions

The purpose of this study was two-fold: (1) to investigate the potential of an exergame for balance training in healthy subjects; and (2) to evaluate how parameters would affect subjects’ balance ability using multi-scale complexity analysis. It was anticipated that the findings emerging from this study would inform the design of an exergame that can easily be adapted to suit different needs. It was found that the results from the complexity index and traditional balance indicators are comparable in their implications on the different parameters. The results suggest that this type of exergame lends itself to the use of the complexity index to design training tasks. Our study is different from previous studies that have used multi-scale entropy to discuss physiological and pathological events of aging [10,16,19,20,21,24,25,27,32,35,36] in that we used multi-scale entropy to determine the parameters that affect the performance of movement, as a method of data analysis, and as an assessment of activity performance. In the future, the applications of the complexity index could be generalized to other population groups, ideally covering a range of tasks and training characteristics such as difficulty levels.

Author Contributions

Chia-Hsuan Lee and Tien-Lung Sun designed the study. Chia-Hsuan Lee was responsible for data collection and analysis. Chia-Hsuan Lee and Tien-Lung Sun reviewed relevant literature and interpreted the acquired data. Chia-Hsuan Lee drafted the manuscript. Both authors have read and approved the final manuscript.

Conflicts of Interest

The authors declare no conflict of interest.

Appendix

Table A1. Different static posture frame parameter settings using traditional balance indicators.
Smaller Frame Width with a Frame Travel Time of 1 sLarger Frame Width with a Frame Travel Time of 1 sSmaller Frame Width with a Frame Travel Time of 2 sLarger Frame Width with a Frame Travel Time of 2 s
MDIST-AP0.77 ± 0.250.70 ± 0.180.97 ± 0.250.94 ± 0.29
MDIST-ML1.98 ± 1.161.99 ± 1.161.94 ± 1.471.72 ± 1.32
TOTEX53.98 ± 15.5753.68 ± 17.2853.68 ± 16.3251.52 ± 17.87
AREA_SW0.07 ± 0.060.06 ± 0.050.06 ± 0.050.06 ± 0.02
Unit: mm (mean 6 standard deviation).
Table A2. Dynamic posture frame parameter settings using traditional balance indicators.
a Leg Raising Rate of 1 s with a Leg Raising Angle of 45 Degreesa Leg Raising Rate of 1 s with a Leg Raising Angle of 90 Degreesa Leg Raising Rate of 2 s with a Leg Raising Angle of 45 Degreesa Leg Raising Rate of 2 s with a Leg Raising Angle of 90 Degrees
MDIST-AP0.47 ± 0.250.46 ± 0.230.52 ± 0.230.51 ± 0.21
MDIST-ML0.89 ± 0.690.95 ± 0.751.18 ± 0.841.11 ± 0.83
TOTEX13.93 ± 3.7914.46 ± 5.2924.94 ± 5.4625.22 ± 6.09
AREA_SW0.03 ± 0.020.01 ± 0.010.04 ± 0.020.04 ± 0.03
Table A3. p-values of COP indicator analysis of static posture frame parameters.
Offset (Offset of the Frame)Time (Travel Time of the Frame)Off × Time
MDIST-AP0.1790.000 *0.416
MDIST-ML0.3860.3470.328
TOTEX0.4350.4800.445
AREA_SW0.2760.0600.212
*: p-value <0.05
Table A4. p-values of COP indicator analysis of dynamic posture frame parameters.
Angle (Leg-Raising Angle)Speed (Leg-Raising Rate)Angle × Speed
MDIST-AP0.6870.1520.957
MDIST-ML0.9790.003 *0.312
TOTEX0.3080.000 *0.749
AREA_SW0.4790.0680.283
*: p-value <0.05

References

  1. Kravitz, L. The 25 Most Significant Health Benefits of Physical Activity & Exercise. IDEA Fit. J. 2007, 4, 54–63. [Google Scholar]
  2. Su, M.C. The Research and Design of Canes for Elders; Tatung University: Taipei, Taiwan, 1997. [Google Scholar]
  3. Hsu, L.C. Combine Virtual Reality with Motion Capture System for Balance Training Performance in Postural Responses. Master’s Thesis, Yuan Ze University, Taoyuan, Taiwan, 2011. [Google Scholar]
  4. He, C.S.; Chiang, I.F.; Fang, S.H. Comparison of Static Balance between Aboriginal and Non-Aboriginal Elementary School Students. Sports Exerc. Res. 2010, 12, 72–80. [Google Scholar] [CrossRef]
  5. Twist, P.; Hutton, J. Identifying, Understanding and Training Youth Athletes. IDEA Fit. J. 2007, 4. Available online: http://www.ideafit.com/fitness-library/identifying-understanding-and-training-youth-athletes (accessed on 15 October 2015). [Google Scholar]
  6. Costa, M.; Goldberger, A.L.; Peng, C.K. Multiscale Entropy Analysis of Complex Physiologic Time Series. Phys. Rev. Lett. 2002, 89. [Google Scholar] [CrossRef]
  7. Yong, J.L.; Soon, Y.T.; Xu, D.; Thia, E.; Pei, F.C.; Kuah, C.W.; Kong, K.H. A feasibility study using interactive commercial off-the-shelf computer gaming in upper limb rehabilitation in patients after stroke. J. Rehabil. Med. 2010, 42, 437–441. [Google Scholar] [CrossRef] [PubMed]
  8. Chen, B.C. The Approximate Entropy and the Complexity Theories Establish the Depth of Anaesthesia System. Master’s Thesis, Yuan Ze University, Taoyuan, Taiwan, 2006. [Google Scholar]
  9. Liu, C.Y. Constructing the Balance Measuring System and Signal Analysis Using Multi-Scale Entropy. Master’s Thesis, Yuan Ze University, Taoyuan, Taiwan, 2009. [Google Scholar]
  10. Yang, T.H. The Stability for Different Effect and Aging on Multiscale Entropy. Master’s Thesis, Yuan Ze University, Taoyuan, Taiwan, 2008. [Google Scholar]
  11. Martin, M.T.; Plastino, A.; Rosso, O.A. Generalized statistical complexity measures: Geometrical and analytical properties. Physica A 2006, 369, 439–462. [Google Scholar] [CrossRef]
  12. Piasecki, R. Microstructure reconstruction using entropic descriptors. Proc. R. Soc. A 2011, 467, 806–820. [Google Scholar] [CrossRef]
  13. Kowalski, A.M.; Martín, M.T.; Plastino, A.; Rosso, O.A.; Casas, M. Distances in probability space and the statistical complexity setup. Entropy 2011, 13, 1055–1075. [Google Scholar] [CrossRef] [Green Version]
  14. Rosso, O.A.; Martin, M.T.; Plastino, A. Brain electrical activity analysis using waveletbased informational tools (II): Tsallis nonextensivity and complexity measures. Physica A 2003, 320, 497–511. [Google Scholar] [CrossRef]
  15. Escudero, J.; Abasolo, D.; Hornero, R.; Espino, P.; Lopez, M. Analysis of electroencephalograms in Alzheimer’s disease patients with multiscale entropy. Physiol. Meas. 2006, 27, 1091–1106. [Google Scholar] [CrossRef] [PubMed]
  16. Costa, M.; Goldberger, A.L.; Peng, C.K. Multiscale entropy analysis of biological signals. Phys. Rev. E 2005, 71, 1–8. [Google Scholar] [CrossRef]
  17. Liang, W.K.; Lo, M.T.; Yang, A.C.; Peng, C.K.; Cheng, S.K.; Tseng, P.; Juan, C.H. Revealing the brain’s adaptability and the transcranial direct current stimulation facilitating effect in inhibitory control by multiscale entropy. Neuroimage 2014, 90, 218–234. [Google Scholar] [CrossRef] [PubMed]
  18. Wang, C.H.; Tsai, C.L.; Tseng, P. The association of physical activity to neural adaptability during visuo-spatial processing in healthy elderly adult: A multiscale entropy analysis. Brain Cogn. 2014, 92, 73–83. [Google Scholar] [CrossRef] [PubMed]
  19. Manor, B.; Costa, M.D.; Hu, K.; Newton, E.; Starobinets, O.; Kang, H.G.; Peng, C.K.; Novak, V.; Lipsitz, L.A. Physiological complexity and system adaptability: Evidence from postural control dynamics of older adults. J. Appl. Physiol. 2010, 109, 1786–1791. [Google Scholar] [CrossRef] [PubMed]
  20. Busa, M.A.; Gruber, A.H.; Gorton, G.E., III; Masso, P.D.; Hamill, J.; van Emmerik, R.E.A. Multiscale Entropy Identifies Complexity Changes in Postural Control of Adolescent Idopathic Scoliosis. In Proceedings of the 34th Annual International Conference of the American Society of Biomechanics (ASB’10), Providence, RI, USA, 18–21 August 2010.
  21. Gruber, A.H.; Busa, M.A.; Gorton, G.E., III; van Emmerik, R.E.A.; Masso, P.D.; Hamill, J. Time-to-contact and multiscale entropy identify differences in postural control in adolescent idiopathic scoliosis. Gait Posture 2011, 34, 13–18. [Google Scholar] [CrossRef] [PubMed]
  22. Costa, M.; Goldberger, A.L.; Peng, C.K. Multiscale entropy to distinguish between physiologic and synthetic RR time series. Comput. Cardiol. 2002, 29, 137–140. [Google Scholar] [PubMed]
  23. Cai, R.; Bian, C.H.; Ning, X.B. Multiscale Entropy analysis of Complex Physiologic time series. J. Biomed. Eng. 2007, 26, 543–547. [Google Scholar]
  24. Costa, M.; Peng, C.K.; Goldberger, A.L.; Hausdor, J.M. Multiscale entropy analysis of human gait dynamics. IEEE Comput. Cardiol. 2003, 30, 705–707. [Google Scholar] [CrossRef]
  25. Duarte, M.; Sternad, D. Complexity of human postural control in young and older adults during prolonged standing. Exp. Brain Res. 2008, 191, 265–276. [Google Scholar] [CrossRef] [PubMed]
  26. Vaillancourt, D.E.; Sosnoff, J.J.; Newell, K.M. Age-related changes in complexity depend on task dynamics (Letter to the editor). J. Appl. Physiol. 2004, 97, 454–455. [Google Scholar] [CrossRef] [PubMed]
  27. Costa, M.; Priplata, A.A.; Lipsitz, L.A.; Wu, Z.; Huang, N.E.; Goldberger, A.L.; Peng, C.K. Noise and poise: Enhancement of postural complexity in the elderly with a stochastic resonance-based therapy. Europhys. Lett. 2007, 77. [Google Scholar] [CrossRef] [PubMed]
  28. Sun, T.L.; Lee, C.H. An Impact Study of the Design of Exergaming Parameters on Body Intensity from Objective and Gameplay-Based Player Experience Perspectives, Based on Balance Training Exergame. PLoS ONE 2013. [Google Scholar] [CrossRef] [PubMed]
  29. Prieto, T.E.; Myklebust, J.B.; Hoffmann, R.G.; Lovett, E.G.; Myklebust, B.M. Measures of postural steadiness: Differences between healthy young and elderly adults. IEEE Trans. Biomed. Eng. 1996, 43, 956–966. [Google Scholar] [CrossRef] [PubMed]
  30. Keshner, E.A.; Kenyon, R.V. Postural and spatial orientation driven by virtual reality. Stud. Health Technol. Inform. 2009, 145, 209–228. [Google Scholar] [PubMed]
  31. Lott, A.; Bisson, E.; Lajoie, Y.; McComas, J.; Sveistrup, H. The effect of two types of virtual reality on voluntary center of pressure displacement. Cyberpsychol. Behav. 2003, 6, 477–485. [Google Scholar] [CrossRef] [PubMed]
  32. Hong, C.H.; Jiang, B.C. Multi-scale Entropy Approach to Physiological Fatigue during Long-term Web Browsing. Hum. Factor Ergon. Man. 2009, 19, 478–493. [Google Scholar] [CrossRef]
  33. Lake, D.E.; Richman, J.S.; Griffin, M.P.; Moorman, J.R. Sample entropy analysis of neonatal heart rate variability. Am. J. Physiol. Regul. Integr. Comp. Physiol. 2002, 283, 789–797. [Google Scholar] [CrossRef] [PubMed]
  34. Pincus, S.M. Approximate entropy as a measure of system complexity. Proc. Natl. Acad. Sci. USA 1991, 88, 2297–2301. [Google Scholar] [CrossRef] [PubMed]
  35. Li, W.I. Multi-Scale Entropy and Hilbert Spectrum Analysis Applied in Acupoint Magnetic Therapy: A Study of Elderly Balance Enhancement. Master’s Thesis, Yuan Ze University, Taoyuan, Taiwan, 2011. [Google Scholar]
  36. Su, H.Y. Postural balance ability analysis for outpatients after Port-A surgery in anesthesia using multiscale entropy. Master’s Thesis, Yuan Ze University, Taoyuan, Taiwan, 2009. [Google Scholar]

