
Ultrasound Detection of Scatterer Concentration by Weighted Entropy

1
Department of Medical Imaging and Radiological Sciences, College of Medicine, Chang Gung University, Taoyuan 33302, Taiwan
2
Medical Imaging Research Center, Institute for Radiological Research, Chang Gung University and Chang Gung Memorial Hospital at Linkou, Taoyuan 33302, Taiwan
3
Department of Electrical Engineering, Chang Gung University, Taoyuan 33302, Taiwan
Entropy 2015, 17(10), 6598-6616; https://doi.org/10.3390/e17106598
Submission received: 22 April 2015
/
Revised: 18 September 2015
/
Accepted: 23 September 2015
/
Published: 25 September 2015
(This article belongs to the Section Information Theory, Probability and Statistics)
Abstract
:Ultrasound backscattering signals depend on the microstructures of tissues. Some studies have applied Shannon entropy to analyze the uncertainty of raw radiofrequency (RF) data. However, we found that the sensitivity of entropy in detecting various scatterer concentrations is limited; thus, we propose a weighted entropy as a new information entropy-based approach to enhance the performance of scatterer characterization. A standard simulation model of ultrasound backscattering was used to generate backscattered RF signals with different number densities of scatterers. The RF signals were used to estimate the weighted entropy according to the proposed algorithmic scheme. The weighted entropy increased from 0.08 to 0.23 (representing a dynamic range of 0.15) when the number density of scatterers increased from 2 to 32 scatterers/mm2. In the same range of scatterer concentration, the conventional entropy increased from 0.16 to 0.19 (a dynamic range of 0.03). The results indicated that the weighted entropy enables achieving a more sensitive detection of the variation of scatterer concentrations by ultrasound.
1. Introduction
Ultrasound B-mode imaging is an important imaging modality because of its cost effectiveness, nonionizing radiation, real-time capability, and widespread applicability in various clinical settings. Ultrasound scattering occurs when the wavelength of an incident ultrasound signal is greater than the sizes of scatterers in a tissue, and the scattering results in a speckle pattern in a B-mode image. Different arrangements of scatterers in a medium result in different tissue microstructures, producing distinct envelope statistics that can be modeled using mathematical statistical distributions to characterize tissues quantitatively [1].
Rayleigh distribution is the first model used to describe the envelope statistics of ultrasound signals [2]. The distribution of the backscattered envelope conforms to the Rayleigh distribution when the resolution cell of the ultrasound transducer contains numerous randomly distributed scatterers. The scatterers in most biological tissues can be arranged in various manners. Therefore, some non-Rayleigh distributions, such as Rician [3], K [4], homodyned K [5], and generalized K [6], have been applied to encompass both the pre-Rayleigh and post-Rayleigh statistics. Estimation methods for the parameters of the K models have also been explored [7,8,9,10].
The Nakagami distribution, which was first defined in the field of wave propagation [11], is currently the most frequently adopted model in the context of tissue characterization because of its simplicity and low computational complexity [12]. It has been shown that: (i) the backscattered envelopes of ultrasound signals returned from tissues are Nakagami-distributed data, and (ii) the Nakagami parameter estimated using the backscattered envelopes can enable adequately differentiating various scattering conditions (pre-Rayleigh, Rayleigh, and post-Rayleigh distributions) for characterizing tissues [13]. In particular, previous studies have proposed several Nakagami-model-based compounding models for achieving a more favorable fit to the statistical distribution of backscattered signals [14,15,16]. The Nakagami distribution can be considered a general model for ultrasound backscattering [13].
One constraint to employing physically based statistical models for fitting the backscattered envelopes is that the distribution of the backscatter envelope data must conform to the used distribution [13,17,18,19]. This requirement may not always be satisfied because adjusting the settings in an ultrasound system or using nonlinear signal processing approaches (e.g., logarithmic compression) may alter the statistical distribution of raw data. Using different demodulation methods may also result in different envelope statistics [20]. Even if operators use the same system settings and demodulation method, the output signals that exactly follow a specific statistical distribution are sometimes difficult to obtain because different manufacturers utilize different hardware and software techniques to process the output data. In particular, not every system manufacturer releases the image raw data for users. To address this limitation, applying a more flexible parameter that is independent of any statistical model for backscattering analysis is highly required.
Recall that Shannon established a mathematical theory of communication and defined the so-called entropy as a measure of uncertainty in a random variable [21]. Hughes first proposed using information (Shannon) entropy for analyzing ultrasound signals, indicating that entropy can be used to quantitatively characterize the changes in the microstructures of scattering media [22,23,24,25,26]. Entropy is also a function of probability density; therefore, it may be related to distribution parameters to reflect the physical meaning of backscattered statistics to some degree [17,19]. Compared with the distribution parameters, entropy is estimated using the raw waveform of ultrasound radiofrequency (RF) data returned from a scattering medium (not envelope data), thereby preventing the possible effects of the demodulation method on parameter estimation. Moreover, estimating entropy does not require the backscattered data to follow a specific distribution, thus providing the opportunity to establish methods that are more flexible in practical applications.
We recently evaluated entropy measures and our preliminary tests in the laboratory showed that the standard Shannon entropy estimation by using raw RF data (not envelope) is not sensitive to the variation in the scatterer concentration (i.e., the number density of scatterers in a scattering medium) (please see Section 4 for the detailed results). A low sensitivity of parameter during the process of detecting the scatterer concentration limits the performance of characterizing tissues. Some studies conducted in other fields have indicated that the standard entropy measure may lose some of the vital information [27,28] and may provide only a binary decision or classification (e.g., good or bad, normal or abnormal) [29]. Compared with the conventional Shannon entropy, weighted entropy is the measure simultaneously considering the objective probabilities and some subjective weights [30]. Some previous studies have reported that weighted entropy demonstrates more efficient performance in information analysis and recognition than the standard entropy does [27,28,29,31]. The above-mentioned literatures [27,28,29,31] indicated that a weighted scheme has merit and may be used to sensitize the response of the entropy to the change in the properties of the backscattered data. Therefore, we explored the following fundamental questions in this study: (i) how can the weighting technique be used to improve the sensitivity of ultrasound entropy in detecting the number densities of scatterers? (ii) how can the weighted entropy be estimated relatively robustly?
The remainder of this paper is organized as follows: first, the theoretical background of the standard Shannon and weighted entropies are introduced. Next, the procedures involved in defining the ultrasound weighted entropy and establishing an appropriate algorithmic scheme are presented. The results are presented, showing that weighted entropy enables enhanced sensitivity in detecting scatterer concentrations without prior knowledge of the data distribution.
2. Theoretical Background
2.1. Entropy
Information, which is not a physical entity but an abstract concept, was difficult to quantify until Shannon proposed information theory and introduced entropy as a fundamental measure of information [21]. Information is essentially uncertain, not deterministic [32]. Consequently, an information source is naturally modeled as a random variable or a random process, and probability is employed to develop the theory of information. In ultrasound imaging, the Shannon entropy of backscattered RF signals y = f(t) is defined as the negative of the logarithm of the backscattered probability distribution, and it can be expressed as follows [23]:
where t represents time, w(y) means the probability density function of f(t), y means the amplitude of f(t), and ymin and ymax represent the minimum and maximum values of f(t), respectively. In practice, the Shannon entropy is obtained using digitized versions of the underlying continuous waveform in a discrete form of Equation (1). Entropy is a measure of the uncertainty or unpredictability of information content. Minimum entropy occurs when all amplitude values in the backscattered signals are the same. Maximum entropy is obtained when each amplitude value occurs exactly once.
2.2. Weighted Entropy
Entropy is the average amount of information contained in a message (i.e., the backscattered signals). The standard definition of Shannon entropy can be used to provide an objective information measure because it depends on only the probability density function of the message and is not correlated with the symbols in the message (i.e., the amplitude values). An objective consideration based on probability was indeed a top priority when Shannon defined entropy for measuring information uncertainty. However, this does not indicate that the symbols in the message are inadequate for interpreting information. As mentioned in the Introduction, the standard entropy may lose some information, resulting in inferior performance in information analysis [27,28,29]. We must thus reexamine the definition of entropy and assume that the symbols in the message or some subjective factors may play vital roles in quantifying information. Therefore, a previous study proposed a highly flexible weighted entropy, which is a measure of information supplied by a probabilistic experiment in which elementary events are characterized both by their objective probabilities and by some qualitative (objective or subjective) weights [30].
2.3. Ultrasound Weighted Entropy
Next, the procedures involved in defining the weighted entropy for ultrasound RF signals are presented. Based on the spirit of the weighted entropy, users are allowed to determine their weighting factors according to the practical considerations and requirements. Ultrasound backscattered signals are typically formed from the acoustic interference between the incident wave and the scatterers in a tissue. When the number density of scatterers is increased, the effect of constructive wave interference causes the distribution of the backscattered statistics to vary toward the Rayleigh distribution [13] and also leads to larger backscattered echoes [33]. Strong scatterers or an aggregation of scatterers also result in the formation of high-amplitude signals [34]. Obviously, in the conventional definition of entropy, the relevance of signal amplitude in information interpretation is neglected. To endow ultrasound-based entropy with sufficient information sources, the amplitude values y corresponding to the probabilities w(y) are used to define the weighted entropy in this study:
3. Materials and Methods
3.1. Simulation Model
In the past, several simulation models for ultrasound echoes generation have been developed [35,36,37]. To reduce the computational complexity of performing the simulations, a simplified model based on the convolution of the incident wave with the set of delta functions is an alternative approach [38], which was demonstrated to provide a realistic description of the backscattered signals [38,39,40,41]. For this reason, the simplified model was selected and the detailed simulation procedures are described below.
In the simulations, the sampling rate was set to 50 MHz, and the speed of sound was 1540 m/s. A 5-MHz Gaussian pulse (a pulse length of 0.89 mm, bandwidth of 80%, and beam width of 1.66 mm) was generated as the incident wave, generating a 2D transducer resolution cell with a size of approximately 1.48 mm2 (0.89 mm × 1.66 mm). A computer phantom Z was modeled using a 2D matrix with randomly positioned delta functions to simulate a spatial arrangement of K scatterers in a medium; this phantom is expressed as follows:
The size of the phantom was approximately 3 cm × 3 cm, corresponding to a 1000 × 1000 matrix. Raw simulated image RF data were obtained by convoluting the incident wave H with the computer phantom Z as expressed in Equation (4):
3.2. Weighted Entropy Estimation of Ultrasound Data
Before performing entropy estimations, w(y), the probability density function of raw RF data must be obtained. Ideally, w(y) is obtained from the continuous waveform of backscattered RF signals, which is not accurately known in practice because of a finite sampling rate [23]. Therefore, in estimating entropy, an efficient and robust scheme is required for reconstructing w(y) from a digital waveform. Hughes proposed an algorithmic scheme based on Fourier analysis for establishing the probability density function of RF data, which can be expressed as follows [23]:
where λ = (ymax − ymin) / 2, μ = (ymax + ymin) / 2, and an represents the Fourier coefficients calculated using Equation (6):
where [a, b] is the interval of f(t). Different ultrasound systems may produce different dynamic ranges of RF signals (i.e., ymax − ymin); therefore, signal normalization is performed to limit the variance of signal amplitudes between −1 and 1. Moreover, as shown in Equation (5), the infinite sum must be approximated by introducing a finite number of terms in Fourier series on the bounds of summation [23]. According to the mentioned considerations, the approximations of Equations (5) and (6) can be expressed as follows:
and:
According to Equation (7), two algorithmic parameters affect the reconstruction of w(y), which are Nco (the number of terms in Fourier series is determined by 2Nco + 1) and Δy (i.e., the interval between discrete sample points in the reconstructed w(y)).
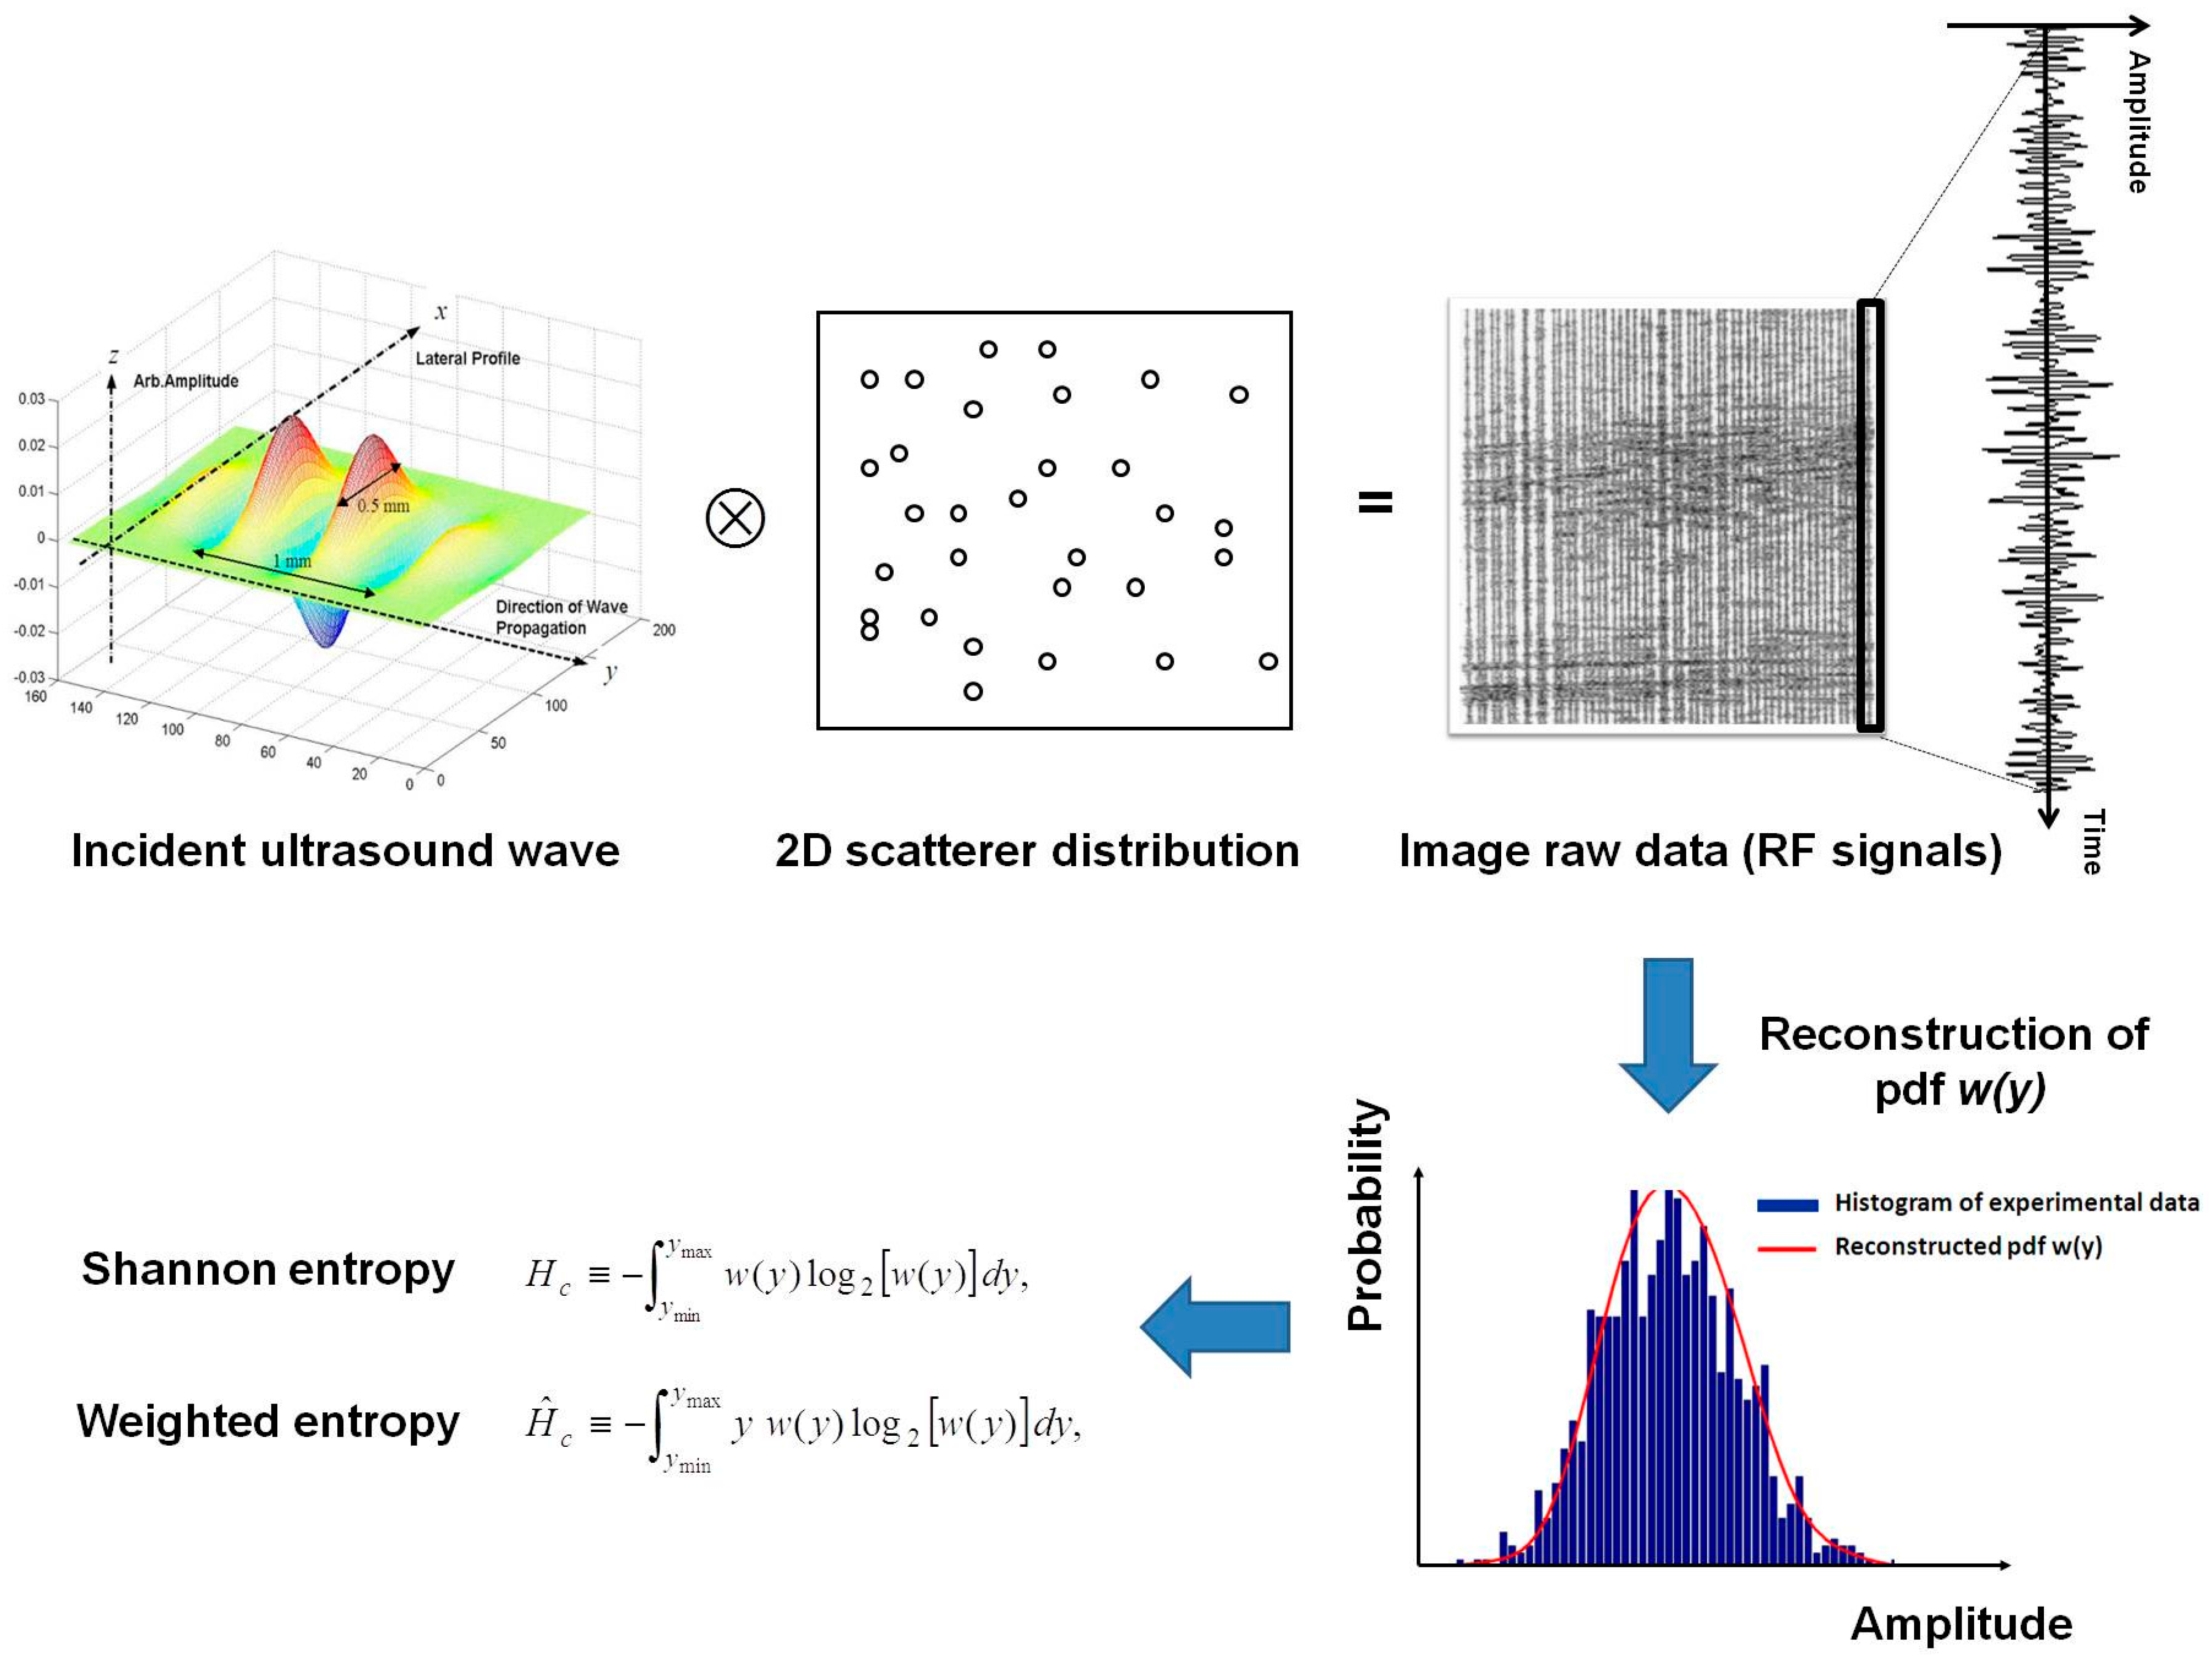
Figure 1 illustrates the simulation procedures for estimating entropy. At first, the image raw data are generated using the simulation model (as shown in Section 3.1). For each RF signal, the settings of Nco and Δy pairs are selected as computational parameters, and the Fourier coefficients an are calculated using the RF signal in Equation (8). Subsequently, the probability density function w(y) is reconstructed using the Fourier coefficients in Equation (7), and standard and weighted entropies are estimated using the estimated w(y) in Equations (1) and (2), respectively.
Figure 1.
Simulation procedures for estimating entropy. The image raw data are generated using the simulation model. Each radiofrequency (RF) signal in the raw image data is used to reconstruct the probability density function of w(y) for estimating the information entropy.
Figure 1.
Simulation procedures for estimating entropy. The image raw data are generated using the simulation model. Each radiofrequency (RF) signal in the raw image data is used to reconstruct the probability density function of w(y) for estimating the information entropy.

3.3. Selections of Parameters (Nco and Δy) for Estimating Weighted Entropy
To ensure a relatively robust estimation of the weighted entropy, determining an appropriate computational combination of Nco and Δy is imperative. First, the simulation model was used to generate RF signals with high (32 scatterers/mm2) and low (2 scatterers/mm2) scatterer concentrations. In total, 10 independent phantoms were simulated for each number density of scatterers (n = 20). The range of the scatterer concentration between 2 and 32 scatterers/mm2 indicates that the transducer resolution cell comprises approximately 2.96 to 47.36 scatterers, allowing the backscattered statistics to vary from a pre-Rayleigh (the number of scatterers <10) to a Rayleigh distribution (the typical behavior of the backscattered statistics in soft tissues, formed when the number of scatterers is more than 10) [41,42]. The RF signals were then used to reconstruct the probability density functions w(y) and estimate the weighted entropies; these procedures were conducted using different combinations of Nco and Δy under the conditions of high and low number densities of scatterers, respectively. In these processes, seven settings of Nco (0, 2, 4, 8, 16, 32, and 64) and four values of Δy (0.01, 0.02, 0.04, and 0.1) were applied to find out the minimum Nco and to explore the effect of Δy on the weighted entropy, respectively.
3.4. Performance Evaluation of Weighted Entropy
After determining the minimum Nco, we used the simulation model again to produce phantoms with various number densities of scatterers including 2, 4, 8, 16, and 32 scatterers/mm2 (the number of scatterers in the resolution cell ranged from 2.96 to 47.36). Ten independent phantoms were simulated for each number density of scatterers (totally n = 50). A total of 1000 scan lines of backscattered RF signals returned from each phantom were used to estimate the weighted entropies using various Δy. The conventional and weighted entropies were plotted as functions of the scatterer concentration for comparison. The SigmaPlot software (Version 9.0, Systat Software, Inc., San Jose, CA, USA) was used to calculate the probability value (i.e., p-value) obtained from the independent t-test for evaluating the significance of difference when comparing the results.
4. Results
4.1. Effects of Nco and Δy on the Reconstruction of w(y)
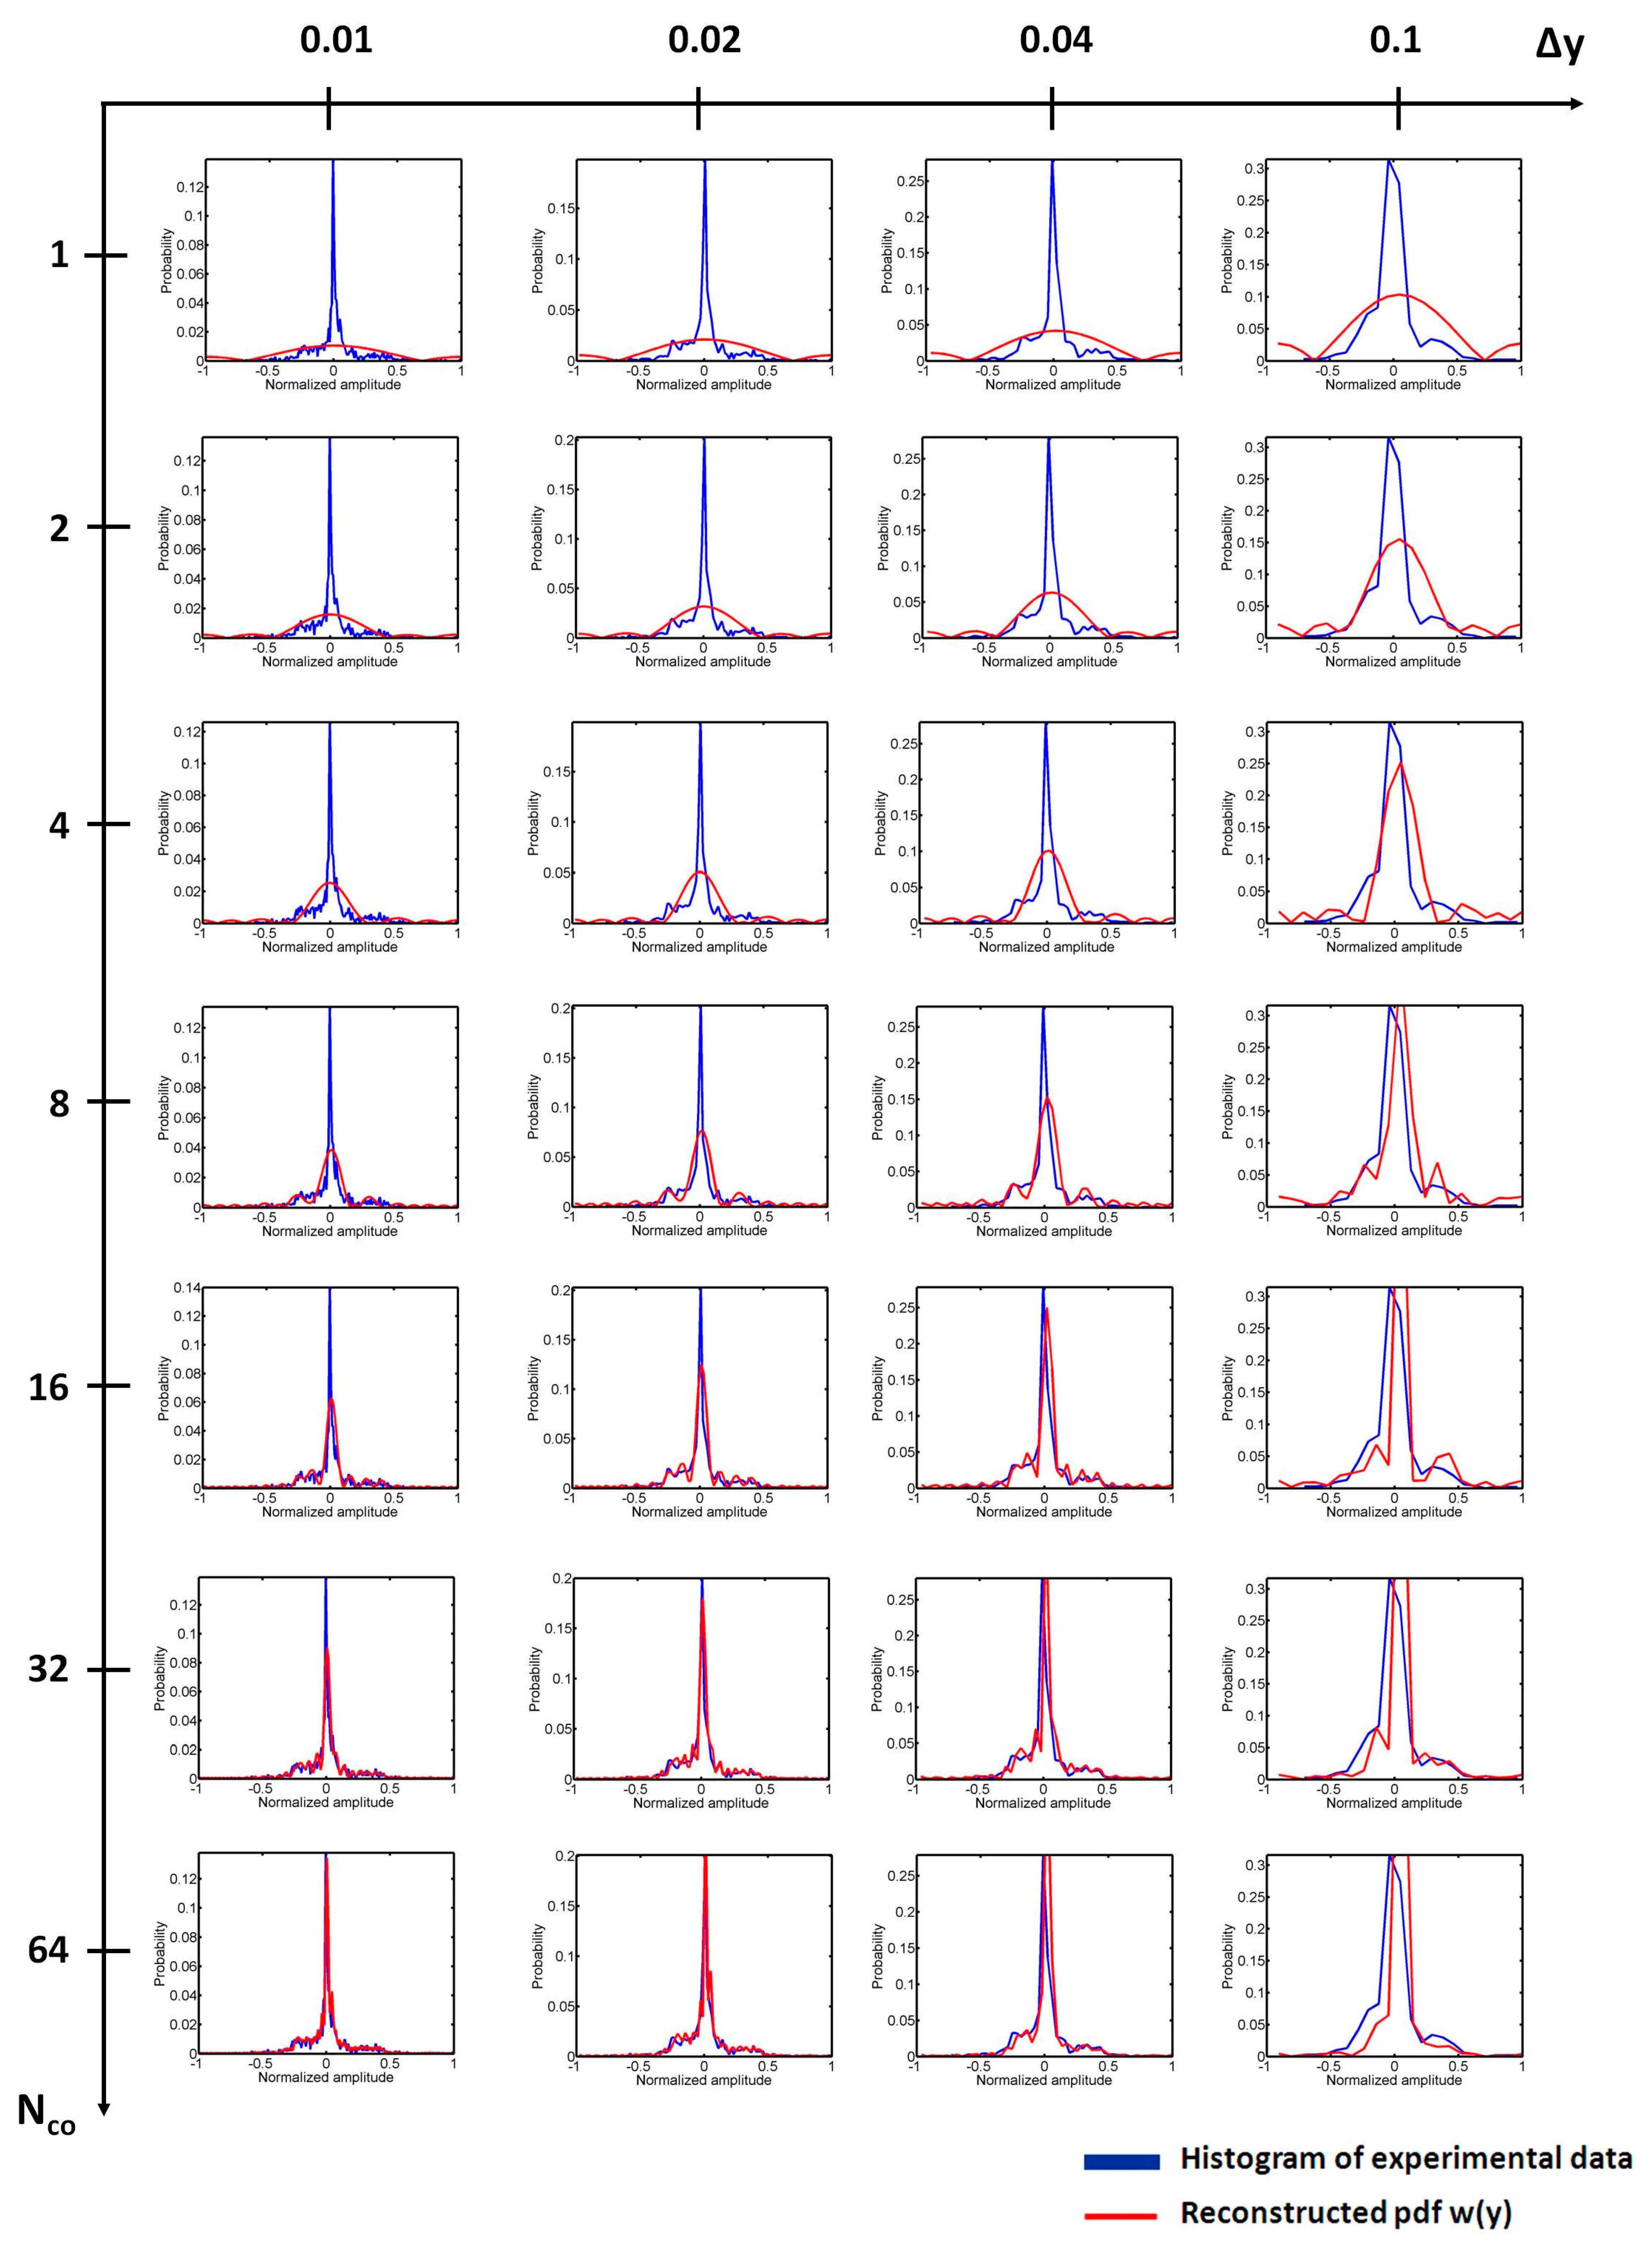
Figure 2 depicts the typical histograms of the simulated RF data obtained from a phantom with a high number density of scatterers (32 scatterers/mm2) and the corresponding probability density functions w(y) reconstructed at different settings of Nco and Δy. The settings of Nco and Δy considerably affected the formation of w(y); that is: (i) increasing the value of Δy resulted in fewer sample points for describing the shape of the signal distribution, resulting in a poor w(y) resolution and deformed w(y); and (ii) increasing the value Nco to ensure that the appropriate number of terms were used in the Fourier series enabled performing an approximation of w(y) that closely fitted the histogram of the backscattered RF signals. The dependency of w(y) on Nco and Δy was also observed under the condition of a low number density of scatterers (2 scatterers/mm2), as shown in Figure 3. The applied values of Nco and Δy influenced the estimation of information entropy, and a general criterion to obtain reliable entropy value should be based on using higher Nco and lower Δy values.
Figure 2.
Typical histograms of simulated RF data obtained from a phantom with a high number density of scatterers (32 scatterers/mm2) and the corresponding probability density functions w(y) of the signal amplitude y reconstructed at different settings of Nco and Δy.
Figure 2.
Typical histograms of simulated RF data obtained from a phantom with a high number density of scatterers (32 scatterers/mm2) and the corresponding probability density functions w(y) of the signal amplitude y reconstructed at different settings of Nco and Δy.
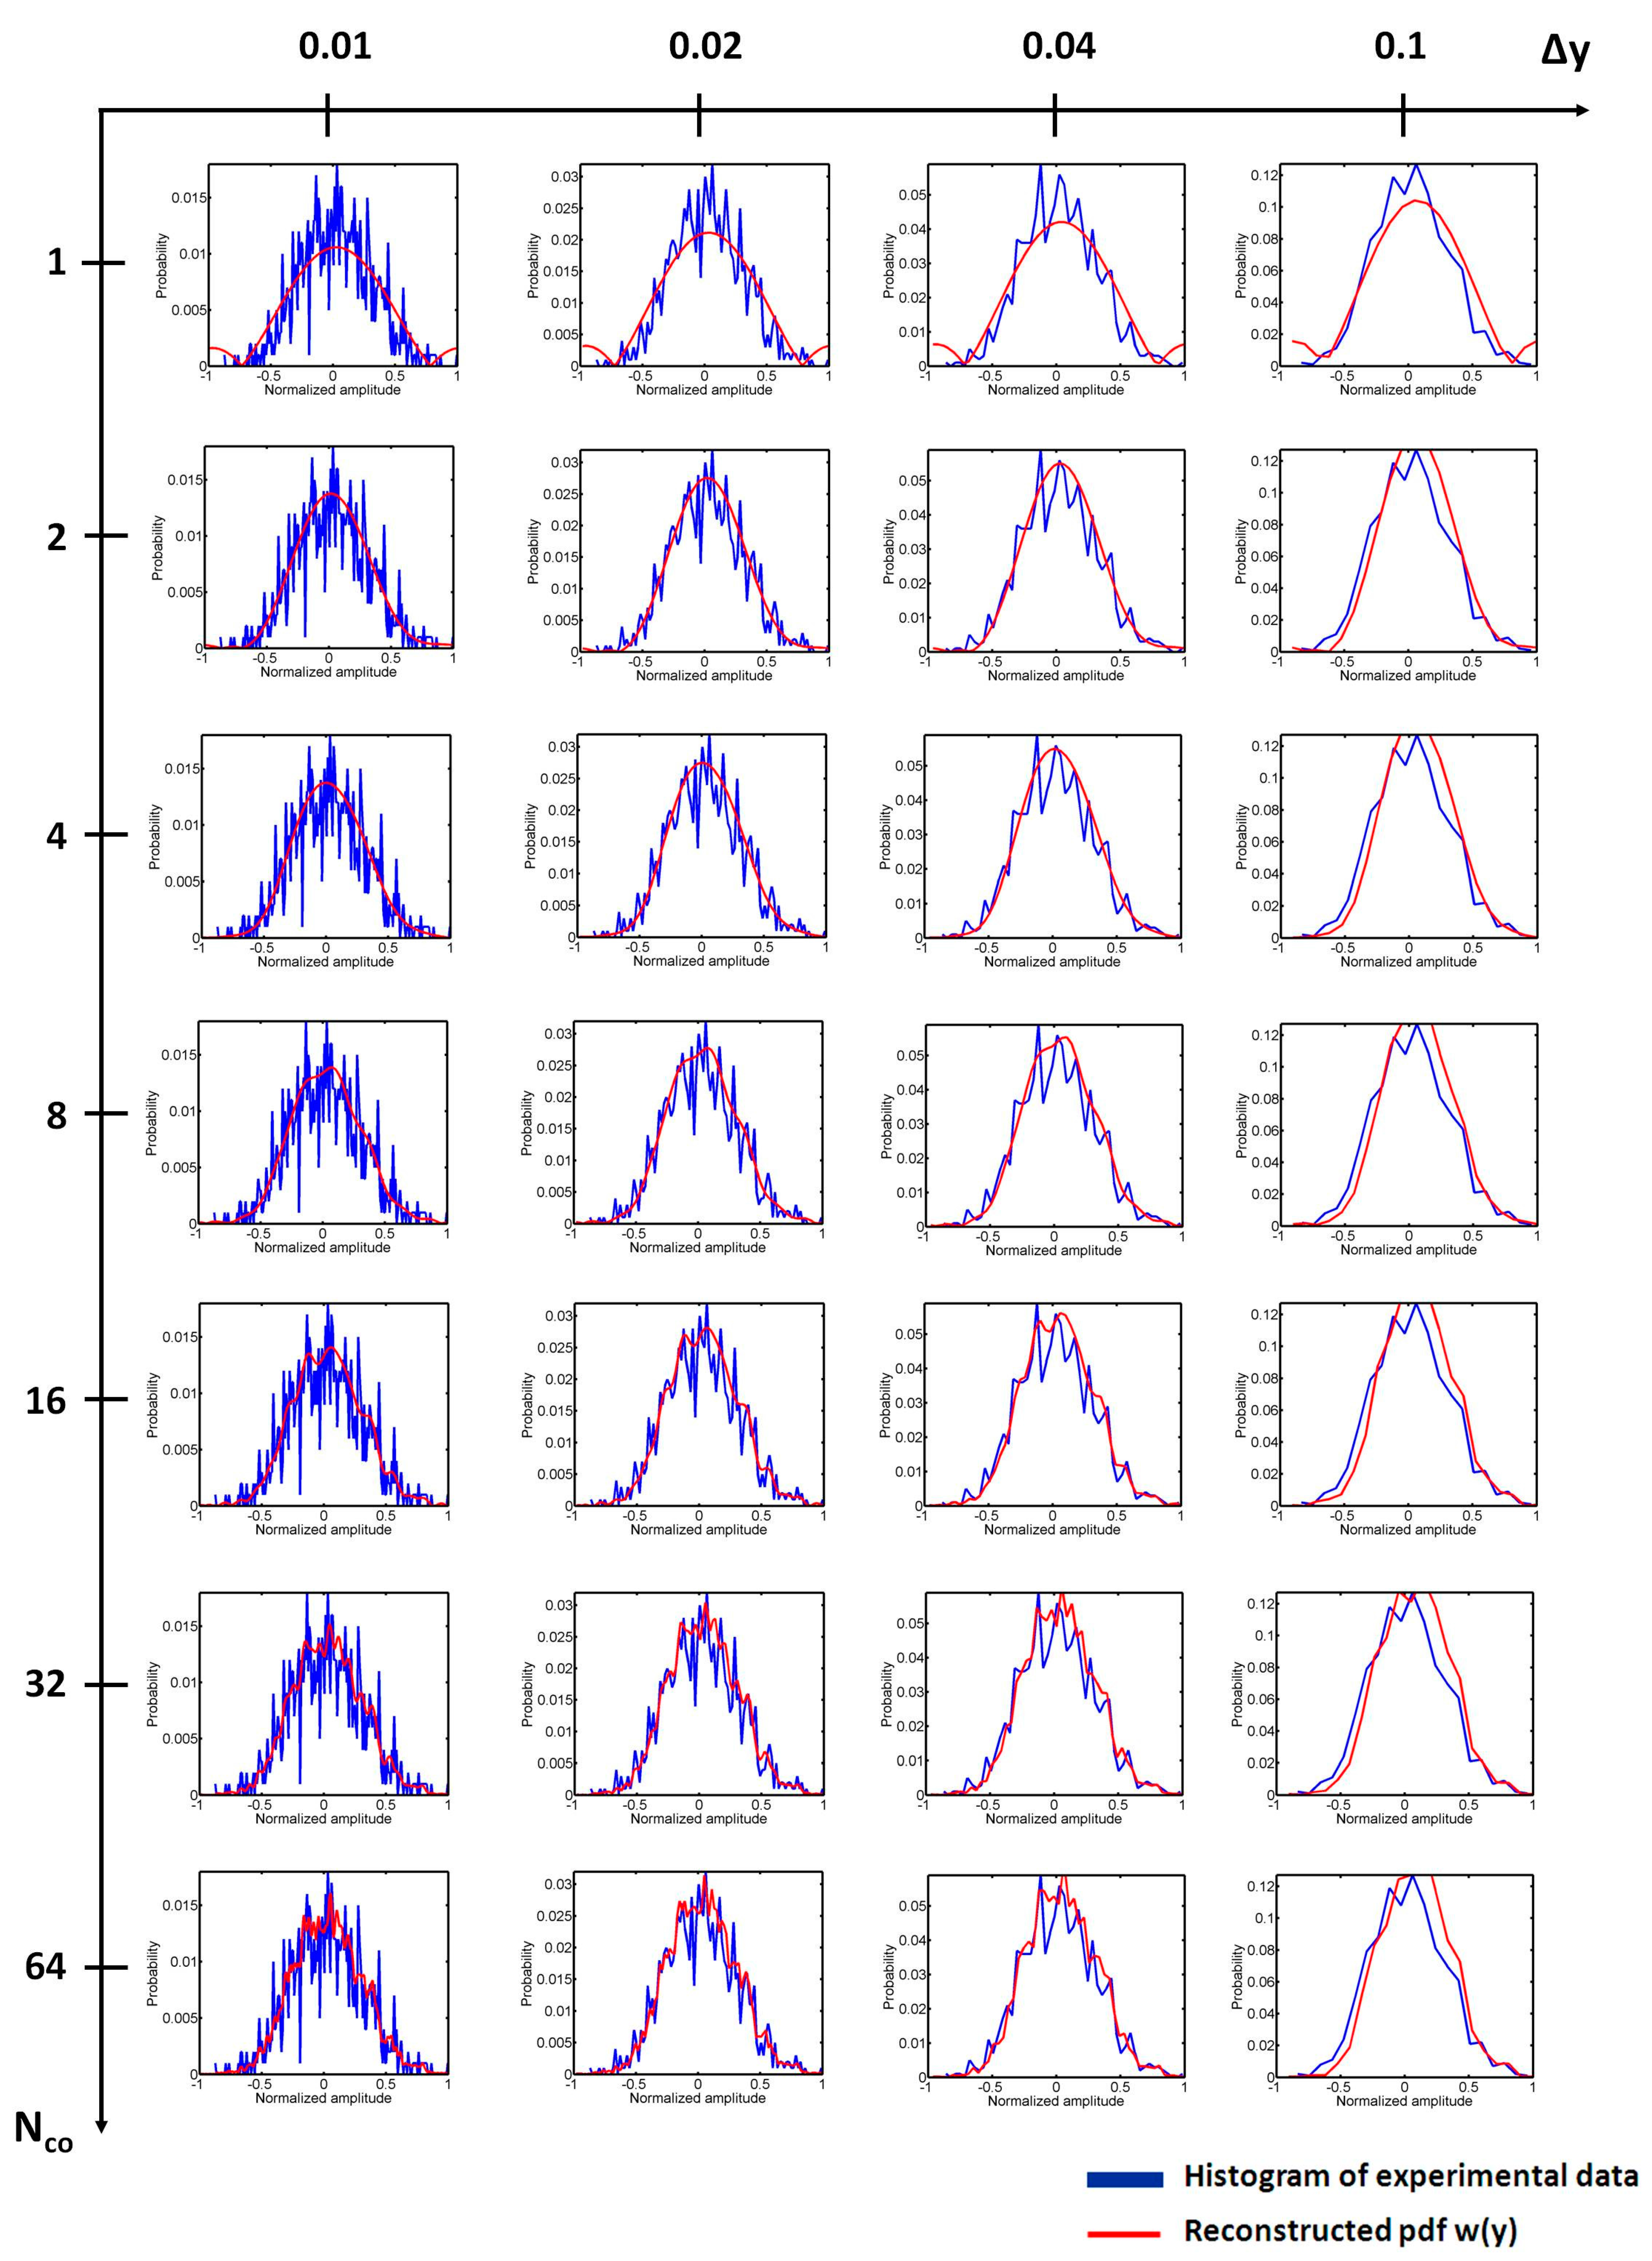
Figure 3.
Typical histograms of simulated RF data obtained from a phantom with a low number density of scatterers (2 scatterers/mm2) and the corresponding probability density functions w(y) of the signal amplitude y reconstructed at different settings of Nco and Δy.
Figure 3.
Typical histograms of simulated RF data obtained from a phantom with a low number density of scatterers (2 scatterers/mm2) and the corresponding probability density functions w(y) of the signal amplitude y reconstructed at different settings of Nco and Δy.
4.2. Determination of Nco
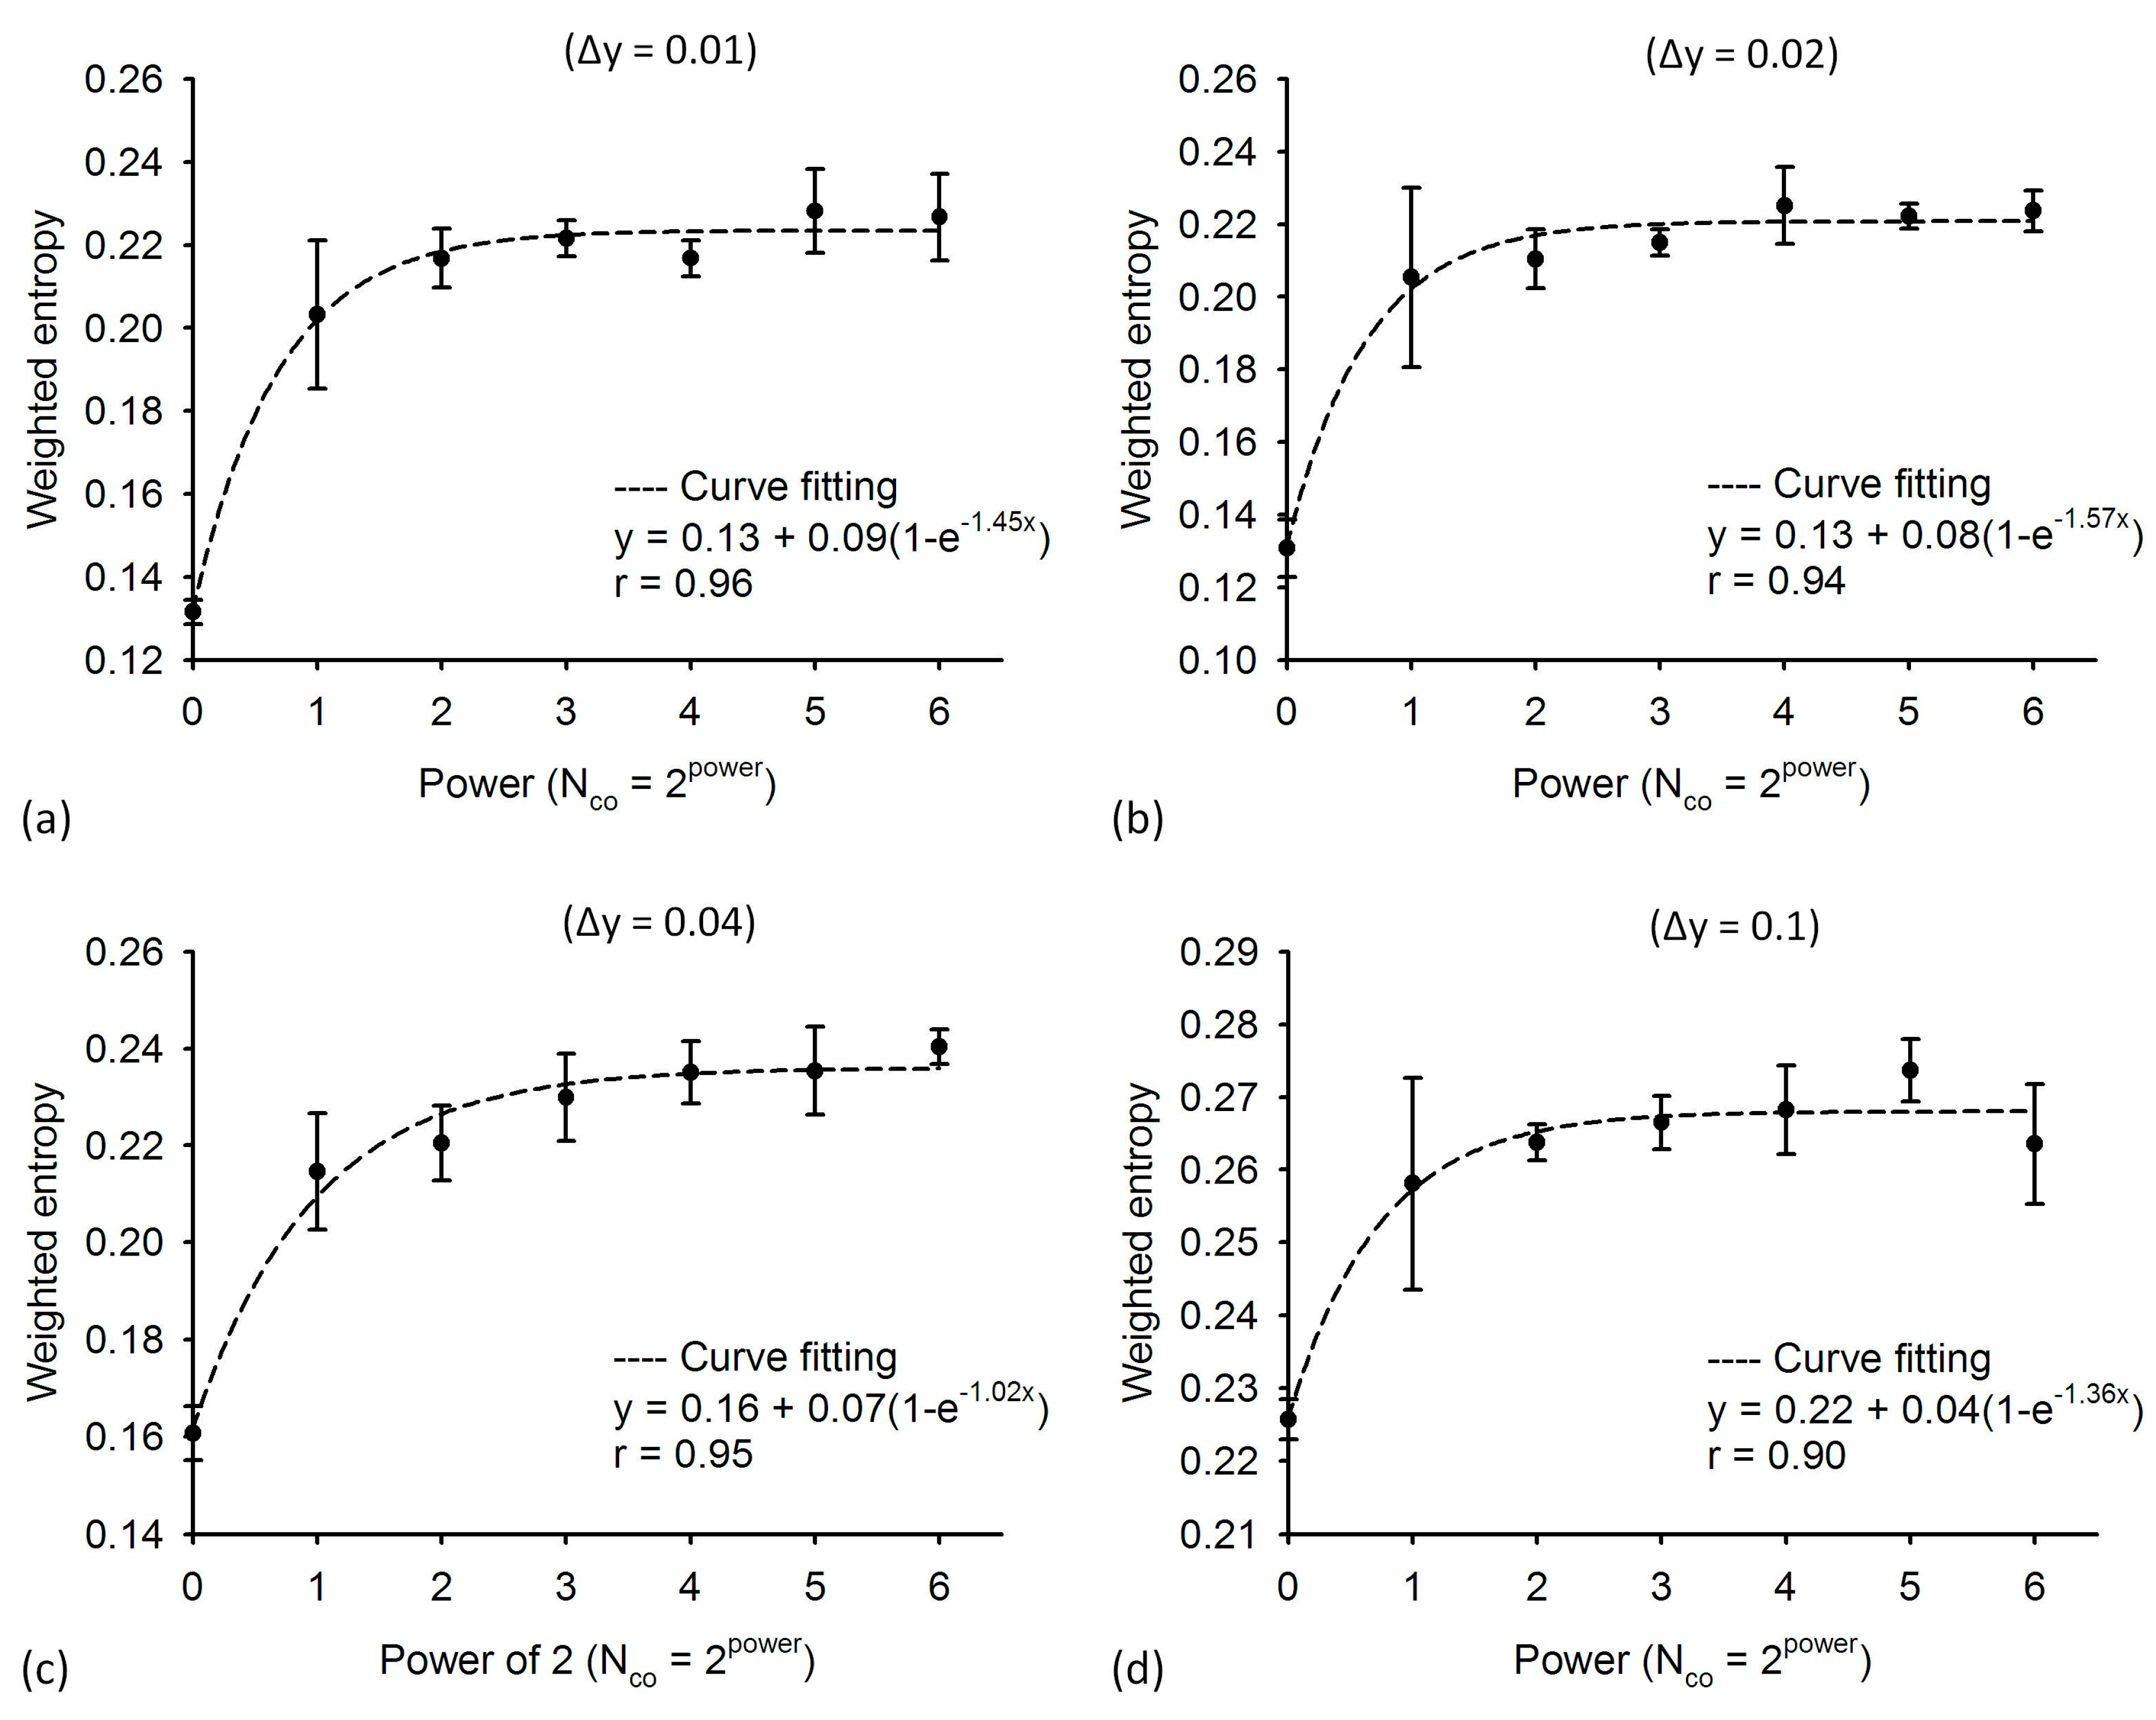
Figure 4 depicts the results of the weighted entropy as a function of Nco obtained using different values of Δy under the condition of a high number density of scatterers (32 scatterers/mm2). For Δy = (0.01, 0.02, 0.04, 0.1), the corresponding weighted entropy increased gradually from (0.13, 0.13, 0.16, 0.22) to (0.22, 0.21, 0.23, 0.26) with increasing Nco from 1 to 64. An exponential increasing function in the form of y = y0 + a(1 − e−bx) was used to describe the relationship between the weighted entropy and Nco. The curve fitting suggested that the weighted entropy increased with increasing the value of Nco and gradually became stable (the values corresponding to the plateau of the fitting curve remained unvaried) when the value of Nco ≧ 32.
Figure 4.
Results of weighted entropy as a function of Nco that were obtained using different values of Δy under the condition of a high number density of scatterers (32 scatterers/mm2).
Figure 4.
Results of weighted entropy as a function of Nco that were obtained using different values of Δy under the condition of a high number density of scatterers (32 scatterers/mm2).

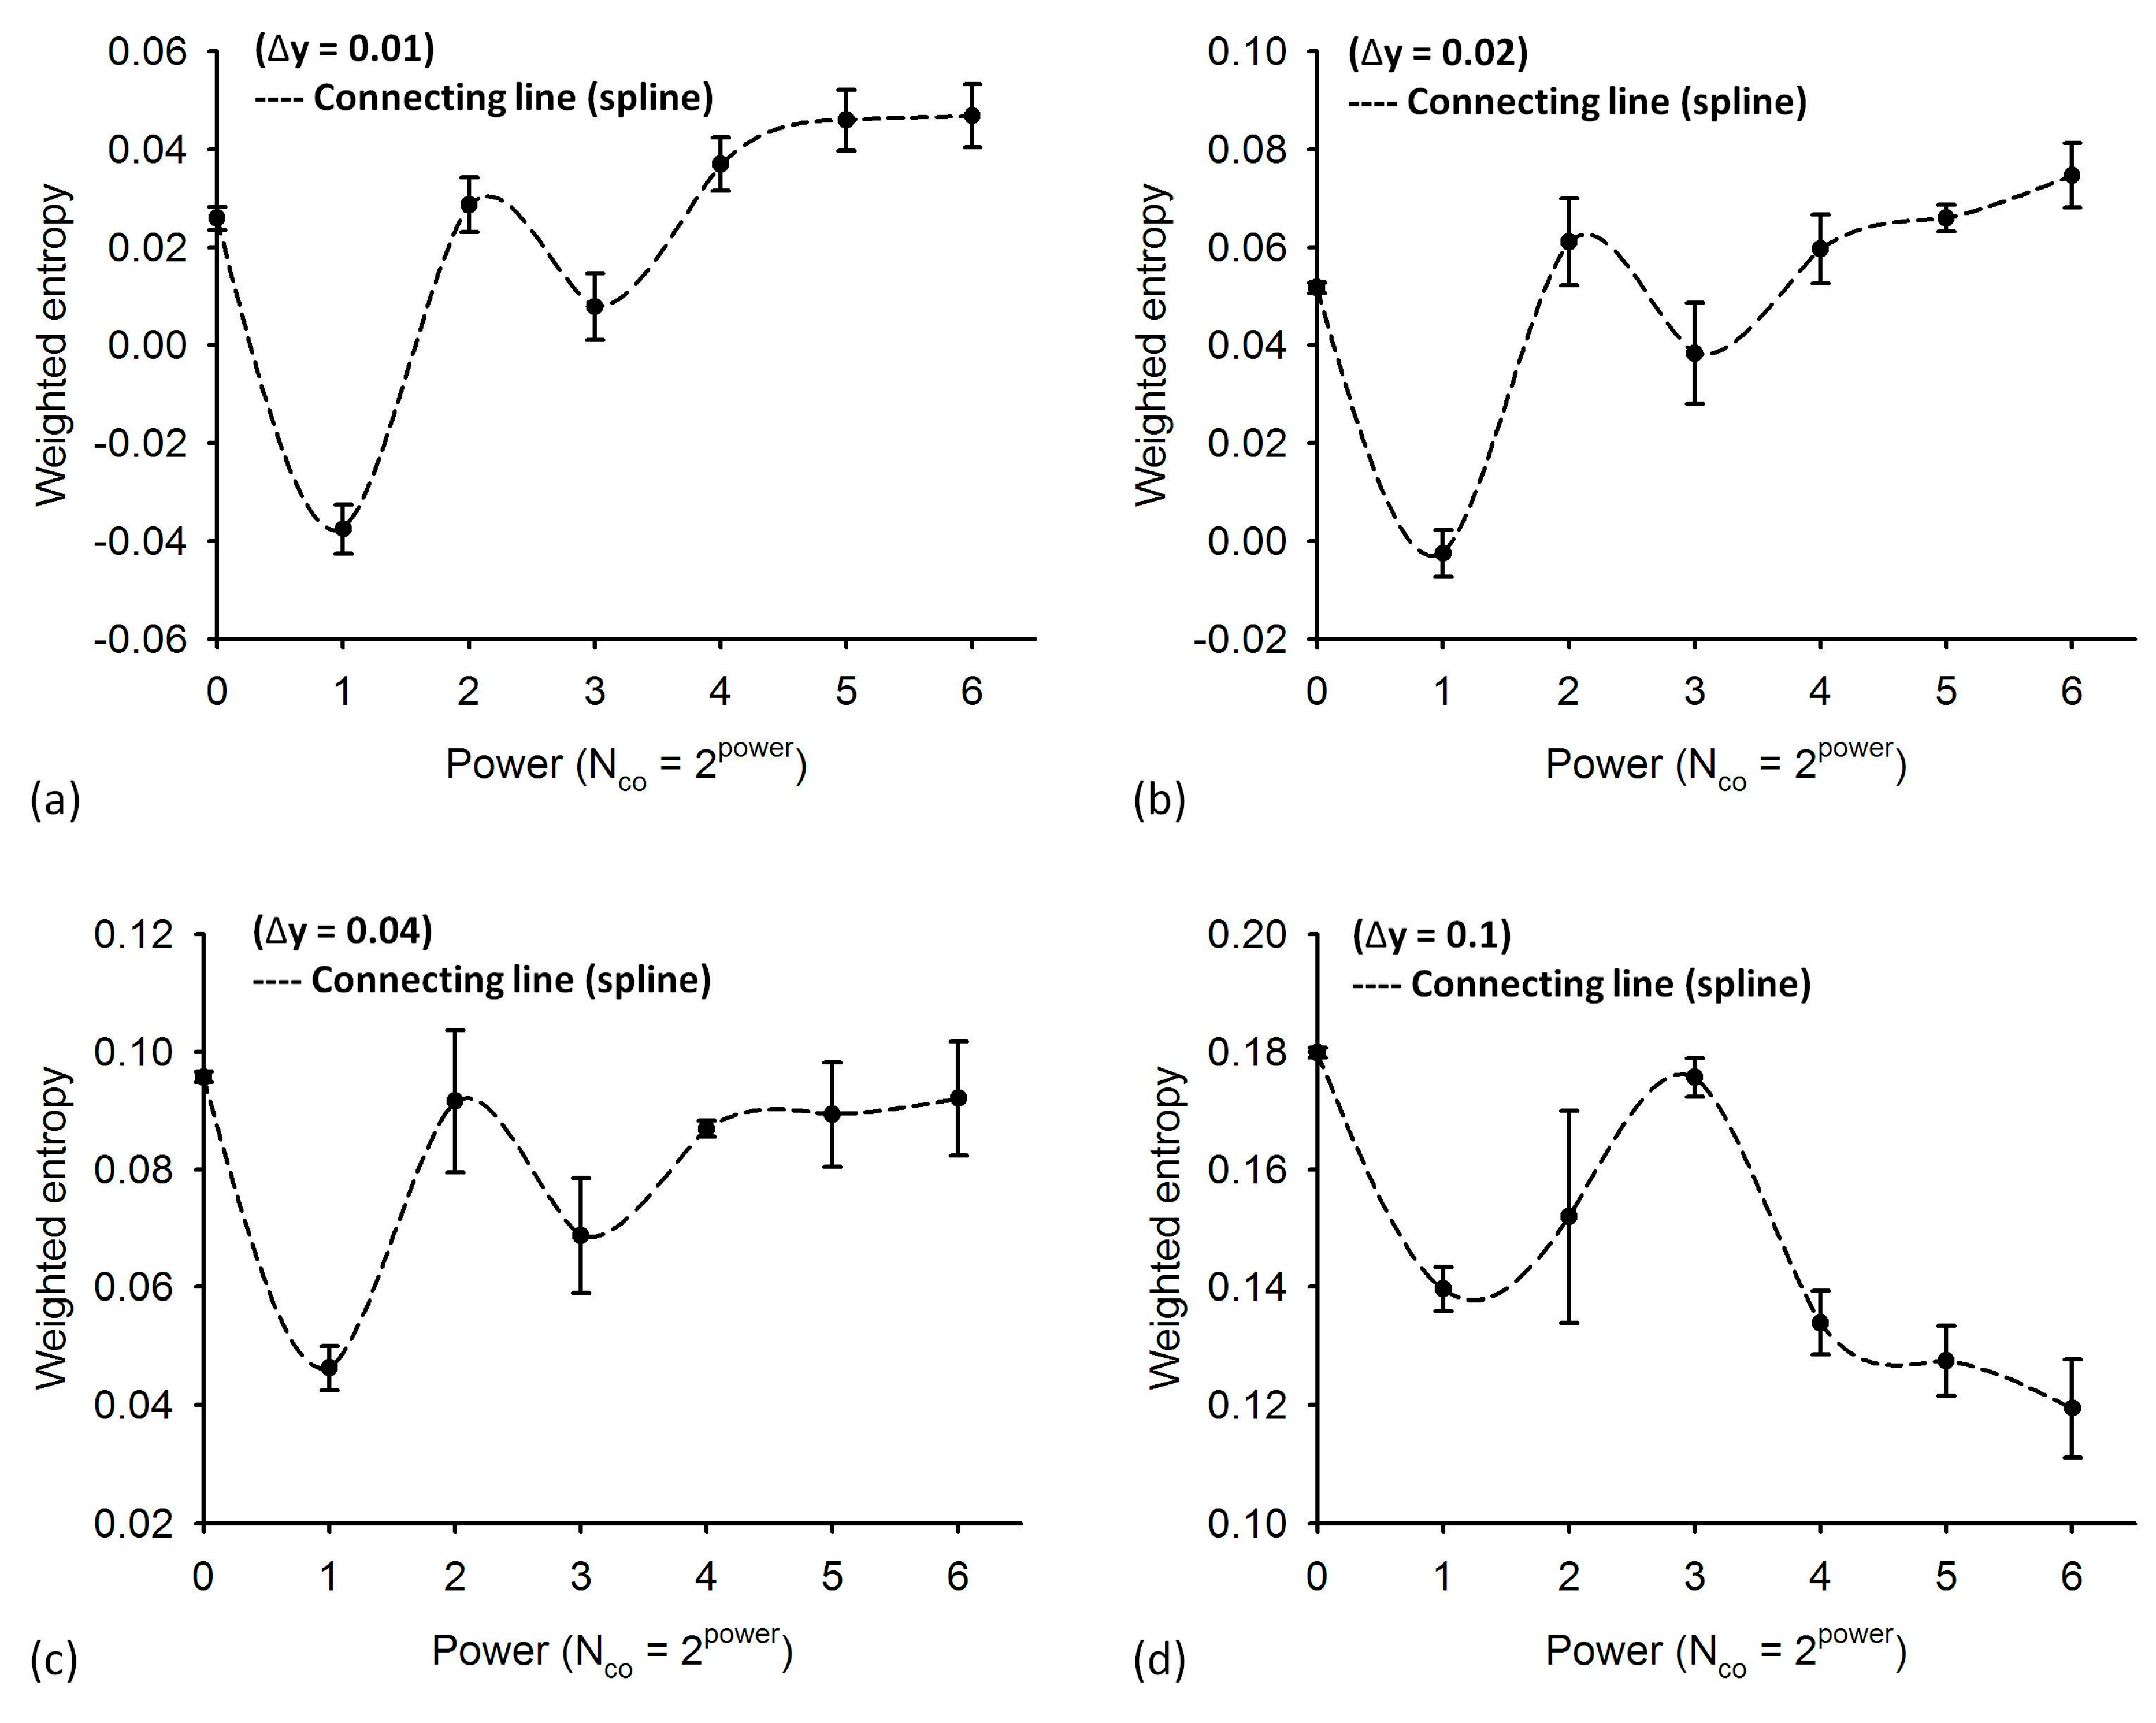
Figure 5 shows the weighted entropies as a function of Nco obtained using different values of Δy under the condition of a low number density of scatterers (2 scatterers/mm2). For the results measured from a medium with a low scatterer concentration, no appropriate fitting equations can be applied for describing the relationship between the weighted entropy and Nco. However, the weighted entropy fluctuated when the value of Nco was between 1 and 16 and then started to vary in a limited range when the value of Nco was greater than 32. Comparing the results illustrated in Figure 4 and Figure 5, we suggest using Nco = 32 to obtain a relatively stable weighted entropy.
Figure 5.
Results of weighted entropy as a function of Nco that were obtained using different values of Δy under the condition of a low number density of scatterers (2 scatterers/mm2).
Figure 5.
Results of weighted entropy as a function of Nco that were obtained using different values of Δy under the condition of a low number density of scatterers (2 scatterers/mm2).

4.3. Determination of Δy
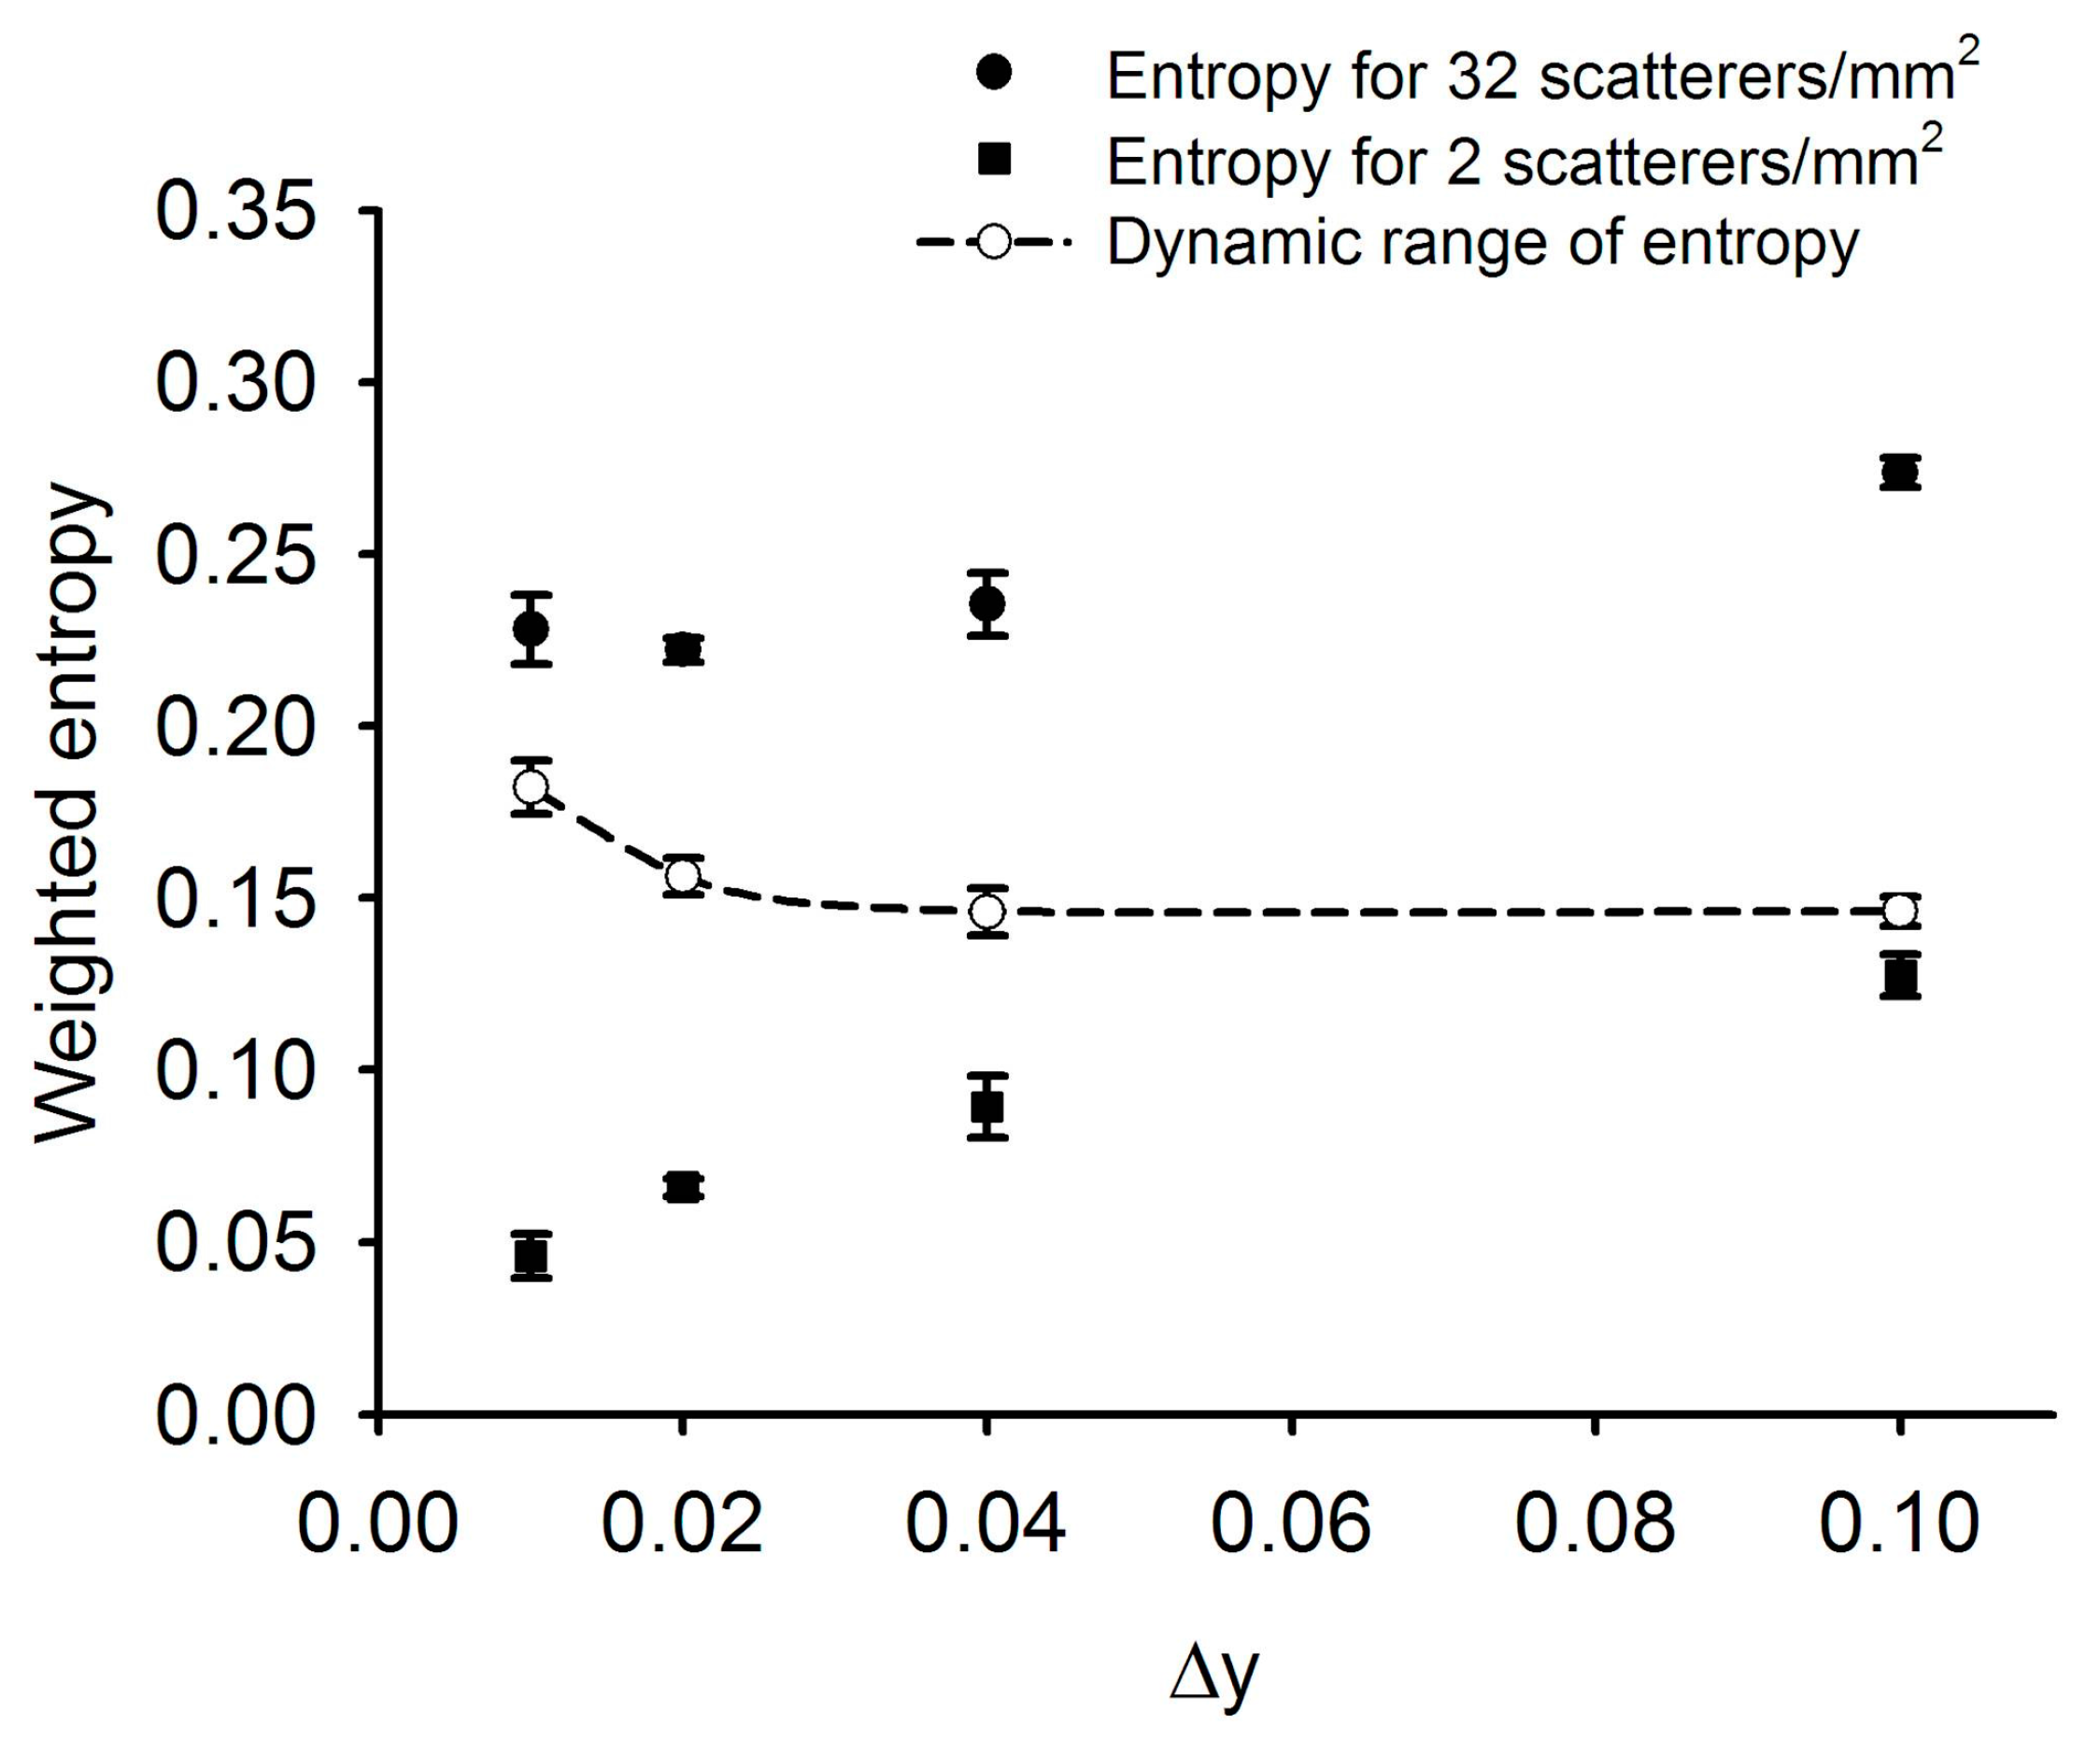
Figure 6 illustrates the weighted entropies (estimated using Nco = 32) as a function of Δy for the phantoms with high and low number densities of scatterers, respectively. When the value of Δy was increased from 0.01 to 0.1, the weighted entropy increased from 0.22 to 0.27 and from 0.04 to 0.12 for 32 and 2 scatterers/mm2, respectively. Because information entropy is always dependent on the value of Δy, determining an appropriate value of Δy is difficult. Alternatively, we confirmed whether the dynamic ranges of the weighted entropy, defined as the difference in weighted entropy between minimum and maximum scatterer concentrations, produced using different values of Δy are adequately high to effectively reflect the variation in the scatterer concentration (see the dashed line in Figure 6). When Δy = 0.01, the maximum dynamic range of the weighted entropy was 0.18. With increasing Δy to 0.1, the dynamic range of the weighted entropy slightly decreased to 0.14. It was found that adjusting Δy did not largely alter the dynamic range of the weighted entropy. However, we did not consider Δy = 0.1 because it is difficult to use this value for providing detailed information on the shape of the probability density function according to the results illustrated in Figure 2 and Figure 3. In practice, we suggest using Δy = 0.04 for estimating the weighted entropy because of lower computational loadings.
Figure 6.
Weighted entropies (estimated using Nco = 32) as a function of Δy for phantoms with high (32 scatterers/mm2) and low number (2 scatterers/mm2) densities of scatterers, respectively. The dashed line indicates the dynamic ranges of the weighted entropy, defined as the difference in the weighted entropy between minimum and maximum scatterer concentrations.
4.4. Weighted Entropy as a Function of Number Density of Scatterers
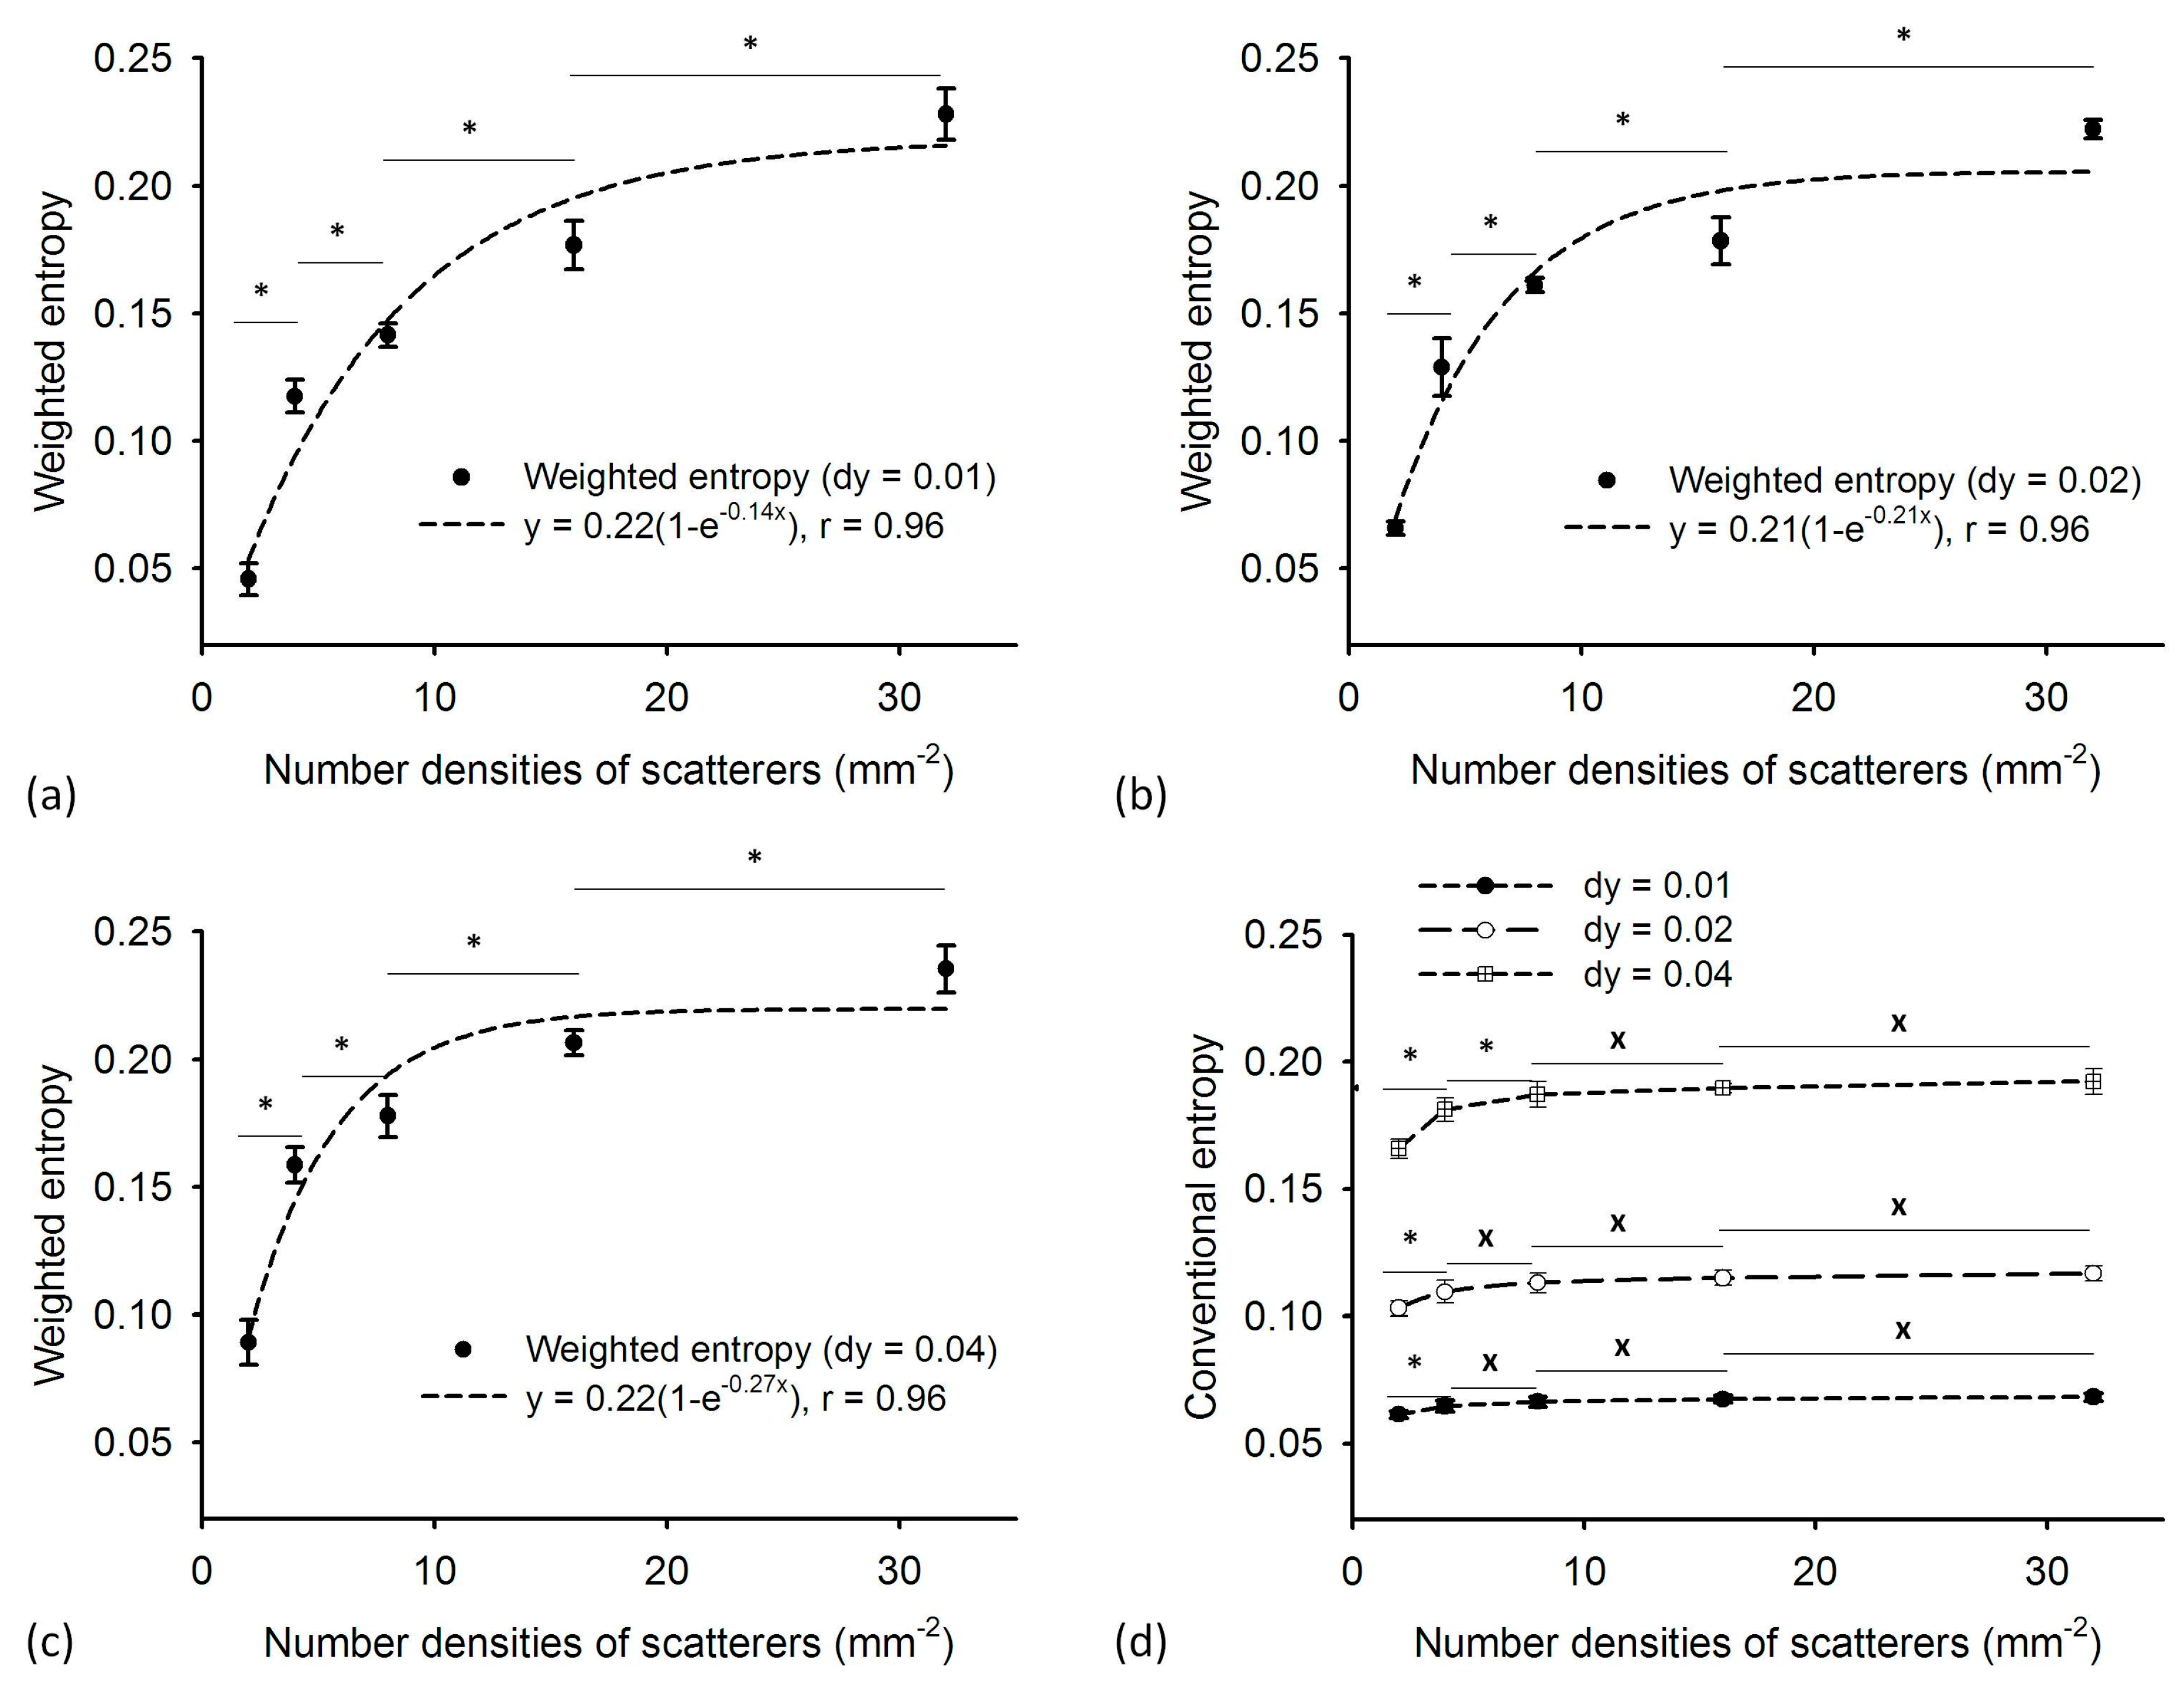
Figure 7a–c depicts the weighted entropies as a function of the number density of scatterers obtained using Nco = 32 and different values of Δy (0.01, 0.02, 0.04). When the value of Δy was 0.01, the weighted entropy increased from 0.04 to 0.22, corresponding to an increase in the number density of scatterers from 2 to 32 scatterers/mm2 (the dynamic range D was 0.18). The weighted entropy increased from 0.06 to 0.22 (D = 0.16) and from 0.08 to 0.23 (D = 0.15) in the same range of scatterer concentration when Δy = 0.02 and 0.04, respectively. In particular, the p-values between each number density of scatterers were smaller than 0.05 (indicated by the symbol “*”), representing the significant difference in the weighted entropy.
To confirm the improvement of sensitivity by weighted entropy, the same algorithmic settings (Nco = 32 and Δy = 0.01, 0.02, and 0.04) were used to estimate the conventional entropy as a function of the scatterer concentration (Figure 7d). When Δy = 0.02 and 0.04, the conventional entropies varied by approximately 0.01 and 0.06, respectively. Using Δy = 0.01, the conventional entropy slightly increased from 0.16 to 0.19. Note that the p-values obtained between 8 and 32 scatterers/mm2 were larger than 0.05 (denoted by the symbol “x”), indicating the difficulty of using the conventional entropy in scatterer characterization. Compared with the conventional entropy, the weighted entropy has a larger dynamic range (approximately 5-fold enhancement) and a significant difference between each number density of scatterers (p-value < 0.05), representing an improved performance in detecting scatterer concentrations.
Figure 7.
(a)–(c) Weighted entropies as a function of the number density of scatterers that were obtained using Nco = 32 and different values of Δy (0.01, 0.02, 0.04). (d) Conventional entropies (Nco = 32 and Δy = 0.01, 0.02, and 0.04) as a function of the scatterer concentration (the symbols “*”: p-value < 0.05; the symbols “x”: p-value > 0.05).
5. Discussion
5.1. Significance of This Study
This study has clarified how we improve the performance of ultrasound entropy with weighting technique. First, by using a standard simulation method, we have preliminarily generalize an appropriate parameter combination for measuring the weighted entropy (Nco = 32; Δy = 0.04). Second, we demonstrated that using signal amplitude as weighted factors endows the Shannon entropy with an improved sensitivity in detecting the number density of scatterers in a scattering medium. This study pioneers in applying the weighted entropy to the uncertainty analysis of ultrasound backscattered signals.
5.2. Explanations on the Sensitivity Enhancement by Weighted Entropy
The sensitivity of the conventional entropy in ultrasound scatterer characterization is limited due to the lack of an overall and detailed consideration on information sources for the conventional entropy. More considerations should be involved to define workable entropy for ultrasound backscattering analysis. Recall that an increase in the number density of scatterers simultaneously alters both the probability distribution of the signal and signal amplitude. In the proposed weighted entropy, the relevance of signal amplitude in information interpretation is reconsidered. During information entropy estimation, using the amplitude values of RF data as weight factors result in different effects on the probability density functions of small and large signals, respectively. According to the definition of the proposed weighted entropy by Equation (2), amplitude weighting reduces the values of probabilities of small signals. Meanwhile, it amplifies the probability values of large signals. Because the flatness (or peakness) of signal distribution depends on the number density of scatterers (as shown in Figure 2 and Figure 3), it can be expected that amplitude weighting further enlarges the difference of flatness (or peakness) of the probability density function between low and high scatterer concentrations. Under this condition, the dynamic range of the information entropy between low and high scatterer concentrations increases, thus boosting the sensitivity in the detection of scatterer properties.
5.3. Relationship Between Distribution Parameter and Weighted Entropy
It is interesting to compare the weighted entropy with the Nakagami distribution parameter, which has been reported to highly depend on the structures of scatterers in a scattering medium [1,41,43,44]. In a previous study [41], simulations with the same signal model and settings were performed to show that the Nakagami parameter increases from 0.45 to 0.95 with increasing the number densities of scatterers from 2 to 16 scatterers/mm2. In the same range of scatterer concentration, we found that the weighted entropy increases from 0.08 to 0.2 (Nco = 32 and Δy = 0.04). The Nakagami parameter is a unitless shape parameter of the Nakagami distribution, which is general enough to model the envelope statistics [13]. The Nakagami parameter ranging from 0 to 1 means that the envelope statistics change from a pre-Rayleigh to a Rayleigh distribution, and the statistics of the backscattered signal conform to post-Rayleigh distributions when the Nakagami parameter is larger than 1 [41,43]. The above-mentioned discussion implies that the weighted entropy is proportional to the Nakagami parameter and correlates with the backscattered statistics.
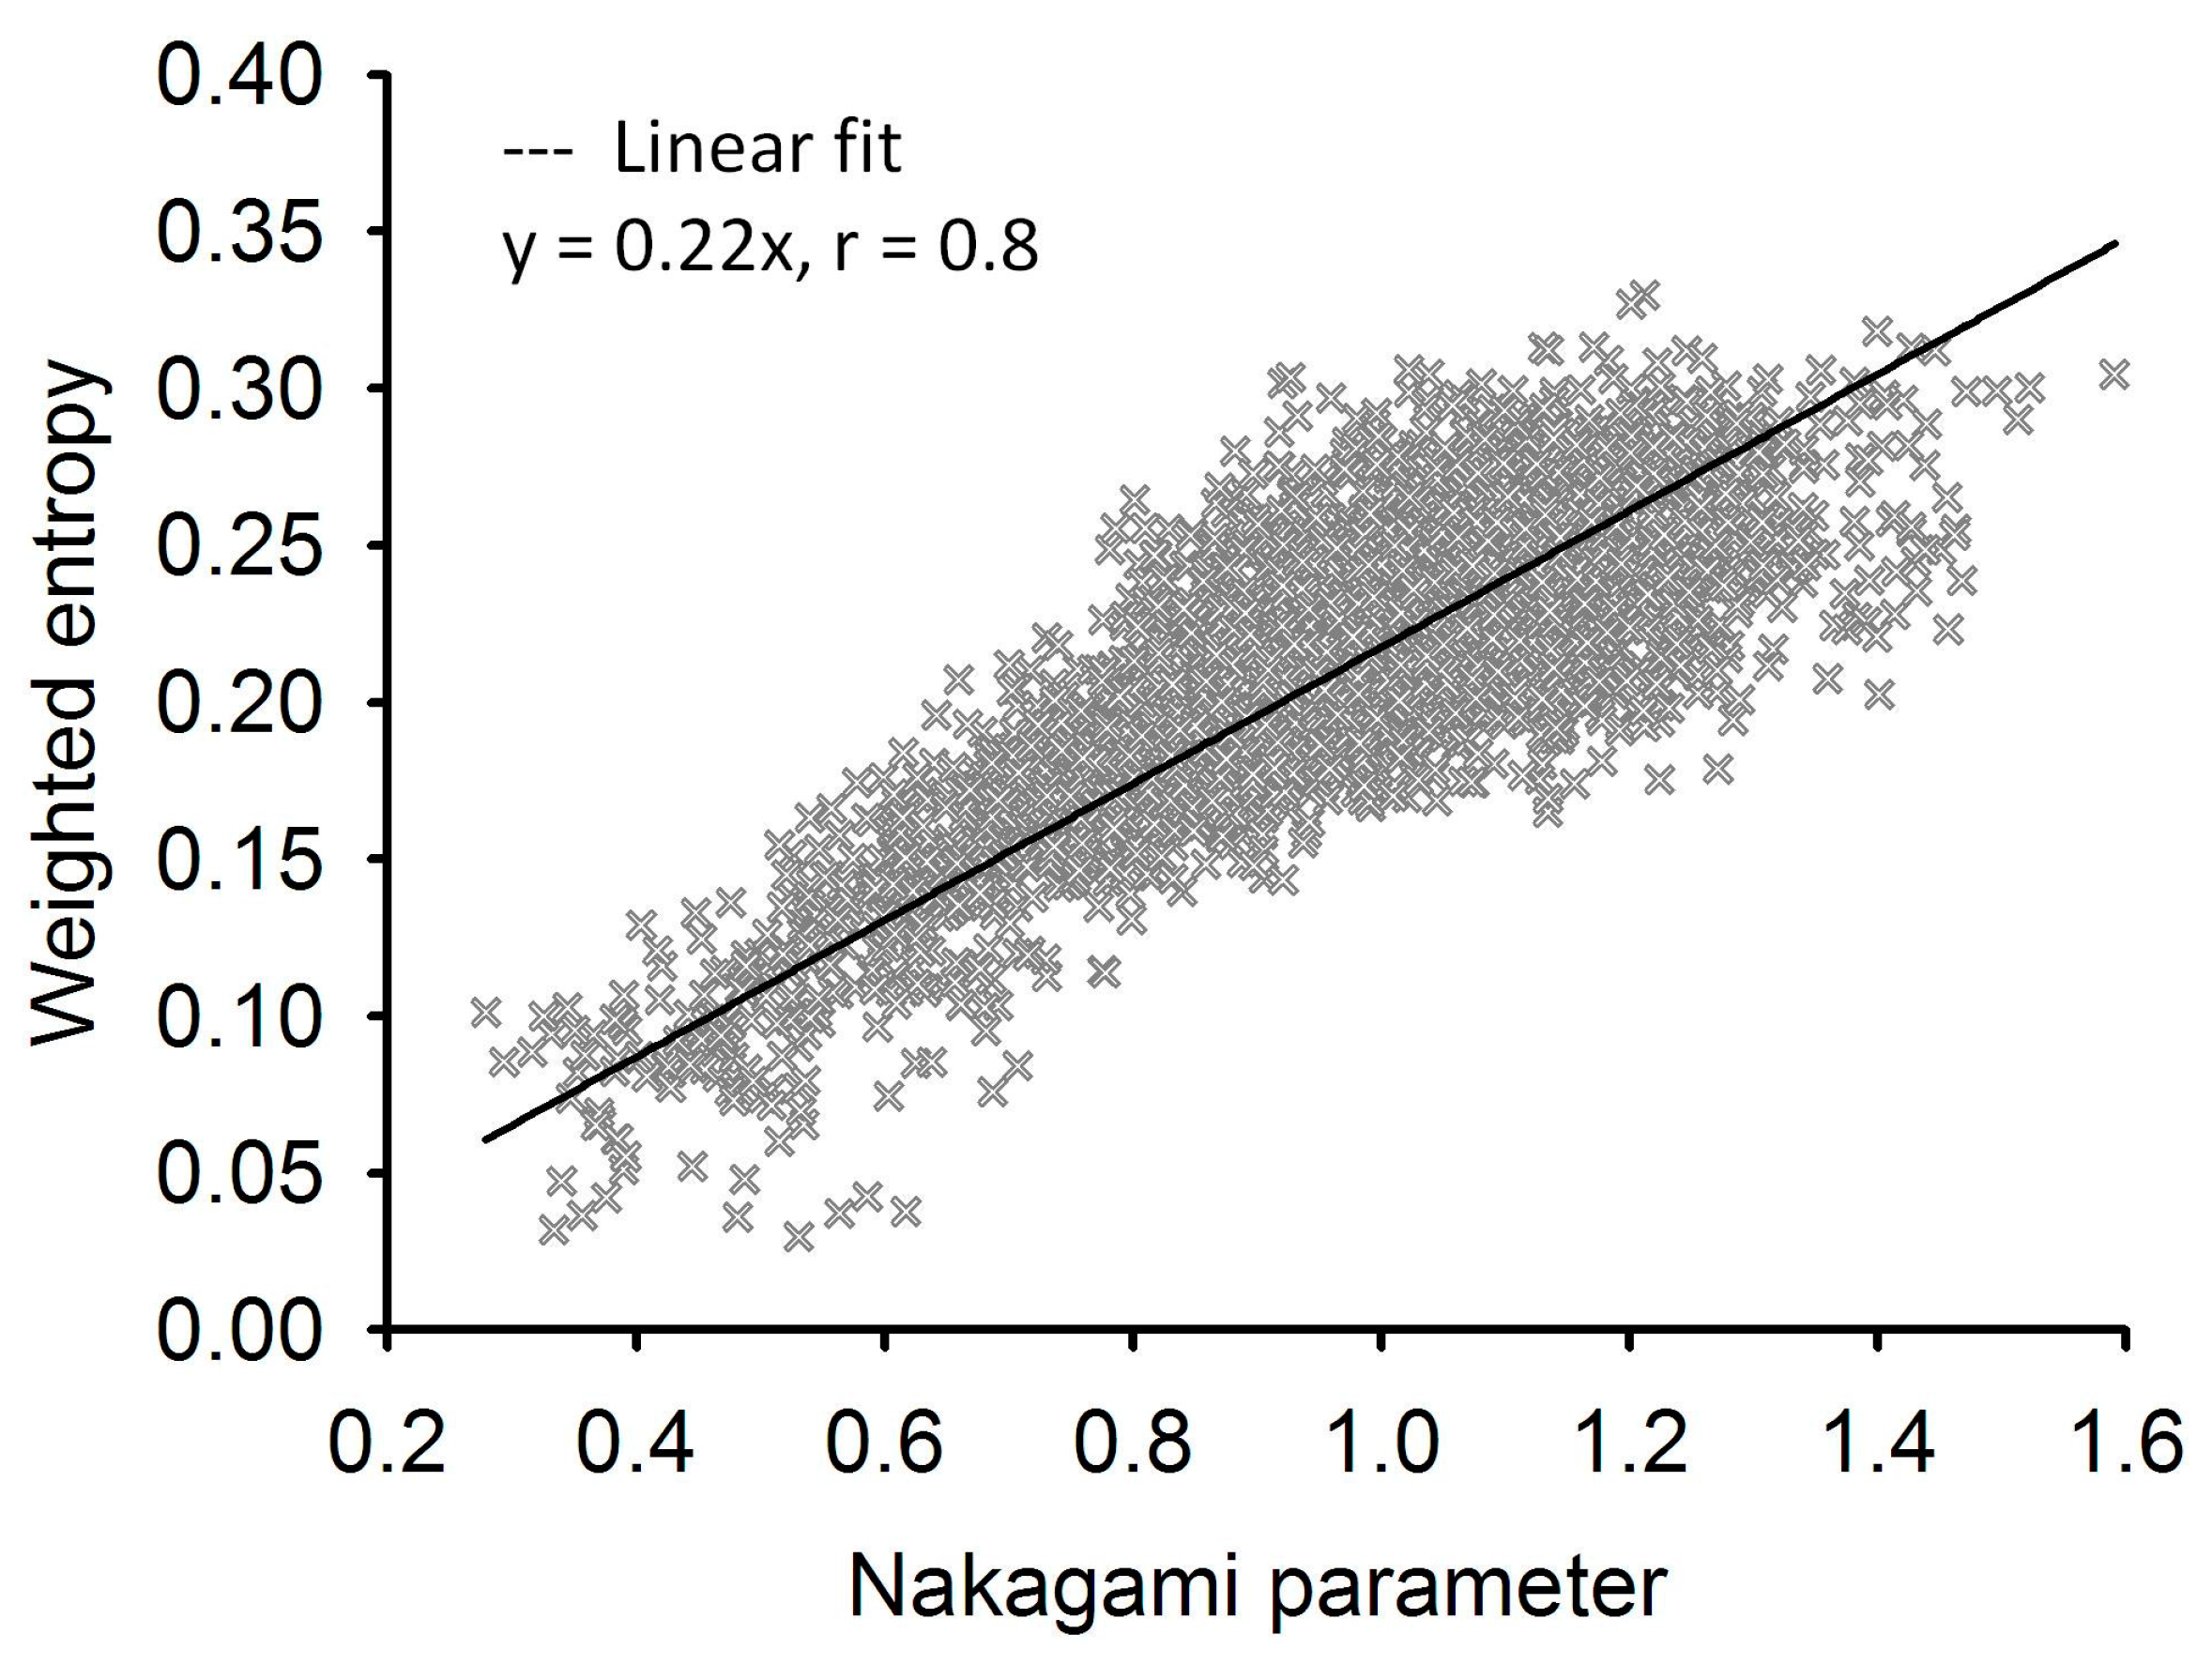
In order to confirm this assumption, here we performed an additional test for discussion. The same simulation model and settings were used to generate backscattered signals with the number densities of scatterers varying from 2 to 32 scatterers/mm2 at an increment of 1 scatterer/mm2 for estimating the weighted entropy (Nco = 32; Δy = 0.04) and the Nakagami parameter (please see [13] for the estimator of the Nakagami parameter). For each number density of scatterers, 100 simulations were repeated to generate a total of more than 3000 simulation data. Indeed, the locations of the simulated scatterers are randomly assigned; however, local clustering or periodically located scatterers corresponding to the Nakagami parameters >1 may occur when repeating the simulations using a high number density of scatterers [45]. As shown in Figure 8, the weighted entropy increased from approximately 0.05 to 0.3 when the Nakagami parameter increased from 0.3 to 1.4; this corresponds to a linear relationship in the form of y = ax (the correlation coefficient r = 0.8). Evidently, the weighted entropy increases with the change in the envelope statistics from pre-Rayleigh to post-Rayleigh distributions.
5.4. Biophysical Meanings of the Weighted Entropy and Future Work
The ultrasound weighted entropy has great potential in future applications of tissue characterization. Unclear physical meanings of the proposed weighted entropy may result in ambiguous interpretations of tissue properties. Thus, we briefly reviewed the relationship between the envelope statistics and the microstructures of scatterers to understand how the weighted entropy varies with tissue structures.
Figure 8.
Weighted entropy (estimated using Nco = 32 and Δy = 0.04) as a function of the Nakagami parameter. The change in the envelope statistics from pre-Rayleigh to post-Rayleigh distributions leads to an increase in the weighted entropy (i.e., the increase in the information uncertainty).
Figure 8.
Weighted entropy (estimated using Nco = 32 and Δy = 0.04) as a function of the Nakagami parameter. The change in the envelope statistics from pre-Rayleigh to post-Rayleigh distributions leads to an increase in the weighted entropy (i.e., the increase in the information uncertainty).

In general, three types of the backscattered statistics are caused by different microstructures [41,44]: (i) Rayleigh distribution caused by a large number of randomly distributed scatterers in the resolution cell of the transducer; (ii) pre-Rayleigh distribution (with a phase lead compared with Rayleigh statistics) due to low scatterer concentration or scatterers in the resolution cell having randomly varying scattering cross-sections with a comparatively high degree of variance; (iii) post-Rayleigh distribution (with a phase lag compared with Rayleigh) caused by a resolution cell containing periodically located scatterers in addition to randomly distributed scatterers. As demonstrated by Figure 8, with the change in the envelope statistics from a pre-Rayleigh to a post-Rayleigh distribution, the uncertainty of RF signals increases to make the weighted entropy increase. Therefore, an increase in the weighted entropy represents a change in the properties of tissue microstructure from relatively regular or simple (low scatterer concentration or varying scattering cross-sections of scatterers), random (many randomly located scatterers), to complex (a mixture of periodically located scatterers and random status). Such a physical link between the weighted entropy and the tissue microstructure is clinically meaningful and applicable. However, it should be noted that the envelope statistics depend on several factors, such as frequency [18], transducer focusing [33], noise interference [40,46], and acoustic attenuation [42]. The properties of the backscattered signals are also affected by the types of scatterers [41], imaging steering [47], and compounding process [47]. Thus, the weighted entropy may be also affected by the types of scatterers and the characteristics of the imaging system. Before using the weighted entropy in a clinical setting, further work should firstly focus on studying the effects of scatterer type and system factors on the weighted entropy.
6. Conclusions
We propose an information weighted entropy for evaluating the uncertainty of ultrasound RF signals. The findings obtained in this study are summarized as follows: (i) the algorithmic parameters Nco and Δy affect the estimation of entropy. According to the generalization of the results in Section 4.2 and Section 4.3, the appropriate combination of (Nco, Δy) for robustly estimating the weighted entropy is suggested to be (32, 0.04); (ii) the weighted entropy demonstrates an improved performance in differentiating different number densities of scatterers in a scattering medium (p-values between each number density of scatterers < 0.05); (iii) compared with the conventional entropy, the weighted entropy enables a more sensitive description on the variation of the scatterer concentration (the dynamic range of the weighted entropy is approximately five times that of the conventional entropy); (iv) the weighted entropy is dependent on the statistical distribution of the backscattered envelopes. An increase in the weighted entropy means a change in the microstructure from a relatively regular, random, to complex status. This study concluded that the weighted entropy simultaneously considering objective (probabilities of RF signals) and subjective factors (the signal amplitude) allows a sensitive detection of the number density of scatterers by using ultrasound.
Acknowledgements
This work was supported by the Ministry of Science and Technology (Taiwan) under Grant No. MOST 103-2221-E-182-001-MY3 and the Chang Gung Memorial Hospital (Linkou, Taiwan) under Grant Nos. CIRPD1E0021, CMRPD1C0711, and CIRPD1C0033.
Conflicts of Interest
The author declared no conflict of interest.
References
- Destrempes, F.; Cloutier, G. A critical review and uniformized representation of statistical distributions modeling the ultrasound echo envelope. Ultrasound Med. Biol. 2010, 36, 1037–1051. [Google Scholar] [CrossRef] [PubMed]
- Burckhardt, C.B. Speckle in ultrasound B-mode scans. IEEE Trans. Sonics Ultrasonics 1978, 25, 1–6. [Google Scholar] [CrossRef]
- Wagner, R.F.; Insana, M.F.; Brown, D.G. Statistical properties of radio-frequency and envelope detected signals with applications to medical ultrasound. J. Opt. Soc. Am. 1987, 4, 910–922. [Google Scholar] [CrossRef]
- Weng, L.; Reid, J.M.; Shankar, P.M.; Soetanto, K. Ultrasound speckle analysis based on the K distribution. J. Acoust. Soc. Am. 1991, 89, 2992–2995. [Google Scholar] [CrossRef] [PubMed]
- Dutt, V.; Greenleaf, J.F. Ultrasound echo envelope analysis using a homodyned K distribution signal model. Ultrasonic Imaging 1994, 16, 265–287. [Google Scholar] [CrossRef] [PubMed]
- Jakeman, E.; Tough, R.J.A. Generalized K distribution: A statistical model for weak scattering. J. Opt. Soc. Am. A 1987, 4, 1764–1772. [Google Scholar] [CrossRef]
- Liu, D.L.; Waag, R.C. Harmonic amplitude distribution in a wideband ultrasonic wavefront after propagation through human abdominal wall and breast specimens. J. Acoust. Soc. Am. 1997, 101, 1172–1183. [Google Scholar] [CrossRef] [PubMed]
- Blacknell, D.; Tough, R.J.A. Parameter estimation for the K-distributed based on [z log (z)]. IEE Proc. Radar Sonar Navig. 2001, 148, 309–312. [Google Scholar] [CrossRef]
- Hruska, D.P.; Sanchez, J.; Oelze, M.L. Improved diagnostics through quantitative ultrasound imaging. In Proceedings of Annual International Conference of the IEEE Engineering in Medicine and Biology Society, EMBC 2009, Minneapolis, MN, USA, 3–6 September 2009; pp. 1956–1959.
- Destrempes, F.; Poree, J.; Cloutier, G. Estimation method of the homodyned K-distribution based on the mean intensity and two log-moments. SIAM J. Imaging Sci. 2013, 6, 1499–1530. [Google Scholar] [CrossRef] [PubMed]
- Holfman, H.C. Statistical Methods on Radio Wave Propagation; Pergamon Press: New York, NY, USA, 1960. [Google Scholar]
- Mamou, J.; Oelze, M.L. Quantitative Ultrasound in Soft Tissues; Springer: New York, NY, USA, 2013; Chapter 10; p. 220. [Google Scholar]
- Shankar, P.M. A general statistical model for ultrasonic backscattering from tissues. IEEE Trans. Ultrasonics Ferroelec. Freq. Control 2000, 47, 727–736. [Google Scholar] [CrossRef] [PubMed]
- Shankar, P.M. A compound scattering pdf for the ultrasonic echo envelope and its relationship to K and Nakagami distributions. IEEE Trans. Ultrasonics Ferroelec. Freq. Control 2003, 50, 339–343. [Google Scholar] [CrossRef]
- Karmeshu; Agrawal, R. Study of ultrasonic echo envelope based on Nakagami-inverse Gaussian distribution. Ultrasound Med. Biol. 2006, 32, 371–376. [Google Scholar] [CrossRef] [PubMed]
- Agrawal, R. Karmeshu Ultrasonic backscattering in tissue: Characterization through Nakagami-generalized inverse Gaussian distribution. Comput. Biol. Med. 2006, 37, 166–172. [Google Scholar] [CrossRef] [PubMed]
- Smolikova, R.; Wachowiak, M.P.; Zurada, J.M. An information-theoretic approach to estimating ultrasound backscatter characteristics. Comput. Biol. Med. 2004, 34, 355–370. [Google Scholar] [CrossRef]
- Tsui, P.H.; Huang, C.C.; Sun, L.; Dailey, S.H.; Shung, K.K. Characterization of lamina propria and vocal muscle in human vocal fold tissue by ultrasound Nakagami imaging. Med. Phys. 2011, 38, 2019–2026. [Google Scholar] [CrossRef] [PubMed]
- Zhou, Z.; Huang, C.C.; Shung, K.K.; Tsui, P.H.; Fang, J.; Ma, H.Y.; Wu, S.; Lin, C.C. Entropic imaging of cataract lens: An in vitro study. PLoS One 2014, 9, e96195. [Google Scholar] [CrossRef] [PubMed]
- Tuthill, T.A.; Sperry, R.H.; Parker, K.J. Deviations from Rayleigh statistics in ultrasonic speckle. Ultrasonic Imaging 1988, 10, 81–89. [Google Scholar] [CrossRef] [PubMed]
- Shannon, C.E. A Mathematical Theory of Communication. Bell Syst. Tech. J. 1948, 27, 379–423. [Google Scholar] [CrossRef]
- Hughes, M.S. Analysis of ultrasonic waveforms using Shannon entropy. In Proceedings of IEEE 1992 Ultrasonics Symposium, Tucson, AZ, USA, 20–23 October 1992; pp. 1205–1209.
- Hughes, M.S. Analysis of digitized waveforms using Shannon entropy. J. Acoust. Soc. Am. 1993, 93, 892–906. [Google Scholar] [CrossRef]
- Hughes, M.S. Analysis of digitized waveforms using Shannon entropy. II. High speed algorithms based on Green’s functions. J. Acoust. Soc. Am. 1994, 95, 2582–2588. [Google Scholar] [CrossRef]
- Hughes, M.S.; McCarthy, J.E.; Marsh, J.N.; Arbeit, J.M.; Neumann, R.G.; Fuhrhop, R.W.; Wallace, K.D.; Znidersic, D.R.; Maurizi, B.N.; Baldwin, S.L.; et al. Properties of an entropy-based signal receiver with an application to ultrasonic molecular imaging. J. Acoust. Soc. Am. 2007, 121, 3542–3557. [Google Scholar] [CrossRef] [PubMed]
- Hughes, M.S.; McCarthy, J.E.; Marsh, J.N.; Wickline, S.A. Joint entropy of continuously differentiable ultrasonic waveforms. J. Acoust. Soc. Am. 2013, 133, 283–300. [Google Scholar] [CrossRef] [PubMed]
- Nawrockia, D.N.; Harding, W.H. State-value weighted entropy as a measure of investment risk. Appl. Eco. 1986, 18, 411–419. [Google Scholar] [CrossRef]
- Yang, L.; Yang, J.; Peng, N.; Ling, J. Weighted information entropy: A method for estimating the complex degree of infrared images’ backgrounds. In Image Analysis and Recognition; Kamel, M., Campilho, A., Eds.; Springer: Berlin/Heidelberg, Germany, 2005; Volume: 3656, pp. 215–222. [Google Scholar]
- Khan, J.F.; Bhuiyan, S.M. Weighted entropy for segmentation evaluation. Opt. Laser Technol. 2014, 57, 236–242. [Google Scholar] [CrossRef]
- Guiasu, S. Weighted entropy. Rep. Math. Phys. 1971, 2, 165–179. [Google Scholar] [CrossRef]
- Lai, W.K.; Khan, I.M.; Poh, G.S. Weighted entropy-based measure for image segmentation. Procedia Eng. 2012, 41, 1261–1267. [Google Scholar] [CrossRef]
- Yeung, R.W. A First Course in Information Theory; Kluwer Academic/Plenum Publishers: New York, NY, USA, 2002; Chapter 1; p. 2. [Google Scholar]
- Tsui, P.H.; Chang, C.C.; Ho, M.C.; Lee, Y.H.; Chen, Y.S.; Chang, C.C.; Huang, N.E.; Wu, Z.H.; Chang, K.J. Use of Nakagami statistics and empirical mode decomposition for ultrasound tissue characterization by a nonfocused transducer. Ultrasound Med. Biol. 2009, 35, 2055–2068. [Google Scholar] [CrossRef] [PubMed]
- Shung, K.K.; Thieme, G.A. Ultrasonic Scattering in Biological Tissues; CRC Press: Boca Raton, FL, USA, 1993. [Google Scholar]
- Jensen, J.A. Simulation of advanced ultrasound systems using Field II. In Proceedings of IEEE International Symposium on Biomedical Imaging: Nano to Macro, 2004, Prague, Czech Republic, 15–18 April 2004; pp. 636–639.
- Jensen, J.A.; Svendsen, N.B. Calculation of pressure fields from arbitrarily shaped, apodized, and excited ultrasound transducers. IEEE Trans. Ultrasonics Ferroelec. Freq. Control 1992, 39, 262–267. [Google Scholar] [CrossRef] [PubMed]
- Fontaine, I.; Bertrand, M.; Cloutier, G. A system-based approach to modeling the ultrasound signal backscattered by red blood cells. Biophys. J. 1999, 77, 2387–2399. [Google Scholar] [CrossRef]
- Azhari, H. Basics of Biomedical Ultrasound for Engineers; Wiley: New York, NY, USA, 2010; Chapter 9; p. 200. [Google Scholar]
- Tsui, P.H.; Chang, C.C. Imaging local scatterer concentrations by the Nakagami statistical model. Ultrasound Med. Biol. 2007, 33, 608–619. [Google Scholar] [CrossRef] [PubMed]
- Tsui, P.H. Minimum requirement of artificial noise level for using noise-assisted correlation algorithm to suppress artifacts in ultrasonic Nakagami images. Ultrasonic Imaging 2012, 34, 110–124. [Google Scholar] [CrossRef] [PubMed]
- Tsui, P.H.; Ma, H.Y.; Zhou, Z.; Ho, M.C.; Lee, Y.H. Window-modulated compounding Nakagami imaging for ultrasound tissue characterization. Ultrasonics 2014, 54, 1448–1459. [Google Scholar] [CrossRef] [PubMed]
- Zagzebski, J.A.; Chen, J.F.; Dong, F.; Wilson, T. Intervening attenuation affects first-order statistical properties of ultrasound echo signals. IEEE Trans. Ultrasonics Ferroelec. Freq. Control 1999, 46, 35–40. [Google Scholar] [CrossRef] [PubMed]
- Zhou, Z.; Wu, S.; Wang, C.Y.; Ma, H.Y.; Lin, C.C.; Tsui, P.H. Monitoring radiofrequency ablation using real-time ultrasound Nakagami imaging combined with frequency and temporal compounding techniques. PLoS One 2015, 10, e0118030. [Google Scholar] [CrossRef] [PubMed]
- Fang, J.; Chen, C.K.; Peng, J.Y.; Hsu, C.H.; Jeng, Y.M.; Lee, Y.H.; Lin, J.J.; Tsui, P.H. Changes in backscattered ultrasonic envelope statistics as a function of thrombi age: An in vitro study. Ultrasound Med. Biol. 2015, 41, 498–508. [Google Scholar] [CrossRef] [PubMed]
- Tsui, P.H.; Yeh, C.K.; Chang, C.C.; Chen, W.S. Performance evaluation of ultrasonic Nakagami image in tissue characterization. Ultrasonic Imaging 2008, 30, 78–94. [Google Scholar] [CrossRef] [PubMed]
- Tsui, P.H.; Tsai, Y.W. Artifact reduction of ultrasound Nakagami imaging by combining multifocus image reconstruction and the noise-assisted correlation algorithm. Ultrasonic Imaging 2015, 37, 53–69. [Google Scholar] [CrossRef] [PubMed]
- Garcia-Duitama, J.; Chayer, B.; Han, A.; Garcia, D.; Oelze, M.L.; Cloutier, G. Experimental application of ultrafast imaging to spectral tissue characterization. Ultrasound Med. Biol. 2015, 41, 2506–2519. [Google Scholar] [CrossRef] [PubMed]
© 2015 by the authors; licensee MDPI, Basel, Switzerland. This article is an open access article distributed under the terms and conditions of the Creative Commons Attribution license (http://creativecommons.org/licenses/by/4.0/).
Share and Cite
MDPI and ACS Style
Tsui, P.-H. Ultrasound Detection of Scatterer Concentration by Weighted Entropy. Entropy 2015, 17, 6598-6616. https://doi.org/10.3390/e17106598
AMA Style
Tsui P-H. Ultrasound Detection of Scatterer Concentration by Weighted Entropy. Entropy. 2015; 17(10):6598-6616. https://doi.org/10.3390/e17106598
Chicago/Turabian StyleTsui, Po-Hsiang. 2015. "Ultrasound Detection of Scatterer Concentration by Weighted Entropy" Entropy 17, no. 10: 6598-6616. https://doi.org/10.3390/e17106598