Article

A Trustworthiness Evaluation Method for Software Architectures Based on the Principle of Maximum Entropy (POME) and the Grey Decision-Making Method (GDMM)

1
School of Information, Yunnan University of Finance and Economics, Kunming 650221, China
2
School of Software, Yunnan University, Kunming 650091, China 
Entropy 2014, 16(9), 4818-4838; https://doi.org/10.3390/e16094818
Submission received: 26 February 2014 / Revised: 21 May 2014 / Accepted: 14 July 2014 / Published: 3 September 2014

Abstract

:
As the early design decision-making structure, a software architecture plays a key role in the final software product quality and the whole project. In the software design and development process, an effective evaluation of the trustworthiness of a software architecture can help making scientific and reasonable decisions on the architecture, which are necessary for the construction of highly trustworthy software. In consideration of lacking the trustworthiness evaluation and measurement studies for software architecture, this paper provides one trustworthy attribute model of software architecture. Based on this model, the paper proposes to use the Principle of Maximum Entropy (POME) and Grey Decision-making Method (GDMM) as the trustworthiness evaluation method of a software architecture and proves the scientificity and rationality of this method, as well as verifies the feasibility through case analysis.

1. Introduction

With the increasing spread and complexity of software systems, software is not always trusted and its behaviors and consequences sometimes do not conform to people’s expectation and even may lead to disasters. This kind of accident is common. In 2007, the software system of Los Angeles International Airport broke down, which led to 60 flights, and 20,000 passengers in total failing to land [1]. Due to the whole collapse of the ambulance dispatch software system in London (UK), many patients lost their lives because of the resulting untimely rescues [2]. In 2005, Japan’s Tokyo Stock Exchange suffered a stock market lockout due to a software system failure [1]. In 2003, the Russian Alliance-TMA1 satellite deviated 460 Km from the expected landing spot on the way back due to a design error in its navigation software [1]. Therefore, constructing trustworthy software has been an important trend and inevitable choice for modern software technology development and application.
In the software design and development process, effective tracking and control software trustworthiness is an effective means of improving the overall software trustworthiness [3]. Numerous practices shows that 70% of errors of the software development projects (especially in large-scale systems) are caused by the architecture and requirements. The longer the error in the system is, the more difficult it is to find and the more expensive the costs to solve it are [4]. Thus, the control in the early stage of software development can have a sound effect. One of the founders of UML, Grady Booch, a famous computer professional, thinks a weak software architecture is one reasons for the failure of software projects. Perry [4,5] considers the software architecture as the 1st most important design object in software development project management, while Boehm [4,6] clearly points out that if there are no architecture and rules, the whole project can not go on. As the first semi-product the from problem space to the solution space, a software architecture is an important part of the software development and project management. The trustworthiness of an architecture is the basis of developing a highly trustworthy software. How to use the analysis and evaluation of a software architecture to guarantee and improve the software trustworthiness and quality has been a research hotspot of software project management academic research and engineering practice [7]. However, is a specific software architecture really trustworthy? How to evaluate and measure the trustworthiness? How to select the most trustworthy architecture from the among the various candidates? All these issues must be solved urgently in the software project quality management field.

2. Related Research

2.1. Trustworthiness Software

In 1985, Laprie [8] proposed the concept of dependable computing. For many years, people put forward various statements on the concept of the dependable software from different views. So far, there is still no definite definition with wide acceptation and good form. It can be called Trustworthiness, Credibility, Dependability, Confidence and Assurance [2]. The International Trusted Computing Group think that Trustworthiness refers to thye fact that the system completely complies with the intentions of the designers and programmers to implement a specific task [9]. The US National Science and Technology Council (NSTC) thinks that the high confidence of a information system is a predictability measurement that conforms to the set expectations [10]. This concept emphasizes the behavior predictability and target conformity of a software (object).
In recent years, many countries have attached importance to the study of trustworthy software and proposed relevant research plans with clear targets. The US National Software Development Strategy (2006–2015) places the development of highly trustworthy software in the first place and put forward the idea of the next-generation software engineering.
Formalization theory and software verification technology have been paid great attention in the trustworthy software field. The Turing Award winners Edsger Wybe Dijkstra, Tony Hoare, Robin Milner, Amir Pnueli and others have all adopted various formalization methods to improve the trustworthiness, reliability and safety of programs in the programming field. For example, the axiomatization theory of sequential program put forward by Tony Hoare gave the formalization inference system of sequential program with partial correctness and complete correctness through pre- or post- assertion.
Besides, there are also many research achievements in trustworthiness software. Suri et al. [11] developed a dependability-driven framework that helps conduct the integration of SW components onto HW resources for dependable embedded systems. Shin et al. [12] studied integration testing through reusing representative unit test cases for high-confidence medical software. Oza et al. [13] presented a detailed empirical investigation of trust in commercial software outsourcing relationships, and the investigation presents what vendor companies perceive about obtaining trust from client companies in outsourcing relationships. Babar et al. [14] study establishing and maintaining trust in software outsourcing relationships. Their research objective is to understand software outsourcing practitioners’ perceptions of the role of trust in managing client–vendor relationships and the factors that are critical to trust in off-shore software outsourcing relationships. Ahamed et al. [15] presented a flexible, manageable, and configurable software-based trust framework for the handheld devices of managers to access distributed information systems.

2.2. Software Architecture

Since the proposal of the concept of software architecture in the 1990s, there have been hundreds of definitions [16,17]. Garlan and Shaw [18] defined it as below:
Software Architecture = { components , connectors , constrains }
A component can be a group of codes (for example, the module of a program) and an independent program. A connector represents the interaction between components, for example, program calls, channels, remote procedure calls and others. A software architecture also includes some constraints.
Creps and Simos defined it as follows [19]:
Software Architecture = { elements , interfaces , connections , connection semantics }
A software system is composed of a group of elements, which can be divided into processing elements and data elements. Each element has one interface and the connection of a group of elements constitutes the topology of the system. The connected semantics of elements belongs to static interconnection semantics (for example, the connection of data elements), describing the information conversion protocol of dynamic connection (for example, program call, channel, etc.).
Rugina et al. [20] put forward a system trusted modeling framework based on Architecture Analysis and Design Language (AADL) and Generalized Stochastic Petri Net (GSPN) so as to guarantee the trustworthiness of the software. In [21] embedded system architecture trusted modeling based on the architectural analysis and design language and error model is studied.
Besides, there are also many research achievements in this field. Anjos et al. [22] proposed a software architecture based on LabVIEW for controlling discrete event systems. The proposed architecture is an adaptation of the producer-consumer design pattern. Weinreich and Buchgeher [23] presented a semi-formal architecture model, which is used in all activities of the architecture life cycle, and on a set of extensible and integrated tools supporting these activities. Kazman et al. [24] showed how architecture design and analysis techniques rest on a small number of foundational principles. Li et al. [25] aimed to collect studies on the application of knowledge-based approaches in software architecture and make a classification and thematic analysis on these studies. Breivold et al. [26] presented a systematic review of architectures for software evolvability to obtain an overview of the existing approaches in analyzing and improving software evolvability at an architectural level, and investigate the impacts on research and practice.

2.3. Trustworthiness Evaluation

Ding et al. [27] proposed a novel evidential reasoning based method for software trustworthiness evaluation under uncertain and unreliable environment conditions. Schmidt et al. [28] proposed not only a customisable trust evaluation model based on fuzzy logic. but also demonstrated the integration of post-interaction processes like business interaction reviews and credibility adjustment. Zarandi et al. [29] studied dependability evaluation of embedded systems, and proposed an experimental method to determine sensitivity to soft errors in an embedded system exploiting Altera SRAM-based FPGAs. An important concern for the successful deployment of a dependable system is its quality of service (QoS), which is significantly influenced by its architectural style. Bischofs et al. [30] proposed the comparative evaluation of architectural styles by simulation.

2.4. This Paper’s Reviews

At present, there is a lot of literature on trustworthy software as well as on software architecture. However, the research achievements of the software trustworthiness evaluation and measurement are not so abundant and the relevant theories and methods are immature [1]. The lack of trustworthy evaluation and measurement methods make the product have numerous defects and threaten the system operation when it is launched [31].
In [2729] software trustworthiness evaluation and measurement are studied, while failing to study the software architecture. In [30] the style evaluation of a software architecture is studied, while failing to involve the concept of trustworthiness. In [20,21] the authors study the trusted modeling of a architecture while failing to involve trustworthiness evaluation and measurement. Paper [32] studies the service-oriented trustworthy software architecture and gives the corresponding algebraic model while it also fails to discuss trustworthiness evaluation and measurement. In [7] a software architecture quality evaluation is carried out, but it does not consider its trustworthiness. At present, the software architecture quality evaluation mainly includes questionnaire or checklist-based evaluations, scene-based evaluations, measurement-based evaluations and so on. According to the author’s investigation, there is no literature about research achievements on the software architecture trustworthiness evaluation and measurement.

3. Software Architecture Trustworthiness Evaluation Based on POME and GDMM

3.1. Related Definition

For the convenience of studying software architecture trustworthiness, this paper provides the definitions below on the basis of the previous studies:
  • Definition 1: Trustworthiness is when an entity realizes the set target, its behaviors and consequences always can be expected.
  • Definition 2: Trustworthy software refers to the fact that the service provided by the software system always conforms to people’s expectation and is still stable in case of interference.
  • Definition 3: Trustworthiness of a software architecture refers the degree by which a software architecture conforms to people’s expectations, and supports the software life cycle and provides services in each stage of the life cycle.
  • Definition 4: Trustworthy software architecture―if a software architecture meets people’s expectations, then it is a trustworthy software architecture.

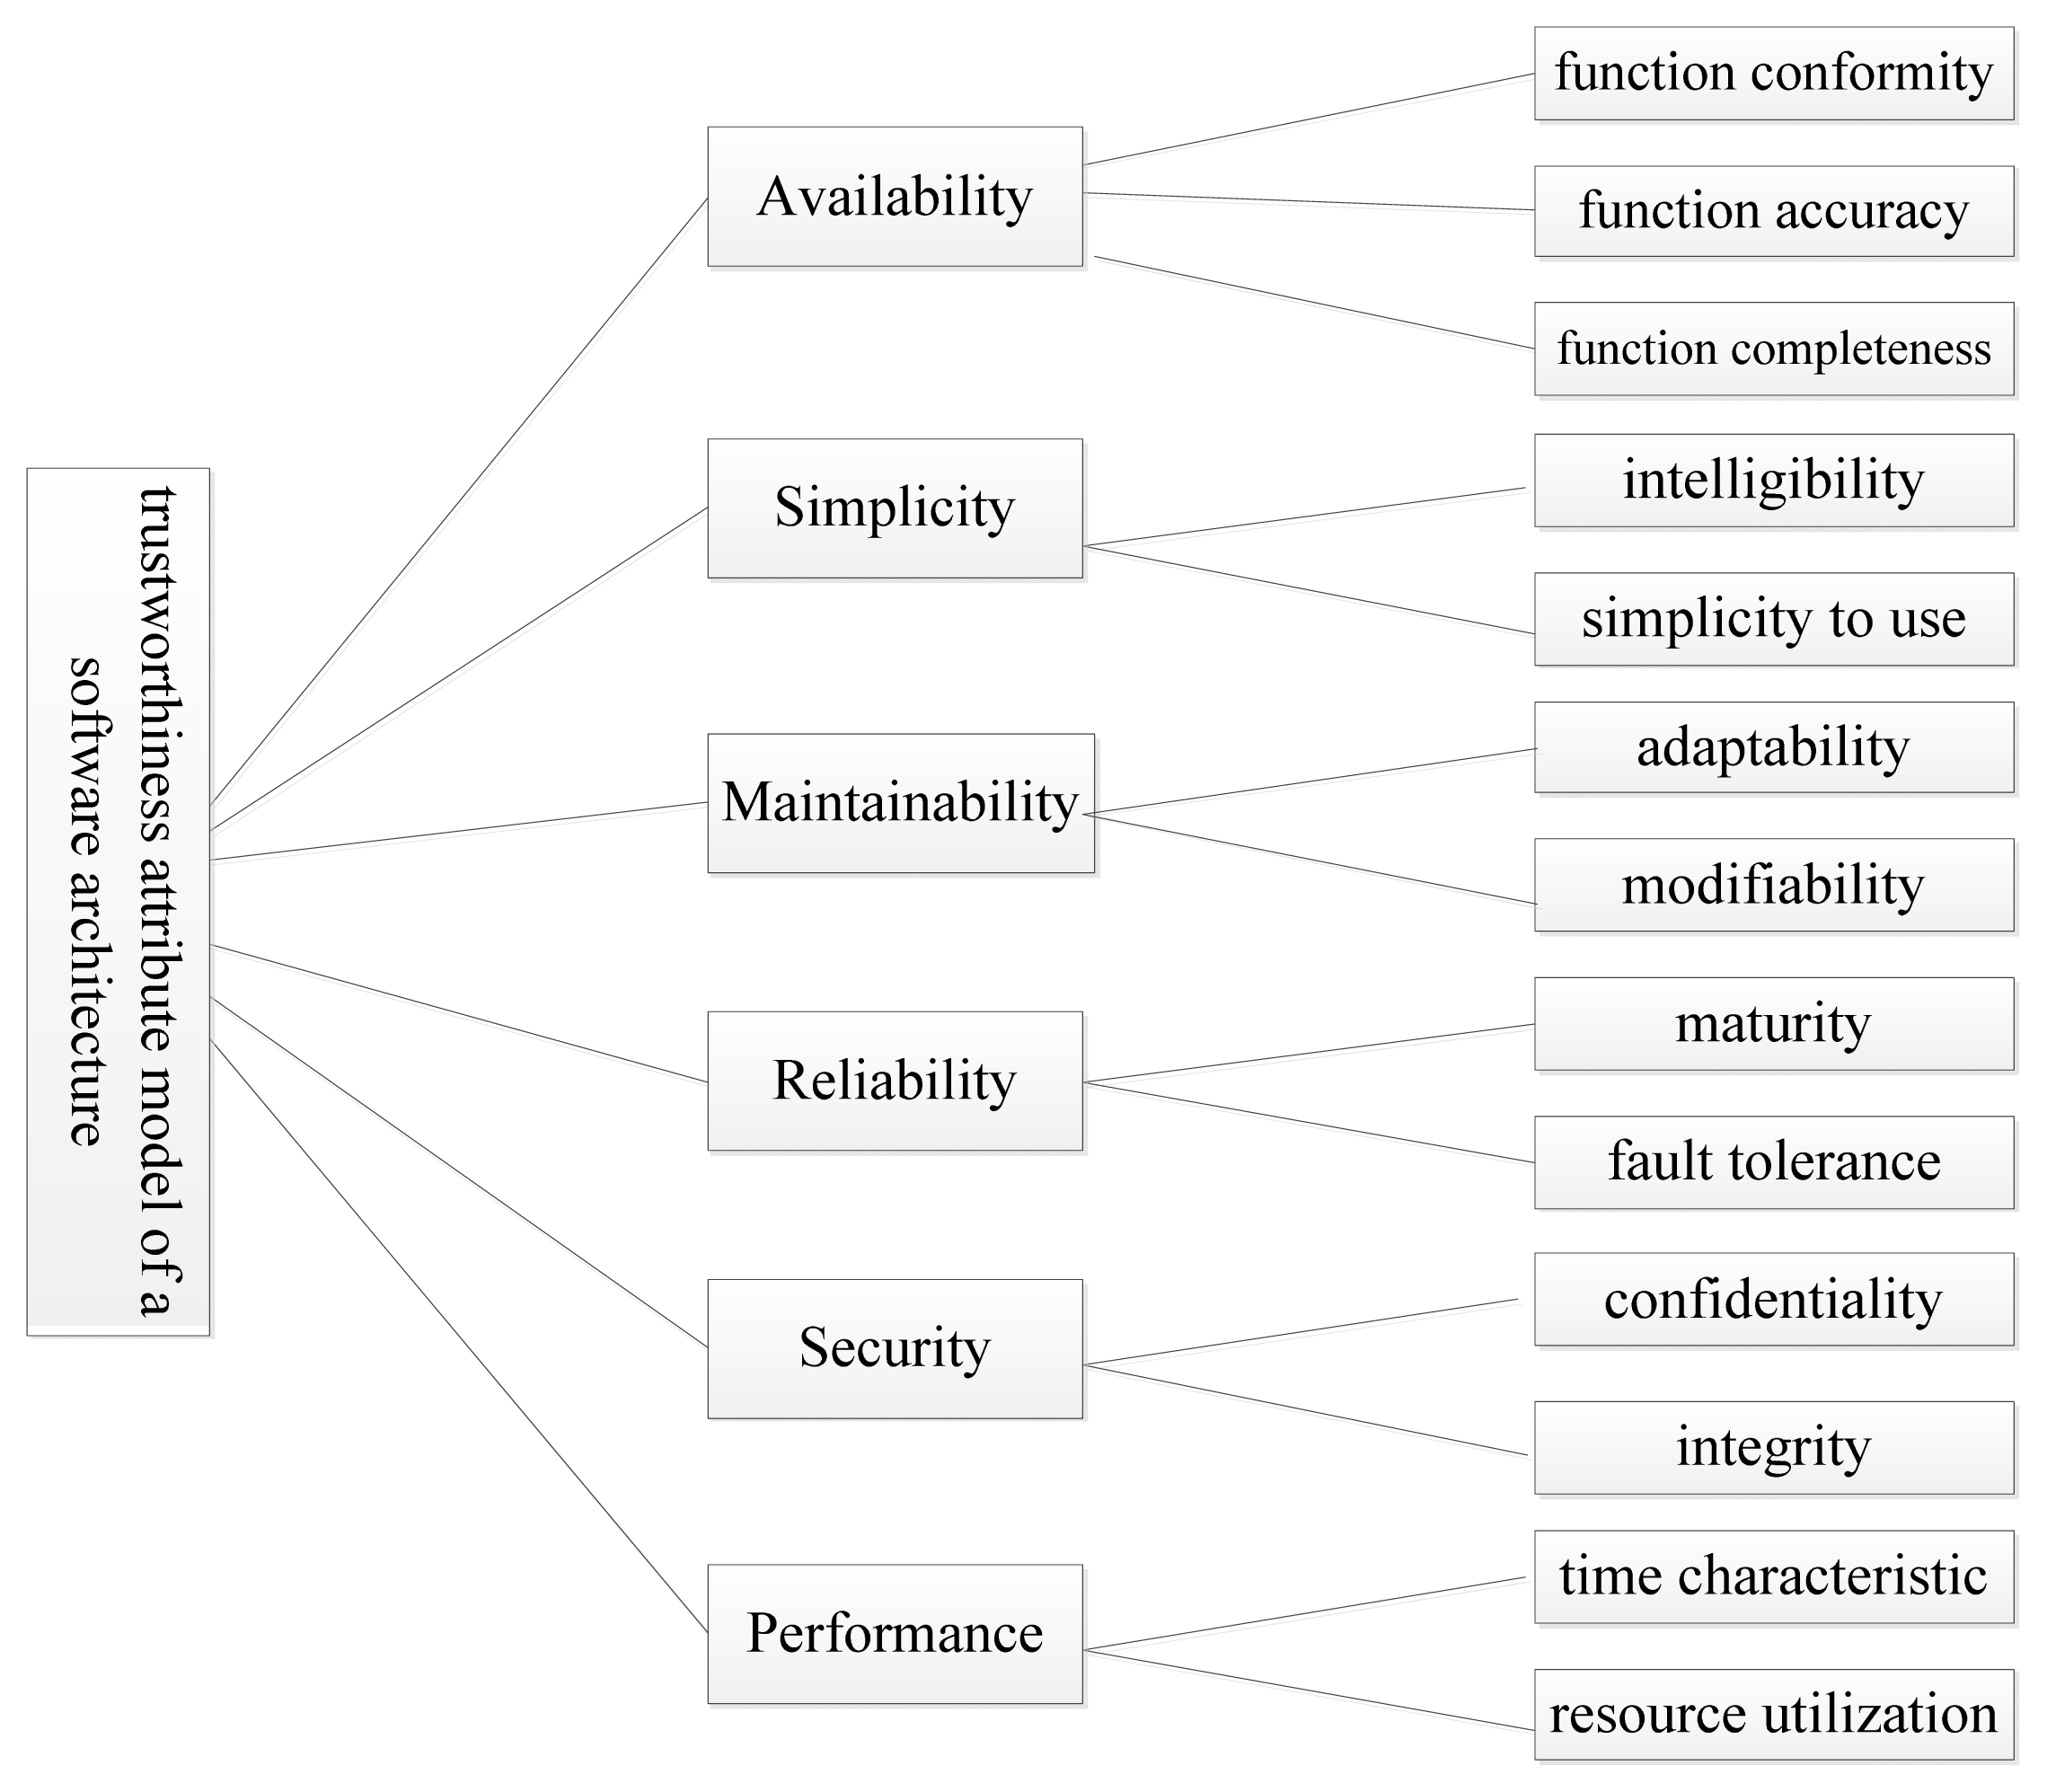
3.2. Trustworthiness Attribute of a Software Architecture

From Definitions 3 and 4, it can be seen that the trustworthiness of a software architecture is a subjective feeling of its trustworthiness attribute for people, and the trustworthiness attribute can further describe the trustworthiness of a software architecture. One trustworthy attribute expresses an objective ability of the software architecture relevant to the trustworthiness. As the semi-product in the software process, the software architecture determines the final software product and obviously its trustworthiness attribute is relevant to that of the software. Also undoubtedly the quality characteristic of the software architecture is an important indicator of its trustworthiness attribute. The higher the quality is, the higher the trustworthiness is. Therefore, the trustworthiness attribute modeling of a software architecture is based on the software trustworthiness attribute and software architecture quality attribute. Avizienis et al. [33] stated the fundamental concepts and classification of trustworthy computing and secure computing and first proposed the conceptual framework of trustworthiness. Bo et al. [31] came up with a software trustworthy hierarchy model. Albin [34] raised the issue of the software architecture quality attributes.
Based on these achievements, this paper presents a trustworthiness attribute model of software architecture in Figure 1, which enables the trustworthiness to be expressed. This model is a set of trustworthiness attributes and the defined trustworthiness attributes of a software architecture are constituted by its availability, simplicity, maintainability, reliability, security and performance, as well as their respective sub-attributes, as shown in Figure 1.
Availability refers to the ability that a software architecture has for the explicit and implicit requirement functions and the correct services for follow-up software processes. In details, it includes function conformity, function accuracy and function completeness.
Simplicity refers to the degrees of comprehension, learning, analysis and use of the software architecture, including the intelligibility and simplicity to use.
Maintainability refers to the ability to adjust and modify the software architecture. It demonstrates the simplicity to correct a defect or modify the software architecture, including the adaptability and modifiability.
Reliability refers to the ability to provide continuous correct services and support in each stage of software process, including maturity and fault tolerance.
Security refers to the ability to avoid thedisclosure of unauthorized information and the improper modification of the system. It includes confidentiality and integrity.
Performance refers to the convenience and speed of the software architecture for the support and service provision in the follow-up software process, including time characteristic and resource utilization.

3.3. Evaluation Method Based on POME and GDMM

Due to limitations on cognition and the inherent complexity of objects, we usually can only acquire incomplete information during any decision evaluation, that is, a small sample and poor information which is only partially known. In 1982, Deng Julong, a famous Chinese scholar, published his paper titled “Control Problems of the Grey System” in Elsevier’s Systems & Control Letters, marking the birth of grey system theory which can effectively deal with uncertainty problem with poor information. In case of small samples and poor information, characteristic values of decision objects can be usually represented as grey numbers.
Software trustworthiness evaluation is a new direction in trustworthy software studies. However, the trustworthiness study of a software architecture still is in the exploration stage at present. The trustworthiness attribute model of a software architecture shown in Figure 1 belongs to a multi-attribute model. Each trustworthiness attribute has both greyness and fuzziness, which make the trustworthiness evaluation of the whole software architecture complex and difficult, which can be solved by inviting experts to make decisions. However, in consideration of the knowledge, experience, personal preference and other differences of each expert, there are both greyness and fuzziness when different experts evaluate the same specific issue, and their evaluations will vary.
To date, grey system theory has been applied to many different areas successfully. In terms of grey system decisions, Dang [35] achieved some pioneering research achievements and proposed the grey decision problem analysis method. On the basis of [35] and the trustworthiness attribute model of a software architecture (shown in Figure 1), the maximum entropy principle and grey decision-making method are used to evaluate the trustworthiness of a software architecture, shown as below.
Suppose X, U and D respectively represent the alternative design scheme set, trustworthiness attribute set and trustworthiness evaluation expert set of the software architecture. The evaluation expert dkD gives the attribute value of the scheme xi xiX in case of trustworthiness attribute ujU, grey fuzz number (μij(k), υij(k)), where i ∈ [1, m], j ∈ [1, n]. For a given expert dk, there is a equivalent grey fuzzy relation (k) between the architecture design scheme set X and the trustworthiness attribute set U, which causes when membership degree μR(k) (xi, uj) ≅ μij(k) between any scheme xi and trustworthiness attribute uj, there is grey level vR(k) (xi, uj) ≅ υij(k) is noted as (μij(k), υij(k)). Then the grey fuzzy relation (k), which is determined by evaluation expert dk, can be expressed as follows by aid of grey fuzzy relation matrix:
R ˜ ( k ) = ( ( μ 11 ( k ) , υ 11 ( k ) ) ( μ 12 ( k ) , υ 12 ( k ) ) ( μ 1 n ( k ) , υ 1 n ( k ) ) ( μ 21 ( k ) , υ 21 ( k ) ) ( μ 22 ( k ) , υ 22 ( k ) ) ( μ 2 n ( k ) , υ 2 n ( k ) ) ( μ m 1 ( k ) , υ m 1 ( k ) ) ( μ m 2 ( k ) , υ m 2 ( k ) ) ( μ mn ( k ) , υ mn ( k ) ) ) . k [ 1 , l ]
Suppose the grey fuzzy weight vector of the evaluation expert is:
λ ˜ = ( ( λ 1 , π 1 ) , ( λ 2 , π 2 ) , , ( λ 1 , π 1 ) )
where λk ≥ 0, k = 1 l λ k = 1, 0 ≤ πk ≤ 1 (k ∈ [1,l]), then the corresponding grey fuzzy relation matrix of expert group can be expressed as:
R ˜ = ( ( μ 11 , υ 11 ) ( μ 12 , υ 12 ) ( μ 1 n , υ 1 n ) ( μ 21 , υ 21 ) ( μ 22 , υ 22 ) ( μ 2 n , υ 2 n ) ( μ m 1 , υ m 1 ) ( μ m 2 , υ m 2 ) ( μ mn , υ mn ) ) k [ 1 , l ]
where μ ij = k = 1 l λ k μ ij ( k ) , υ ij = [ 1 l k = 1 l ( π k + υ ij ( k ) ) ] 1, i ∈ [1,m], j ∈ [1,n].
Definition 5―Deviation degree [35]: suppose there is grey fuzzy number p1 = (μ1, υ1), p2 = (μ2, υ2), then d(p1, p2) = |μ1 − μ2| + | υ1 – υ2| is referred to as the deviation degree of grey fuzzy number p1, p2. In group grey fuzzy relation matrix Equation (3), an element is noted as (μij, υij) =ij, where i ∈ [1,m], j ∈ [1,n]. Suppose the trustworthiness attribute weight vector of the architecture is = w = (w1, w2,···, wn). The maximum entropy principle is used to process the weight problem. Similar to the principle of entropy increase in the thermodynamics statistical physics, there also is a corresponding and famous theorem about the information entropy—the Principle of Maximum Entropy (POME). Jaynes [36] points out that when inferring according to partial information, we must choose such a probability to allocate, which shall possess the maximum information entropy and obey all the known information. This is the only unbiased allocation we can realize. Jaynes thinks this is the only unbiased allocation and the hypothesis of other forms may all introduce some uncertain subjective factors, which can bring in some irrationalities of the final results. Jaynes has theoretically proved that the information entropy can achieve the distribution of maximum value under some constraint conditions (usually some given mean values of some random variables) according to the Maximum Information Entropy Theory when we select the distribution from all the compatible distributions. When the information entropy is maximum, the probability of the corresponding set of probability distribution is in absolute advantage. Simply, the maximum entropy criterion is meant to select the maximum solution of the entropy from all the possible solutions. When we regard the entropy as the most suitable tool to measure the uncertainty, we basically have decided to select the random variable distribution with maximum uncertainty under the given constraints, because when the entropy is maximum, the corresponding random distribution is the most random and it means the artificial assumption (artificially added information) is minimum. At this time, the maximum entropy solution among all the reliable solutions has the minimum subjective component. This makes a maximum estimation distribution of the uncertain issues. In this way, it is the most objective and the solution is the most natural and has minimum artificial deviation. The Principle of Maximum Entropy can be expressed as the following optimization problem:
max  S n ( P ) = - i = 1 n p i ln  p i s . t . { i = 1 n p i = 1 p i 0 , i [ 1 , n ] i = 1 n p i g j ( x i ) = E [ g j ] = c j , j [ 1 , m ]

Theorem 1 [37]

The solution of the maximum entropy optimization model (4) satisfying the moment constraints can be expressed as below:
p i = exp [ j = 1 m α j g j ( x i ) ] i = 1 n exp [ j = 1 m α j g j ( x i ) ]
where αj is the Lagrange multiplier of the corresponding moment constraint j.
Proof: in consideration that the definition of entropy function has contained a non-negativity constraint condition of discrete probability, it is not necessary to consider it when computing. Therefore, the Lagrange function of this issue can be written in the form below:
L ( P , α ) = - i = 1 n p i ln  p i + ( α 0 + 1 ) ( i = 1 n p i - 1 ) + j = 1 m α i ( i = 1 n p i g j ( x i ) - E [ g j ] )
where α = ( α 0 α 1 α 0 ), αj (j = 1, 2,···,m) represents the Lagrange multiplier of constraint j and α0 represents the Lagrange multiplier of constraint i = 1 n p i = 1.
Entropy optimization problem (4) is convex programming, so it has a globally optimal solution, which can be directly solved through the stationary value condition of function L(P,α). At the same time, this problem also is a divisible variable optimization problem, so it is easy to utilize the stationary value condition to obtain the closed-form solution in the form of a multiplier:
p i = exp [ α 0 + j = 1 m α j g j ( x i ) ] , i [ 1 , n ]
where m + 1 undetermined multipliers αj (j = 1, 2,···,m) can be determined by m + 1 equality constraints in Problem (4).
Substitute (7) into the normalization condition in (4), we can get:
exp ( - α 0 ) = i = 1 n exp [ j = 1 m α j g j ( x i ) ]
Suppose:
Z = i = 1 n exp [ j = 1 m α j g j ( x i ) ]
Then it has the same function as the partition function in statistical physics. Substituting Equations (8) and (9) into Equation (7), we can get the maximum entropy distribution expressed with partition function Z:
p i = exp [ j = 1 m α j g j ( x i ) ] / Z , i [ 1 , n ]
namely: p i = exp [ j = 1 m α j g j ( x i ) ] i = 1 n exp [ j = 1 m α j g j ( x i ) ]
It is known from the principle of maximum entropy and [35], that w should let the total deviation function:
D ( w ) = j = 1 n D j ( w ) = j = 1 n i = 1 m k = 1 m d ( r i j , r k j ) w j
reach the maximum.
According to the physical significance of information entropy, when H ( w ) = - j = 1 n w j ln  w j reaches the maximum, the random uncertainty of w = (w1, w2,···, wn) is the minimum and the artificially added information is the least, therefore the entropy maximum is the most objective. The weight of the trustworthiness attribute shall be the solution of the following optimization problem:
max  G ( w ) = j = 1 n i = 1 m k = 1 m d ( r i j , r k j ) w j - j = 1 n w j ln  w j s . t { j = 1 n w j = 1 w j 0             j [ 1 , n ]
Formula (12) can be solved through the Lagrange multiplier method. Generally, the rule of Lagrange multiplier method can be described as below.
For the conditional extremum point of an n-ary function f(x1, x2···, xn) under m(m < n) constraint conditions (as follows):
{ φ 1 ( x 1 , x 2 , , x n ) = 0 φ 2 ( x 1 , x 2 , , x n ) = 0 φ m ( x 1 , x 2 , , x n ) = 0
we can multiply f, φ1, φ2,···, φm by constants 1, λ1, λ2,···, λ;m in order and then add them. In this way, we can get the following function: F (x1, x2,···, xn) = f + λ1φ1 + λ2φ2 + ··· λmφm.
Then we list the necessary conditions of the extremum of F (x1, x2­­,···, xn) under no constraint conditions as follows:
{ F x 1 = F x 1 + λ 1 φ 1 x 1 + λ 2 φ 2 x 2 + + λ m φ m x m = 0 F x 2 = F x 2 + λ 1 φ 1 x 2 + λ 2 φ 2 x 2 + + λ m φ m x 2 = 0 F x n = f x n + λ 1 φ 1 x n + λ 2 φ 2 x n + + λ m φ m x m = 0
With n Equations (14) and m Equations (13) simultaneously, we can get n + m unknown numbers x1, x2,···, xn and λ1, λ2,···, λm. Among them, x1, x2,···, xn may be the coordinates of the extremum point, called stationary point.
With the aid of the Lagrange multiplier method, we can get the unique solution of Formula (12) as follows:
w j = e i = 1 m k = 1 m d ( r i j , r k j ) j = 1 n e i = 1 m k = 1 m d ( r i j , r k j ) , j [ 1 , n ]
If we denote the attribute weight vector as:
A ˜ = ( w 1 , 0 ) , ( w 2 , 0 ) , , ( w n , 0 ) )
Let the weight of each known trustworthiness attribute and the corresponding point grey level constituting the following weight vector:
A ˜ = ( ( α 1 , υ 1 ) , ( α 2 , υ 2 ) , , ( α n , υ n ) )
where, αj > 0, j = 1 n α j = 1, 0 ≤ υj ≤ 1, j ∈ [1,n].
Gather the synthesized attribute value of each scheme, namely compute:
B ˜ = R ˜ A ˜ T = ( ( b i , υ b i ) ) m × 1 = ( ( b 1 , υ b 1 ) ( b 2 , υ b 2 ) ( b m , υ b m ) )
where b i = j = 1 n α j μ i j , υ b i = [ 1 n j = 1 n ( υ j + υ ij ) ] 1, i ∈ [1,m].
The ordering vector β = (β1, β2…, βn) of can be defined as:
β i = P ( ( b i , υ b i ) ) = α b i + ( 1 - α ) ( 1 - υ b i )
where i ∈ [1,m], α ∈ [0,1] represents the equilibrium coefficient.
For Formula (19), the value of βi reflects that the larger the synthesized membership degree of scheme i is, the better it is; while the smaller the synthesized point grey level is, the better it is. From Formula (3) and Formula (15), we can get the synthesized grey fuzzy attribute value of each alternative software architecture design scheme, namely by computing Formula (8). According to Formula (19), we can get the ordering vector β = (β1, β2,···, βn) in Formula (18). Sizing down the corresponding schemes according to the component sizes β1, β2,···, βn, the scheme with the largest component is the optimal scheme.

4. Case Analysis

4.1. Case 1

Kunming Shunning Technology Company, hereinafter referred to as KSTC, mainly engages in software development. KSTC contracted for a software development project SPA. To develop highly trustworthy software and improve software quality, the project team designed four software architecture design schemes X = {x1, x2 x3, x4} and the most trustworthy one should be determined for the system to be developed. The project manager invited five experts D = {d1, d2, d3, d4} who were not the designers and did not have conflicts of interest with the project to evaluate the trustworthiness of these schemes. From the trustworthiness attribute model of the software architecture (shown in Figure 1), U = {UA, US, UM, UR, US′, UP}, where UA, US, UM, UR, US′, UP represent availability, simplicity, maintainability, reliability, security and performance, respectively, and UA = {μ1, μ2 μ3}, μ1 = {function conformity}, μ2 = {function accuracy}, μ3 = {function completeness}, US = {μ4, μ5}, μ4 = {intelligibility}, μ5={simplicity to use}, UM={μ6, μ7}, μ6 = {adaptability}, μ7 = {modifiability}, UR = {μ8, μ9}, μ8 = {maturity}, μ9 = {fault tolerance},US′ = {u10, u11}, μ10 = {confidentiality}, μ11 = {integrity}, UP = {μ12, μ13}, μ12 = {time characteristic}, μ13 = {resource utilization}. According to the attribute indexes of the model in Figure 1, the experts gave the following evaluation data based on their expertise, experience and actual architectures (Tables 15).
If the evaluation value of each evaluation expert is equally important, namely, λ1 = λ2 = λ3 = λ4 = λ5. The grey values respectively are π1 = 0.2, π2 = 0.1, π3 = 0.3, π4 = 0.5, π5 = 0.2, then λ̄ = ((0.2,0.2),(0.2,0.1),(0.2,0.3),(0.2,0.5),(0.2,0.2)). According to Formula (3), we can get the grey fuzzy relation matrix of group evaluation expert, shown as Table 6.
According to Formula (15), we can get:
w = ( w 1 , w 2 , , w 13 ) = { w 1 = 0.061896 w 2 = 0.171650 w 3 = 0.031358 w 4 = 0.115060 w 5 = 0.021877 w 6 = 0.032637 w 7 = 0.078685 w 8 = 0.028947 w 9 = 0.090510 w 10 = 0.143374 w 11 = 0.054897 w 12 = 0.137752 w 13 = 0.031358
From Formula (18) and Formula (16), we can get:
R ˜ = ( ( 0.597 , 0.420 ) , ( 0.647 , 0.402 ) , ( 0.655 , 0.399 ) , ( 0.647 , 0.448 ) )
According to Formula (19), we compute the ordering vector of each architecture alternative design scheme and we can get that:
Namely, β3 > β2 > β4 > β1. Thus x3 > x2 > x4 > x1
β = ( β 1 , β 2 , β 3 , β 4 ) = { β 1 = 0.59230044564019 β 2 = 0.63354782516312 β 3 = 0.64048605906836 β 4 = 0.62173614118806
The trustworthiness of the third scheme is the best and that of the first one is the poorest. The design schemes x1, x2 x3, x4, adopt layers architecture, implicit invocation architecture, blackboard architecture and control loop architecture, respectively. The blackboard architecture can construct models for cooperating tasks. It can express the synergism as well as solve the uncertainty in a flexible mode. The implicit invocation architecture suits a complicated project owing its abundant planning function. The control loop architecture is not suitable for a complex system, but for a simple one. The main drawback to the layers architecture is that the frame will be damaged when detailed refinement requires a greater level. Therefore, the project decision maker selected x3 architecture. The software system based on the architecture was successfully developed and has been used by company H for two years in good conditions, showing that the evaluation method is scientific and reasonable.

4.2. Case 2

Another software project SPB of KSTC has three software architecture design alternative schemes X = {x1, x2 x3, x4} and four evaluation experts D = {d1, d2, d3, d4} to try to evaluate the trustworthiness of each software architecture design scheme. The operation procedure is the same with case 1. The expert evaluation results are shown from Tables 710.
If the evaluation value of each evaluation expert is equally important, namely, λ1 = λ2 = λ3 = λ4. The grey values respectively are π1 = 0.1, π2 = 0.2, π3 = 0.25, π4 = 0.2, then λ̄ = ((0.25,0.1),(0.25,0.2),(0.25,0.25),(0.25,0.2)). According to Formula (3), we can get the grey fuzzy relation matrix of group evaluation expert, shown as Table 11.
According to Formula (15), we can get:
w = ( w 1 , w 2 , , w 13 ) = { w 1 = 0.088429 w 2 = 0.102739 w 3 = 0.131920 w 4 = 0.068868 w 5 = 0.051019 w 6 = 0.043912 w 7 = 0.068868 w 8 = 0.053635 w 9 = 0.065510 w 10 = 0.037796 w 11 = 0.161127 w 12 = 0.080013 w 13 = 0.046164
From Formula (18) and Formula (16), we can get:
R ˜ = ( ( 0.71 , 0.335 ) , ( 0.625 , 0.323 ) , ( 0.593 , 0.331 ) )
According to Formula (19), we compute the ordering vector of each architecture alternative design scheme and we can get that:
Namely, β1 > β2 > β3. Thus x1 > x2 > x3. The trus
β = ( β 1 , β 2 , β 3 ) = { β 1 = 0.69815045257821 β 2 = 0.63912854998425 β 3 = 0.61391998735905
tworthiness of the first scheme is the best in the three software architecture alternative design schemes. Therefore, the project decision maker selected architecture x1. The software system based on that architecture was successfully developed and has been used by company P for a year in good condition, showing once again that the evaluation method is scientific and reasonable.

5. Discussion and Conclusions

To effectively trace and control the software trustworthiness in the design and development process is an efficient method. As the early design decision, a software architecture plays a key role for the software product quality and the success of the whole project. It is inevitable that an architecture with a low trustworthiness will lead to an untrustworthy software. Therefore, the evaluation and measurement of a software architecture trustworthiness can provide a basis for making decisions about a scientific and reasonable architecture and is necessary for the construction of highly trustworthy software. In view of the lack of studies on the evaluation and measurement of software architecture trustworthiness, this paper provides a trustworthiness attribute model of software architecture. Based on this model, the paper put forward one trustworthiness evaluation method of software architecture based on POME and GDMN.
The third section demonstrates the scientific soundness and reasonability of this method theoretically, while the fourth section validates the feasibility and effectiveness of the method through case analyses. In Case 1 mentioned in the fourth section, four alternative architecture design schemes were designed for project SPA and evaluated by five experts and eventually the third one was applied to the software system development. In Case 2, three alternative architecture design schemes were designed for project SPB and evaluated by four experts and eventually the first one was applied to the software system development. The two software systems have been put into use for over one year by now and remain operating in good condition without any major problems or breakdowns. Thus it can be seen that the decision making is scientific and reasonable and the evaluation method put forward in this paper is effective.

Acknowledgments

This work was supported by National Natural Science Foundation of China (Grant No. 61263022, 61303234 and 71362016), China Postdoctoral Science Foundation (Grant No. 2012M521722), National Social Science Foundation of China (Grant No. 12XTQ012), Humanities and Social Sciences Youthful Foundation of the Ministry of Education of China (Grant No. 11YJCZH073), Natural Science Foundation of Yunnan Province of China (Grant No. 2010ZC100), Philosophy and Social Sciences of Planning Project of Yunnan Province (Grant No. QN201210), and Introduction of Talents Project of Science Research Foundation of Yunnan University of Finance and Economics (Grant No. YC2012D07). The author would like to thank the anonymous reviewers and the editors for their suggestions.

Conflicts of Interest

The author declares no conflict of interest.

References

  1. Liu, K.; Shan, Z.; Wang, J.; He, J.; Zhang, Z.; Qin, Y. Overview on major research plan of trustworthy software. Sci. Found. China 2008, 22, 145–151. [Google Scholar]
  2. Xiong, G.; Chang, Z.; Sang, N. Survey on dependable computing. J. Comput. Appl 2009, 29, 915–920. [Google Scholar]
  3. Xiong, W.; Wang, J.; Cai, M. Trustworty software evaluation based on QFD. Appl. Res. Comput 2010, 27, 2991–2994. [Google Scholar]
  4. Sun, C.; Jin, M.; Liu, C. Overviews on Software Architecture Research. J. Softw 2010, 27, 2991–2994. [Google Scholar]
  5. Perry, D. Software Engineering and Software Architecture. Proceedings of the International Conference on Software Theory and Practice, Beijing, China, 7 January 2000; Electronic Industry Press: Beijing, China, 2000; pp. 1–4. [Google Scholar]
  6. Boehm, B. Engineering Context for Software Architecture. Proceedings of the 1st International Workshop on Architecture for Software Systems, Seattle, Seattle, WA, USA, 3 July 1995; ACM Press: New York, NY, USA, 1995; pp. 1–8. [Google Scholar]
  7. Zhou, X.; Huang, H.; Sun, J.; Yan, X. An introduction to software architecture quality evaluation. Comput. Sci 2003, 3, 49–52. [Google Scholar]
  8. Laprie, J.C. Dependable computing and fault tolerance: Concepts and Terminology. Proceedings of the 15th IEEE Symposium on Fault Tolerant Computing Systems, Toulouse, France, 17 July 1985; IEEE Computer Society: New York, NY, USA, 1985; pp. 2–11. [Google Scholar]
  9. Trusted Computing Group, Specification Architecture Overview. In Specification Revision 1.4; Trusted Computing Group: Beaverton, OR, USA, 2007.
  10. NSTC. Research Challenges in High Confidence Systems. Proceedings of the Committee on Computing, Information, and Communications Workshop, New York, NY, USA, 6–7 August 1997.
  11. Suri, N.; Jhumka, A.; Hiller, M.; Pataricza, A.; Islam, S.; Sarbu, C. A software integration approach for designing and assessing dependable embedded systems. J. Syst. Softw 2010, 83, 1780–1800. [Google Scholar]
  12. Shin, Y.; Choi, Y.; Lee, W.J. Integration testing through reusing representative unit test cases for high-confidence medical software. Comput. Biol. Med 2013, 43, 434–443. [Google Scholar]
  13. Oza, N.V.; Hall, T.; Rainer, A.; Grey, S. Trust in software outsourcing relationships: An empirical investigation of Indian software companies. Inf. Softw. Technol 2006, 48, 345–354. [Google Scholar]
  14. Babar, A.M.; Verner, J.M.; Nguyen, P.T. Establishing and maintaining trust in software outsourcing relationships: An empirical investigation. J. Syst. Softw 2007, 80, 1438–1449. [Google Scholar]
  15. Sheikh, I.; Ahamed, M.Z.; Wolfe, S. A software-based trust framework for distributed industrial management systems. J. Syst. Softw 2007, 80, 1621–1630. [Google Scholar]
  16. Garlan, D.; Perry, E. Introduction to the Special Issue on Software Architecture. IEEE Trans. Softw. Eng 1995, 21, 269–274. [Google Scholar]
  17. Shaw, M.; Garlan, D. Software Architecture: Perspectives on an Emerging Discipline; Prentice Hall: Upper Saddle River, NJ, USA, 1996. [Google Scholar]
  18. Garlan, D.; Shaw, M. An Introduction to Software Architecture. In Carnegie Mellon University Software Engineering Institute Technical Report; CMU/SEI-94-TR-21; Carnegie Mellon University: Pittsburgh, PA, USA, 1994. [Google Scholar]
  19. Richard, E.; Creps, M.A.S. The STARS Conceptual Framework for Reuse Processes; STARS Program Technical Report; STARS: Philadelphia, PA, USA, 1996. [Google Scholar]
  20. Rugina, A.-E.; Kanoun, K.; Kaâniche, M. A System Dependability Modeling Framework Using AADL and GSPNs. In Architecting Dependable Systems; Springer: Berlin, Germany, 2007; pp. 14–38. [Google Scholar]
  21. Feiler, P.; Rugina, A. Dependability Modeling with the Architecture Analysis & Design Language; CMU/SEI-2007-TN-043; Carnegie Mellon: Pittsburgh, PA, USA, 2007. [Google Scholar]
  22. Anjos, J.M.S.; Coracini, G.K.; Villani, E. A proposal and verification of a software architecture based on LabVIEW for a multifunctional robotic end-effector. Adv. Eng. Softw 2013, 55, 32–44. [Google Scholar]
  23. Weinreich, R.; Buchgeher, G. Towards supporting the software architecture life cycle. J. Syst. Softw 2012, 85, 546–561. [Google Scholar]
  24. Kazman, R.; Gagliardi, M.; Wood, W. Scaling up software architecture analysis. J. Syst. Softw 2012, 85, 1511–1519. [Google Scholar]
  25. Li, Z.; Liang, P.; Avgeriou, P. Application of knowledge-based approaches in software architecture: A systematic mapping study. Inf. Softw. Technol 2013, 55, 777–794. [Google Scholar]
  26. Breivold, H.P.; Crnkovic, I.; Larsson, M. A systematic review of software architecture evolution research. Inf. Soft. Technol 2012, 54, 16–40. [Google Scholar]
  27. Ding, S.; Yang, S.-L.; Fu, C. A novel evidential reasoning based method for software trustworthiness evaluation under the uncertain and unreliable environment. Expert Syst. Appl 2012, 39, 2700–2709. [Google Scholar]
  28. Schmidt, S.; Steele, R.; Dillon, T.S.; Chang, E. Fuzzy trust evaluation and credibility development in multi-agent systems. Appl. Soft Comput 2007, 7, 492–505. [Google Scholar]
  29. Zarandi, H.R.; Miremadi, S.G. Dependability evaluation of Altera FPGA-based embedded systems subjected to SEUs. Microelectron. Reliab 2007, 47, 461–470. [Google Scholar]
  30. Bischofs, L.; Giesecke, S.; Gottschalk, M.; Hasselbring, W.; Warns, T.; Willer, S. Comparative evaluation of dependability characteristics for peer-to-peer architectural styles by simulation. J. Syst. Softw 2006, 79, 1419–1432. [Google Scholar]
  31. Lang, B.; Liu, X.; Wang, H.; Xie, B.; Mao, X. A Classification Model for Software Trustworthiness. J. Front. Comput. Sci. Technol 2010, 4, 231–239. [Google Scholar]
  32. Zhao, H.; Sun, J. An Algebraic Model of Service Oriented Trustworthy Software Architecture. Chin. J. Comput 2010, 33, 890–899. (In Chinese) [Google Scholar]
  33. Avizienis, A.; Laprie, J.-C.; Randell, B.; Landwehr, C. Basic Concepts and Taxonomy of Dependable and Secure Computing. IEEE Trans. Depend. Secur. Comput 2004, 1, 11–33. [Google Scholar]
  34. Albin, S.T. The Art of Software Architecture: Design Methods and Techniques; John Wiley & Sons Publishing: Indianapolis, IN, USA, 2003. [Google Scholar]
  35. Dang, L. Grey Decision-Making Analytic Methods; Huanghe Hydraulic and Power Press: Zhengzhou, China, 2005. (In Chinese) [Google Scholar]
  36. Jaynes, E.T. Information theory and statistical mechanics. Phys. Rev 1957, 106, 620–630. [Google Scholar]
  37. Xue, F. No-life Insurance Pricing Research Based on Information Entropy Method. Ph.D. Thesis, Dalian University of Technology, Dalian, China, 21 October 2008. [Google Scholar]
Figure 1. Trustworthiness attribute model of a software architecture.
Entropy 16 04818f1
Table 1. The evaluation expert d1 gave the grey fuzzy relation matrix.
x1x2x3x4
u1(0.35,0.1)(0.7,0.2)(0.95,0.15)(0.85,0.2)
u2(0.75,0.3)(0.7,0.25)(0.4,0)(0.75,0)
u3(0.85,0.15)(0.8,0)(0.95,0)(0.6,0.3)
u4(0.8,0.15)(0.7,0.1)(0.5,0)(0.5,0.3)
u5(0.75,0.3)(0.45,0.25)(0.5,0.3)(0.75,0.15)
u6(0.45,0.25)(0.55,0.15)(0.3,0.2)(0.55,0.15)
u7(0.65,0.05)(0.9,0.25)(0.35,0.05)(0.9,0.25)
u8(0.8,0.3)(0.6,0.3)(0.95,0.3)(0.45,0.3)
u9(0.65,0.3)(0.6,0.1)(0.75,0.25)(0.65,0.1)
u10(0.55,0.3)(0.4,0.3)(0.9,0)(0.55,0.05)
u11(0.75,0)(0.4,0.1)(0.4,0.25)(0.85,0)
u12(0.7,0.05)(0.75,0.3)(0.4,0)(0.5,0)
u13(0.65,0.15)(0.8,0.25)(0.55,0.2)(0.3,0.3)
Table 2. The evaluation expert d2 gave the grey fuzzy relation matrix.
x1x2x3x4
u1(0.5,0.05)(0.3,0.25)(0.45,0)(0.55,0.2)
u2(0.65,0.25)(0.4,0.25)(0.9,0)(0.8,0.25)
u3(0.85,0.25)(0.55,0.3)(0.75,0.2)(0.45,0.05)
u4(0.65,0.3)(0.35,0.05)(0.85,0.3)(0.5,0.25)
u5(0.4,0.25)(0.85,0.3)(0.95,0.15)(0.85,0.15)
u6(0.8,0.25)(0.75,0.2)(0.7,0.3)(0.8,0.05)
u7(0.8,0.3)(0.65,0.2)(0.85,0.1)(0.3,0.15)
u8(0.85,0.25)(0.8,0)(0.35,0.15)(0.95,0)
u9(0.35,0.1)(0.3,0.1)(0.45,0)(0.45,0.2)
u10(0.8,0.2)(0.8,0.2)(0.8,0.3)(0.6,0.3)
u11(0.35,0.1)(0.9,0.2)(0.45,0)(0.5,0.05)
u12(0.5,0.05)(0.3,0)(0.55,0)(0.35,0.25)
u13(0.8,0.25)(0.3,0.3)(0.7,0)(0.5,0.1)
Table 3. The evaluation expert d3 gave the grey fuzzy relation matrix.
x1x2x3x4
u1(0.7,0.05)(0.8,0.1)(0.65,0.3)(0.35,0.3)
u2(0.75,0)(0.85,0.15)(0.35,0.05)(0.95,0.25)
u3(0.75,0.1)(0.85,0.2)(0.65,0.15)(0.55,0.15)
u4(0.75,0.05)(0.95,0.05)(0.4,0)(0.65,0.25)
u5(0.3,0.2)(0.5,0.15)(0.45,0.15)(0.5,0.25)
u6(0.5,0.2)(0.75,0.2)(0.8,0.25)(0.9,0.3)
u7(0.4,0.3)(0.35,0.2)(0.65,0.15)(0.95,0.1)
u8(0.65,0.1)(0.75,0)(0.5,0.15)(0.65,0.2)
u9(0.5,0.25)(0.45,0.05)(0.9,0.3)(0.45,0.25)
u10(0.3,0.15)(0.55,0.15)(0.95,0.25)(0.9,0.15)
u11(0.8,0)(0.3,0.05)(0.95,0.05)(0.7,0.2)
u12(0.4,0.3)(0.85,0.05)(0.8,0.15)(0.3,0.2)
u13(0.65,0.1)(0.8,0.1)(0.5,0)(0.65,0.1)
Table 4. The evaluation expert d4 gave the grey fuzzy relation matrix.
x1x2x3x4
u1(0.4,0.3)(0.8,0.15)(0.35,0.3)(0.9,0.2)
u2(0.9,0.3)(0.4,0.05)(0.7,0.2)(0.55,0.2)
u3(0.8,0.05)(0.8,0)(0.75,0.05)(0.65,0.2)
u4(0.35,0.2)(0.45,0.05)(0.6,0.05)(0.6,0)
u5(0.95,0.05)(0.45,0.3)(0.8,0.15)(0.85,0.2)
u6(0.85,0.1)(0.5,0.15)(0.95,0)(0.35,0.05)
u7(0.5,0.25)(0.75,0.1)(0.75,0.05)(0.8,0.25)
u8(0.6,0)(0.5,0.05)(0.3,0.05)(0.75,0.15)
u9(0.9,0)(0.45,0.1)(0.85,0.1)(0.6,0.3)
u10(0.45,0.3)(0.65,0.3)(0.5,0.1)(0.9,0.05)
u11(0.45,0.1)(0.6,0.2)(0.8,0.2)(0.55,0.15)
u12(0.55,0.2)(0.95,0.15)(0.7,0.2)(0.65,0.25)
u13(0.65,0.15)(0.85,0.2)(0.9,0)(0.9,0.1)
Table 5. The evaluation expert d5 gave the grey fuzzy relation matrix.
x1x2x3x4
u1(0.85,0.1)(0.4,0.15)(0.4,0.05)(0.7,0.15)
u2(0.9,0.05)(0.95,0.05)(0.35,0)(0.3,0.1)
u3(0.65,0.15)(0.55,0.15)(0.8,0.2)(0.75,0)
u4(0.8,0.3)(0.8,0.05)(0.65,0.2)(0.95,0.2)
u5(0.6,0)(0.8,0.25)(0.7,0.25)(0.6,0.2)
u6(0.85,0.3)(0.6,0.25)(0.75,0.05)(0.6,0)
u7(0.95,0.1)(0.35,0.15)(0.8,0.2)(0.55,0.2)
u8(0.55,0.3)(0.75,0.1)(0.35,0.15)(0.75,0)
u9(0.3,0)(0.4,0.2)(0.85,0.15)(0.45,0.25)
u10(0.85,0.1)(0.5,0.15)(0.55,0.2)(0.55,0.15)
u11(0.65,0.3)(0.8,0.2)(0.3,0)(0.65,0.05)
u12(0.6,0.2)(0.9,0.3)(0.35,0.05)(0.3,0.25)
u13(0.95,0.15)(0.65,0.1)(0.75,0.3)(0.45,0.3)
Table 6. The grey fuzzy relation matrix of group evaluation expert.
x1x2x3x4
u1(0.59,0.32)(0.68,0.41)(0.67,0.47)(0.49,0.52)
u2(0.73,0.37)(0.73,0.45)(0.47,0.29)(0.88,0.46)
u3(0.79,0.4)(0.78,0.44)(0.73,0.39)(0.54,0.42)
u4(0.74,0.38)(0.78,0.32)(0.51,0.32)(0.59,0.52)
u5(0.41,0.49)(0.56,0.46)(0.56,0.44)(0.62,0.47)
u6(0.55,0.48)(0.71,0.45)(0.68,0.51)(0.81,0.48)
u7(0.53,0.51)(0.52,0.47)(0.63,0.38)(0.81,0.4)
u8(0.72,0.43)(0.73,0.32)(0.56,0.44)(0.67,0.44)
u9(0.5,0.49)(0.45,0.33)(0.78,0.49)(0.49,0.47)
u10(0.45,0.45)(0.57,0.45)(0.91,0.47)(0.77,0.42)
u11(0.7,0.28)(0.44,0.35)(0.74,0.34)(0.69,0.39)
u12(0.48,0.46)(0.72,0.35)(0.67,0.35)(0.35,0.43)
u13(0.68,0.4)(0.7,0.43)(0.55,0.3)(0.55,0.4)
Table 7. The evaluation expert d1 gave the grey fuzzy relation matrix.
x1x2x3
u1(0.85,0.15)(0.9,0.25)(0.45,0.25)
u2(0.65,0)(0.55,0.2)(0.5,0.2)
u3(0.55,0.25)(0.4,0.05)(0.9,0.3)
u4(0.75,0.2)(0.65,0.1)(0.55,0)
u5(0.8,0.1)(0.5,0)(0.9,0.05)
u6(0.35,0.25)(0.95,0.1)(0.75,0)
u7(0.55,0.25)(0.85,0.25)(0.45,0.3)
u8(0.7,0.2)(0.4,0.3)(0.95,0)
u9(0.95,0.05)(0.4,0.05)(0.35,0)
u10(0.7,0.1)(0.5,0.05)(0.75,0.05)
u11(0.9,0.1)(0.6,0.25)(0.4,0.05)
u12(0.6,0.15)(0.6,0.2)(0.55,0.1)
u13(0.55,0.2)(0.55,0.2)(0.7,0.15)
Table 8. The evaluation expert d2 gave the grey fuzzy relation matrix.
x1x2x3
u1(0.85,0.1)(0.5,0.25)(0.9,0.2)
u2(0.9,0.05)(0.95,0.25)(0.45,0.05)
u3(0.65,0.2)(0.35,0.05)(0.95,0.05)
u4(0.85,0.05)(0.75,0.05)(0.5,0)
u5(0.75,0.25)(0.65,0.1)(0.45,0)
u6(0.75,0.3)(0.45,0.2)(0.35,0.15)
u7(0.5,0.15)(0.75,0.1)(0.7,0.25)
u8(0.7,0.3)(0.9,0.05)(0.55,0)
u9(0.35,0.1)(0.45,0.15)(0.45,0)
u10(0.85,0.15)(0.3,0.25)(0.55,0.25)
u11(0.85,0.15)(0.65,0.3)(0.3,0.25)
u12(0.85,0)(0.65,0.3)(0.7,0.2)
u13(0.65,0.1)(0.5,0.05)(0.7,0.15)
Table 9. The evaluation expert d3 gave the grey fuzzy relation matrix.
x1x2x3
u1(0.85,0)(0.6,0)(0.7,0.05)
u2(0.85,0.1)(0.5,0.3)(0.65,0.1)
u3(0.8,0.1)(0.35,0.05)(0.75,0.15)
u4(0.5,0.3)(0.65,0.1)(0.4,0.3)
u5(0.85,0.05)(0.55,0.25)(0.5,0)
u6(0.9,0.1)(0.7,0.25)(0.4,0.05)
u7(0.6,0.3)(0.65,0.25)(0.95,0.3)
u8(0.3,0.3)(0.5,0.2)(0.8,0.25)
u9(0.7,0.15)(0.7,0.1)(0.8,0.3)
u10(0.5,0.15)(0.9,0.3)(0.9,0.15)
u11(0.7,0.15)(0.85,0)(0.45,0.2)
u12(0.65,0)(0.65,0.25)(0.4,0.15)
u13(0.65,0.3)(0.6,0)(0.7,0.2)
Table 10. The evaluation expert d4 gave the grey fuzzy relation matrix.
x1x2x3
u1(0.85,0.15)(0.45,0)(0.65,0.25)
u2(0.45,0)(0.85,0.2)(0.6,0.15)
u3(0.6,0.05)(0.9,0.05)(0.7,0)
u4(0.6,0.15)(0.45,0.05)(0.6,0.05)
u5(0.3,0.2)(0.7,0.2)(0.5,0.15)
u6(0.45,0)(0.5,0)(0.7,0.25)
u7(0.55,0.3)(0.65,0.1)(0.3,0.2)
u8(0.6,0.1)(0.45,0)(0.3,0.2)
u9(0.75,0.1)(0.3,0)(0.55,0.05)
u10(0.9,0.25)(0.9,0.05)(0.55,0.3)
u11(0.95,0.25)(0.75,0.2)(0.5,0.3)
u12(0.8,0.15)(0.65,0.05)(0.55,0.3)
u13(0.9,0.05)(0.85,0)(0.6,0.05)
Table 11. The grey fuzzy relation matrix of group evaluation expert.
x1x2x3
u1(0.85,0.29)(0.61,0.31)(0.68,0.38)
u2(0.71,0.23)(0.71,0.43)(0.55,0.31)
u3(0.65,0.34)(0.5,0.24)(0.83,0.31)
u4(0.68,0.36)(0.63,0.26)(0.51,0.28)
u5(0.68,0.34)(0.6,0.33)(0.59,0.24)
u6(0.61,0.35)(0.65,0.33)(0.55,0.3)
u7(0.55,0.44)(0.73,0.36)(0.6,0.45)
u8(0.58,0.41)(0.56,0.33)(0.65,0.3)
u9(0.69,0.29)(0.46,0.26)(0.54,0.28)
u10(0.74,0.35)(0.65,0.35)(0.69,0.38)
u11(0.85,0.35)(0.71,0.38)(0.41,0.39)
u12(0.73,0.26)(0.64,0.39)(0.55,0.38)
u13(0.69,0.35)(0.63,0.25)(0.68,0.33)

