1. Introduction
In the age of developed technology, timely monitoring of the performance of ball bearings not only facilitates the advanced arrangement of maintenance schedules, but also avoids missing faults in the ball bearings due to different sound levels. This is a problem which may cause erratic operation of the ball bearings, indirectly influencing the motor efficiency, leading to power loss or jamming, which can in turn cause the motor spindle to fail. In this case, if the ball bearing is stuck, the troubleshooting will be more difficult and time consuming, thus wasting both manpower and time.
Generally, the ball bearing consists of four parts: outer ring, inner ring, balls and the cage encasing the balls for fixing the balls. The rolling friction between the balls and the inner and outer rings reduces the friction of rotating the mechanism. However, even if the bearing operates in a normal work environment, it must withstand repeated compressive stress due to repeated rolling between the balls and the inner and outer rings. This phenomenon causes material fatigue, shortening the material life. The bearing will eventually become unworkable. There are multiple fault conditions, such as wearing, jamming, and rust. In terms of the fault structures, the fault states can be divided into outer ring faults, inner ring faults, ball faults and cage faults, according to the composition of the bearing.
Recently, many studies have focused on bearing fault diagnosis, and the bearing signal interception mostly aims at the vibration signal [
1–
3], stator current [
3–
8] and sound signal [
9]. The wavelet analysis is mostly used for signal analysis [
10–
12]. The wavelet neural network [
13] transfers signals from the time domain to the frequency domain, or analyzes the normal state and fault state after Fourier transform, and extracts the characteristics. The neural network [
14] distinguishes the fault state according to the eigenvalue. Some studies use monitoring and control [
15], or even a combination of remote monitoring and neural networks [
16]. Those methods have a good fault condition recognition rate, but the frequency change of the bearing applied to motors is wide at present. In the processing of low frequency and high frequency signals, the wavelet analysis [
17] is unaware of whether the selected mother wavelet is the best. In addition, there must be more sensors to measure the physical quantities when characteristics of the wavelet transform are applied. It also causes an increase in the cost, and is likely to cause misrecognition. Furthermore, the neural network [
18] requires many learning samples for establishing the database categories. The layers of intermediate variables (hidden layer) and the speed parameter must be adjusted in the process, which is time consuming. The iteration results in a large amount of calculation, and the accuracy of the established learning samples is unknown; thus, it is shortcomings.
Due to the high misrecognition rate and long processing time of the traditional signal processing methods, this paper proposes a new method based on chaos theory, whereby the characteristics are intercepted by fractal theory [
19–
21]. Chaos theory is very sensitive to the analysis of small signals. A small difference in states could have a great influence on the two identical chaotic systems. For example, loading different initial values into the chaotic system results in completely different chaos phenomena, such as the error amount being magnified, showing the high sensitivity of a nonlinear system to small changes in the system. Using this characteristic to distinguish the bearing in different fault states not only enhances the bearing quality recognition, but also allows changes to the production line scheduling in advance in order to maximize profits.
The organization of this paper is as follows. Section 2 addresses the ball bearing test system of this study. Section 3 describes the chaos-fractal-extenics theory and its application to ball bearing fault clustering. In Section 4, the comprehensive comparison results are presented to show the effectiveness of the proposed method. Finally, the conclusions are presented in Section 5.
2. Ball Bearing Test System
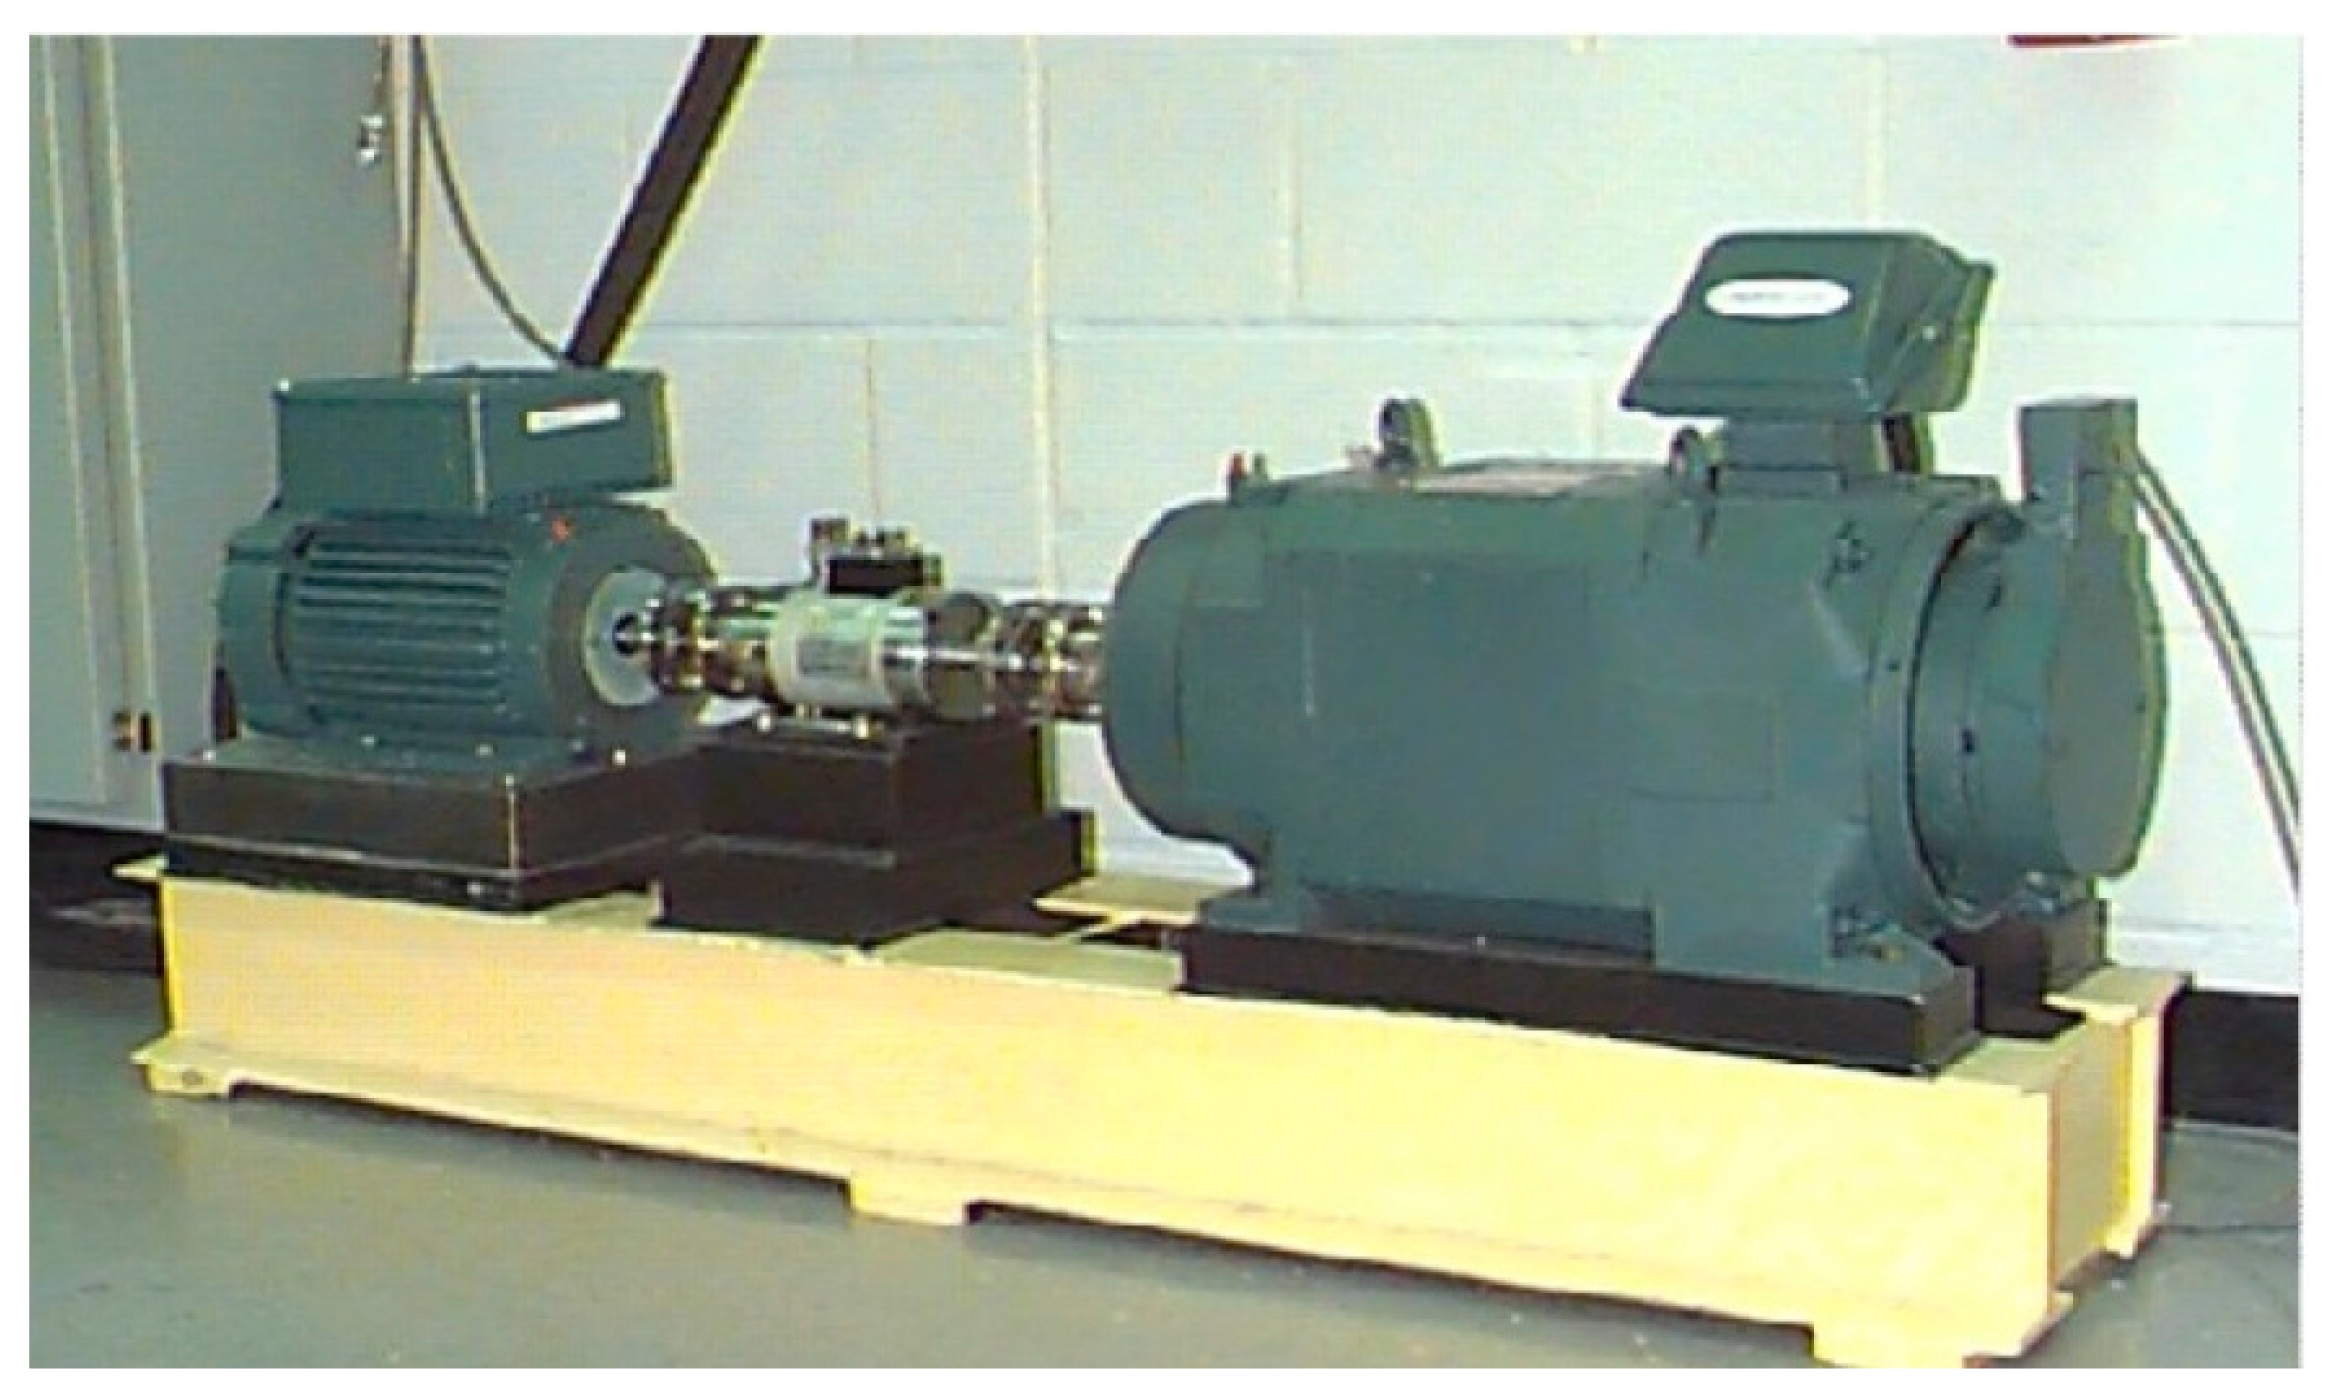
In this study, the proposed ball bearing experimental platform for measuring data is shown in
Figure 1. All the simulated data sources are derived from the U.S. Case Western Reserve University-Bearing Data Center [
22]. The laboratory provides the normal and fault ball bearing test data, and uses EDM to embed fault conditions in diameters of 7 mil, 14 mil and 21 mil and in a depth of 0.011 inch in the outer ring and inner ring raceways and balls of the bearing. A motor load of 0–3 horsepower is used for the testing.
Table 1 shows the classification of the bearing data in various states provided by this laboratory, where each fault state has three fault diameters. The fault states are tested according to the motor load 0–3 Hp, and the vibration signals of different fault states are intercepted at sampling frequencies of 12 K/48 K. The left-hand side is a 2 Hp motor, coder and motor spindle for supporting the bearing. The right-hand side is the dynamometer. For data acquisition, accelerometers were placed at the 12 o’clock position at both the drive end and fan end of the motor housing. Outer raceway faults are stationary faults; therefore, placement of the fault relative to the load zone of the bearing has a direct impact on the vibration response of the motor/bearing system. In order to quantify this effect, experiments were conducted for both fan and drive end bearings with outer raceway faults located at 3 o’clock (directly in the load zone), at 6 o’clock (orthogonal to the load zone), and at 12 o’clock. The obtained data were processed using the Matlab software [
22]. The experimental process and results use a sampling rate of 48 KHz, a fault diameter of 21 mil and a no-load fault state as examples.
3. Chaos-Fractal-Extenics Theory
The chaotic system is a nonlinear system, which is very sensitive to the initial value and small system changes. Even if there is only a slight difference between initial values, this difference is clearly reflected by the chaotic system. This characteristic can be used to compare the chaotic signals between different faults, so as to extract the required discrimination characteristics.
3.1. Data Preprocessing
The data provided by the center are intercepted, and all the data of sampling frequency 48 K of the website are used. The data of transient 1 s (0–48,000 data) resulting from motor start-up are deducted from about 240,000 raw data. The data are divided into two parts, each with about 96,000 data. One part is used for data analysis, and the other is used for the result testing.
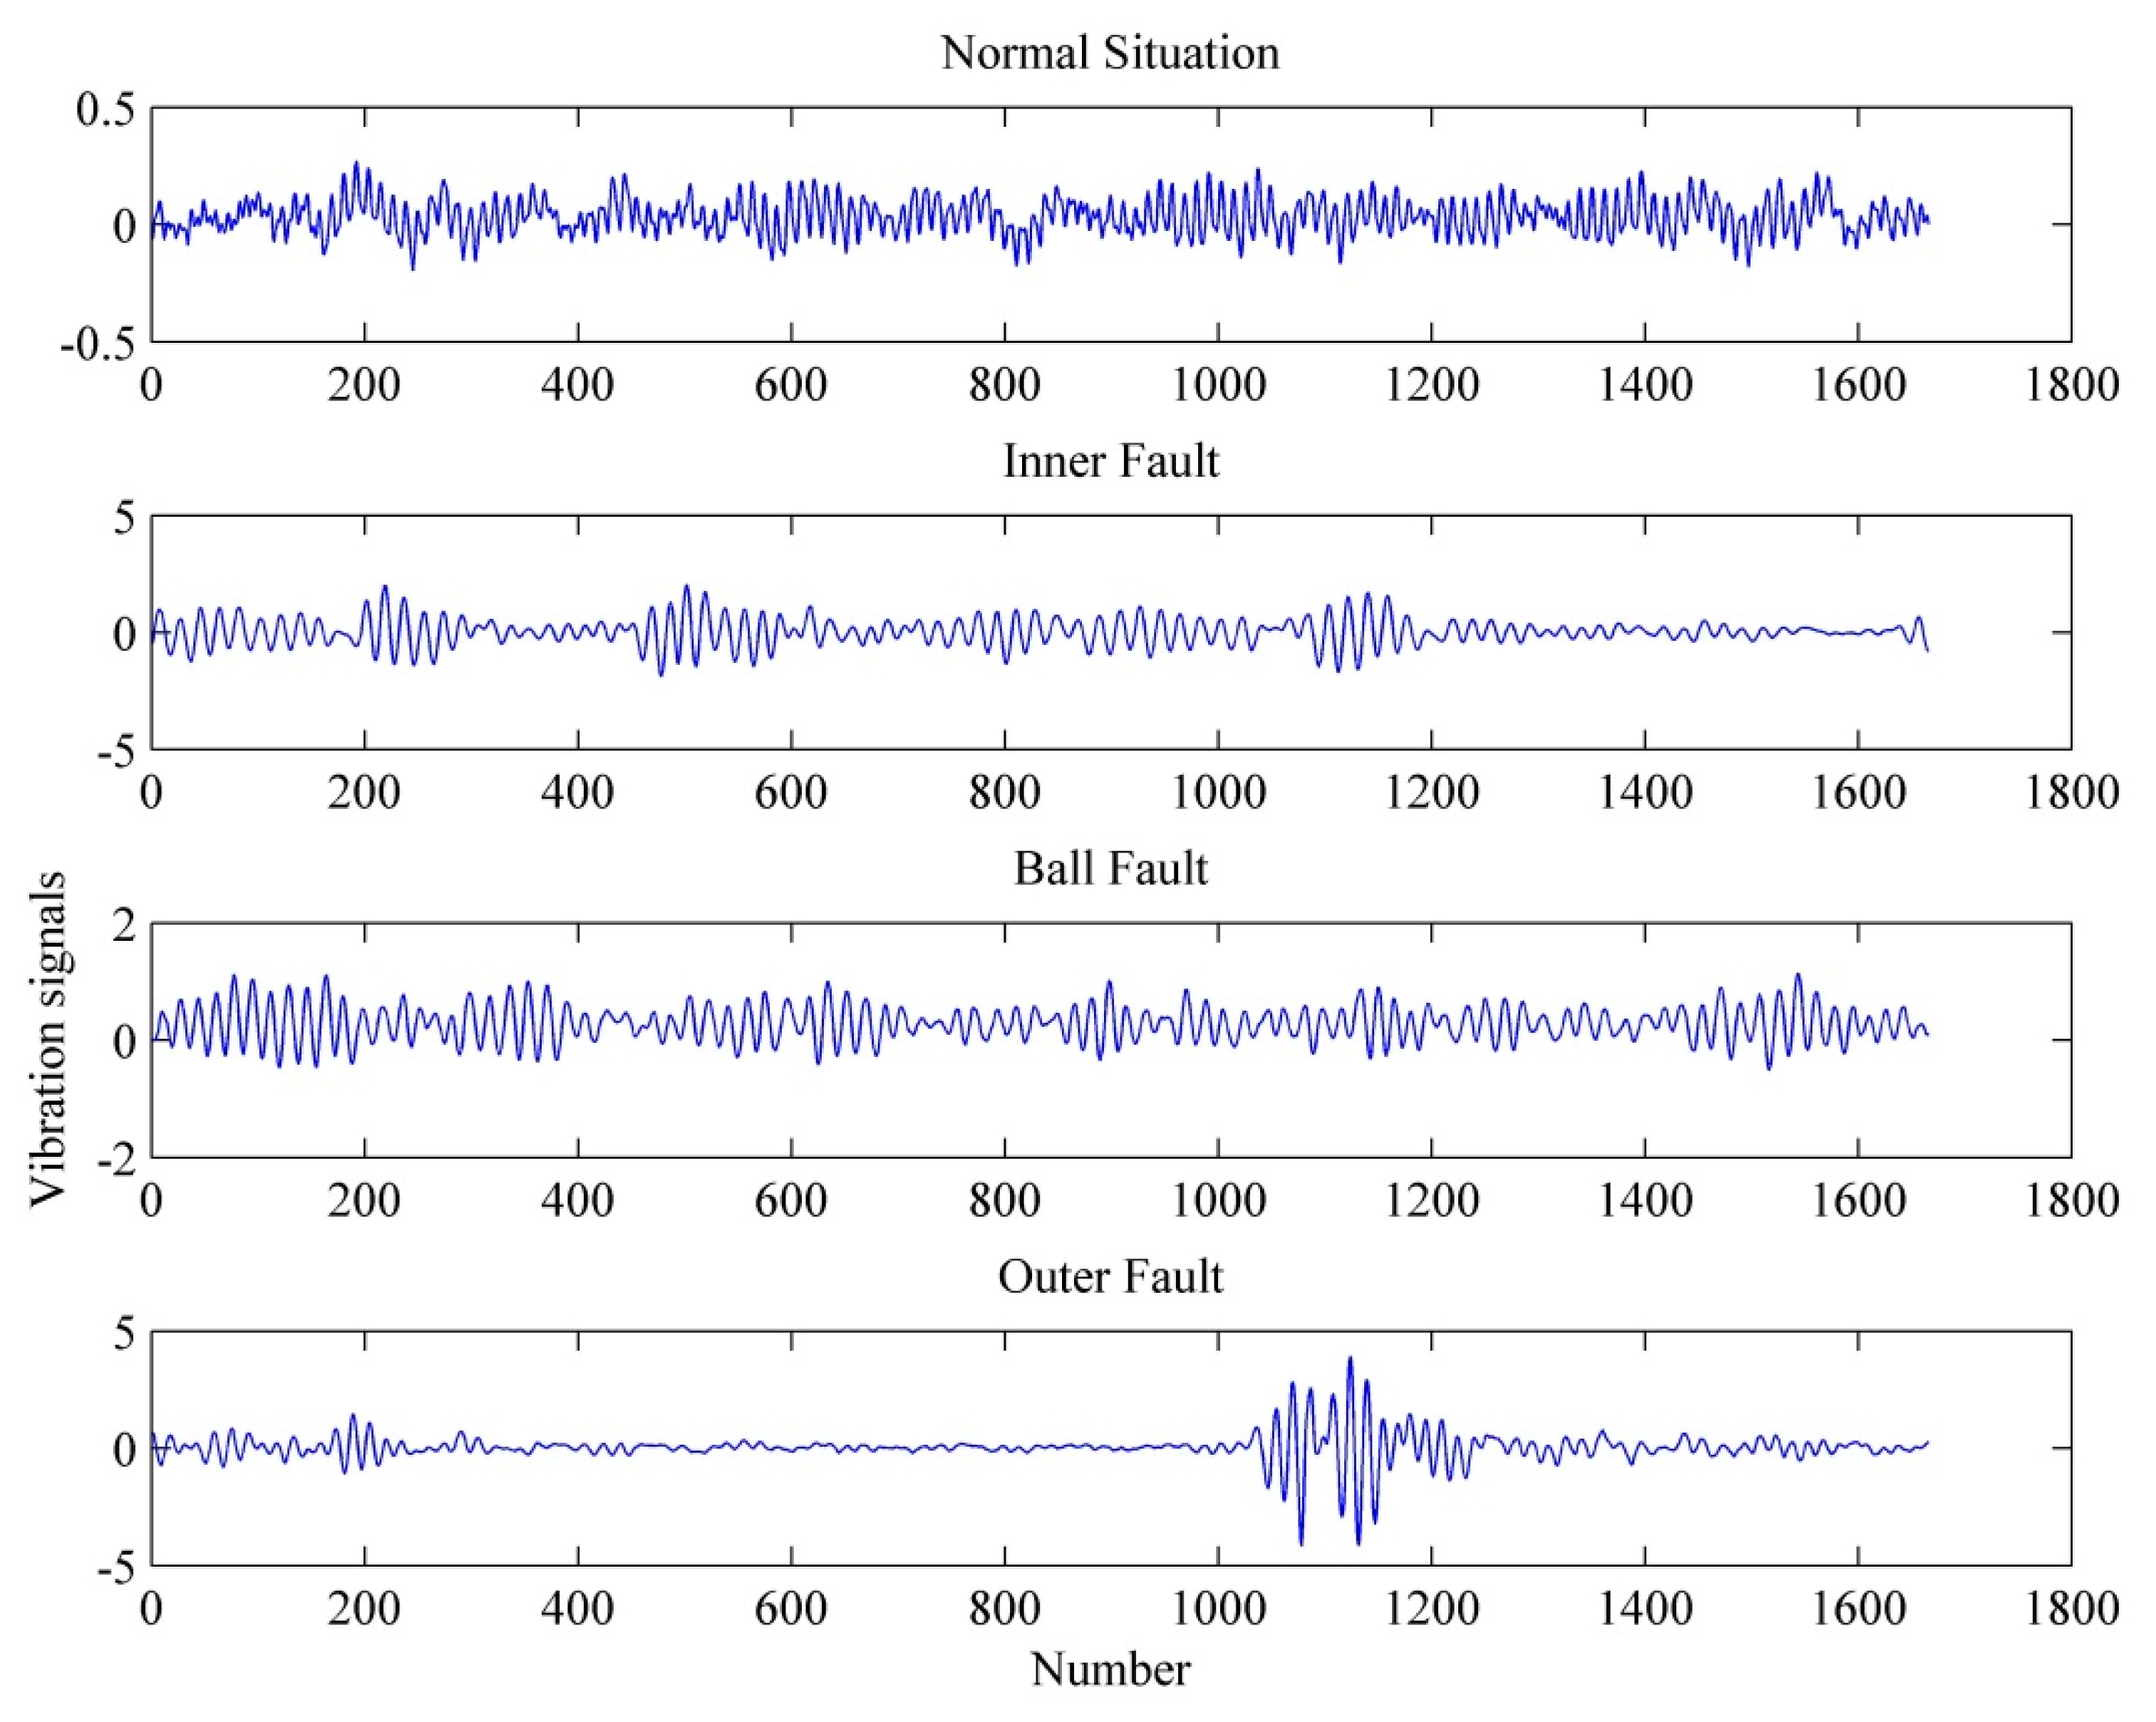
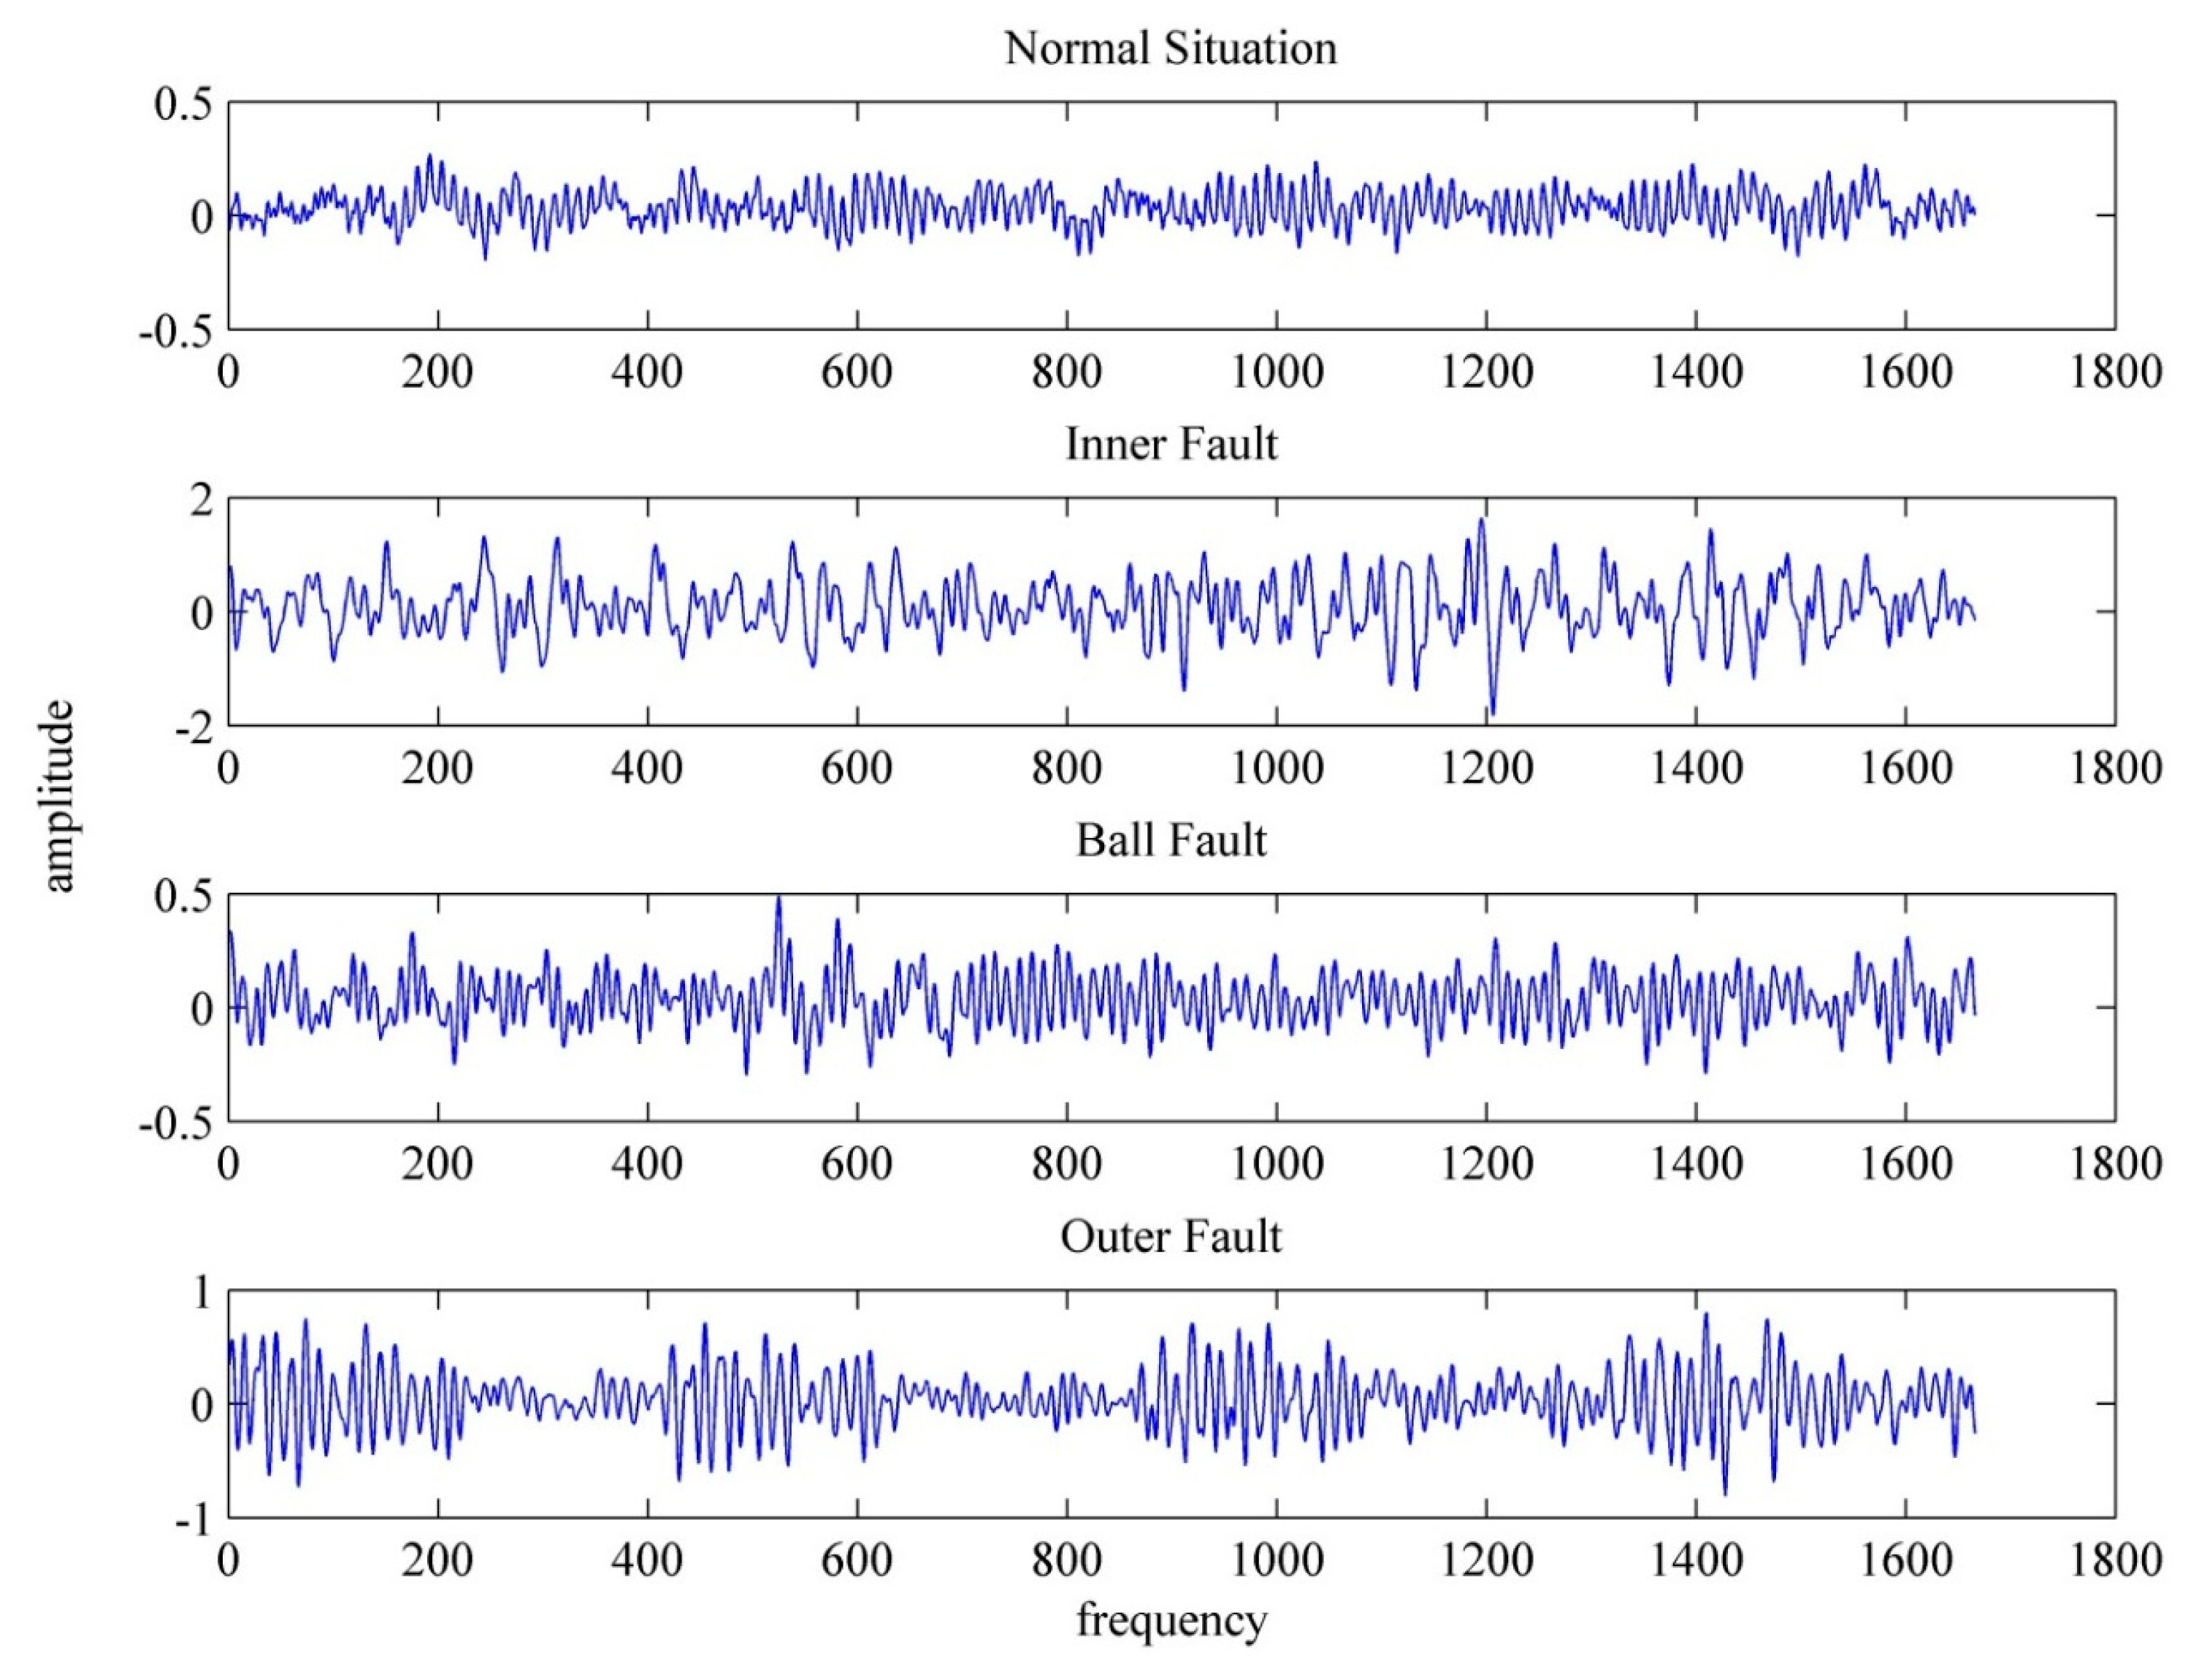
Figure 2 shows 1667 data of ball bearing vibration signals and the number of sampling points. This experiment figure only uses a fault diameter of 21 mil and various fault states (normal state, inner ring fault, ball fault, outer ring fault) when the motor is free of load. According to the aforementioned chaotic system and signal preprocessing, the starting points of the signals for analysis are sampled randomly and converted according to a sampling frequency of 48 K.
Table 2 shows the numbers of sampled data for one revolution at different motor speeds for each load. In order to make the sampled signals with a complete revolution of the motor for each load at different speeds, we need to select at least 1665 points. Otherwise, we need to reconstruct the 3-D system states from these data. Therefore, we need to use 1665 + 2 = 1667 points to guarantee that we can obtain one revolution of data for each load at different speeds. The random starting point s is taken as the first point, and the end sampling point is the (s + 1666) point.
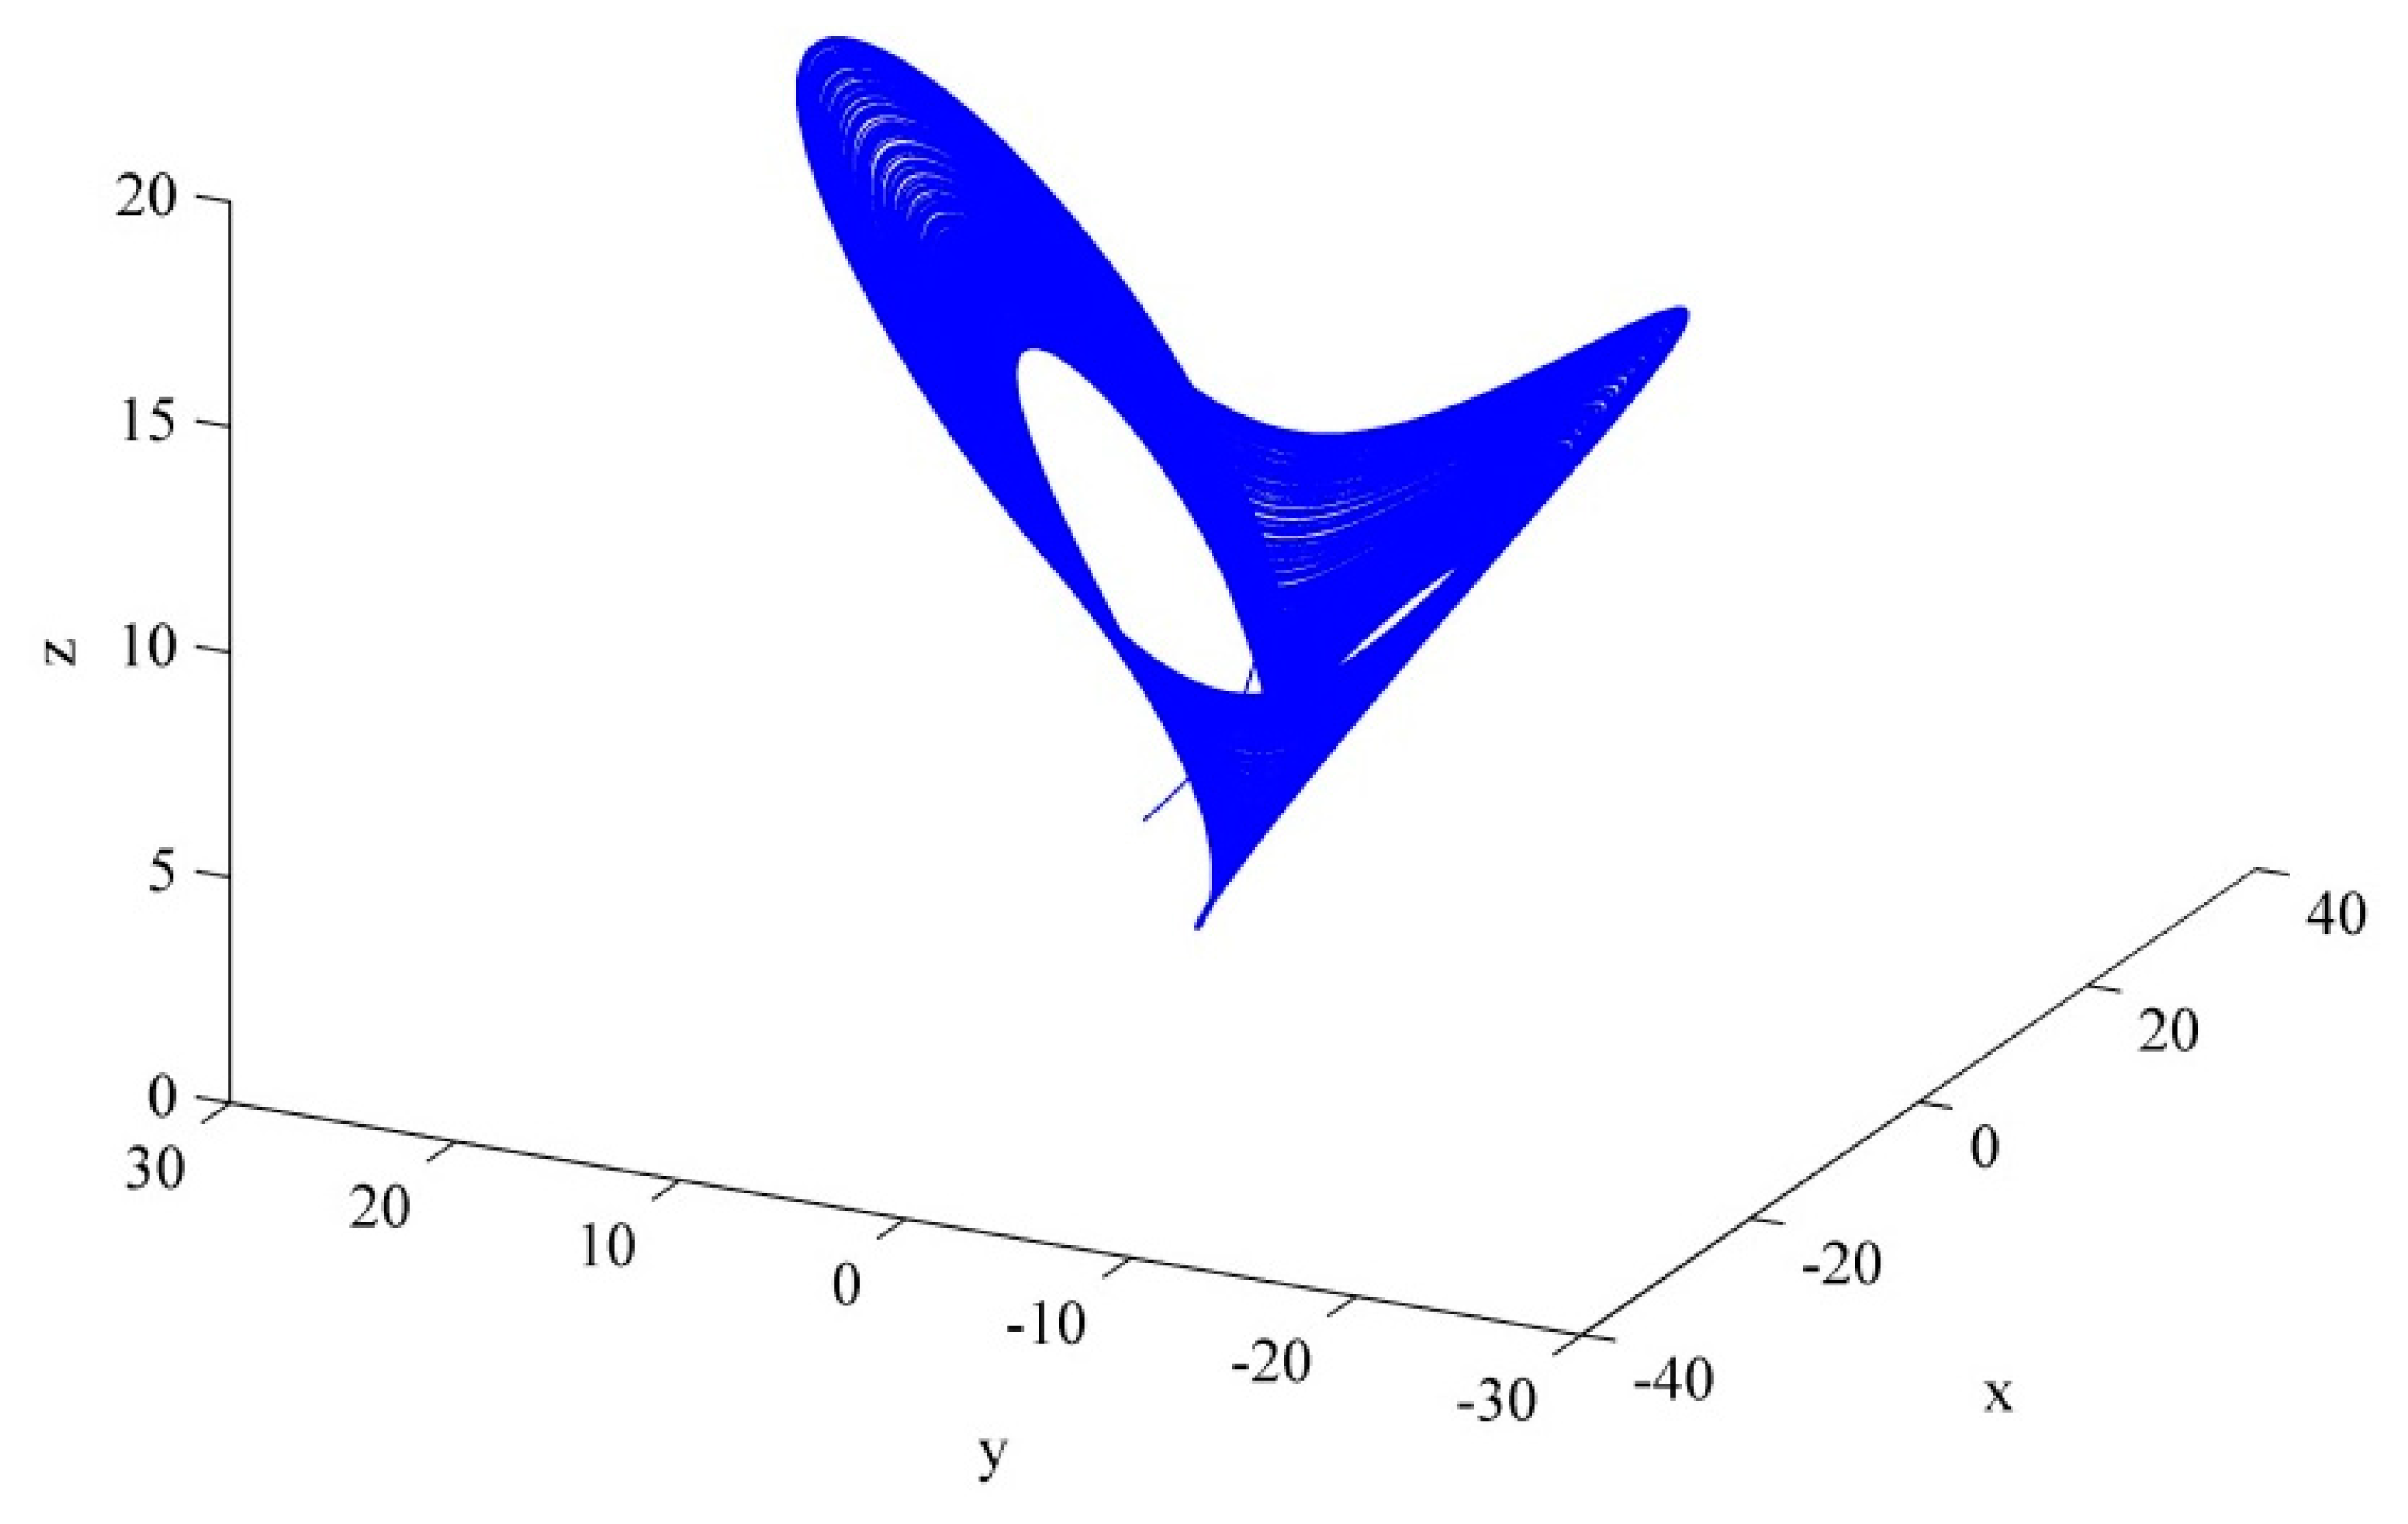
3.2. The Chen-Lee Chaos Synchronization System
This paper uses the Chen-Lee chaotic system. The system equation is [
23]:
where
a,
b and
c are the system coefficients; when they are (5, −10, −3.8), the system is proved to be a chaos phenomenon.
Figure 3 is the 3D schematic of the Chen-Lee system.
The chaos synchronization means building two chaotic systems: a master system and a slave system. The chaos synchronization system is built using the chaotic system difference between the master system and the slave system [
24]. The Chen-Lee chaotic system is used to implement chaos synchronization, expressed as
Equations (2) and
(3).
Master System:
Slave System:
In order to highlight the chaos synchronization system sensitivity to small changes in the system parameters, the chaos synchronization system in this study does not consider the use of the control effect. The parameter values are a = 5, b = −10, c = −3.8. Otherwise, in order to show the dynamic error generated by the chaotic system completely when the bearing is in different states, this paper gives the variables x1, y1 and z1 of the Master System a zero voltage signal.
The vibration signal used in this paper is one-dimensional. If the vibration signal is
x[
i],
i is the number of samples,
i = 1, 2, …, 1667 corresponds to the last data of
z2, and the vibration signal can be expressed as
x[1667].The chaotic system is a three-dimensional system. This paper uses the concept of phase space reconstruction to reconstruct the one-dimensional signal
y to be measured as a three-dimensional signal.
Equation (4) is obtained, corresponding to the vibration signal used in this paper to obtain
Equation (5).
The dynamic error of the chaotic system is obtained by subtracting the Master System from the Slave System,
i.e.,
e1 =
x1 −
x2,
e2 =
y1 −
y2,
e3 =
z1 −
z2, so as to obtain the dynamic error equation of the Chen-Lee system (
Equation (4)). The small signal amplified by chaos theory can be obtained.
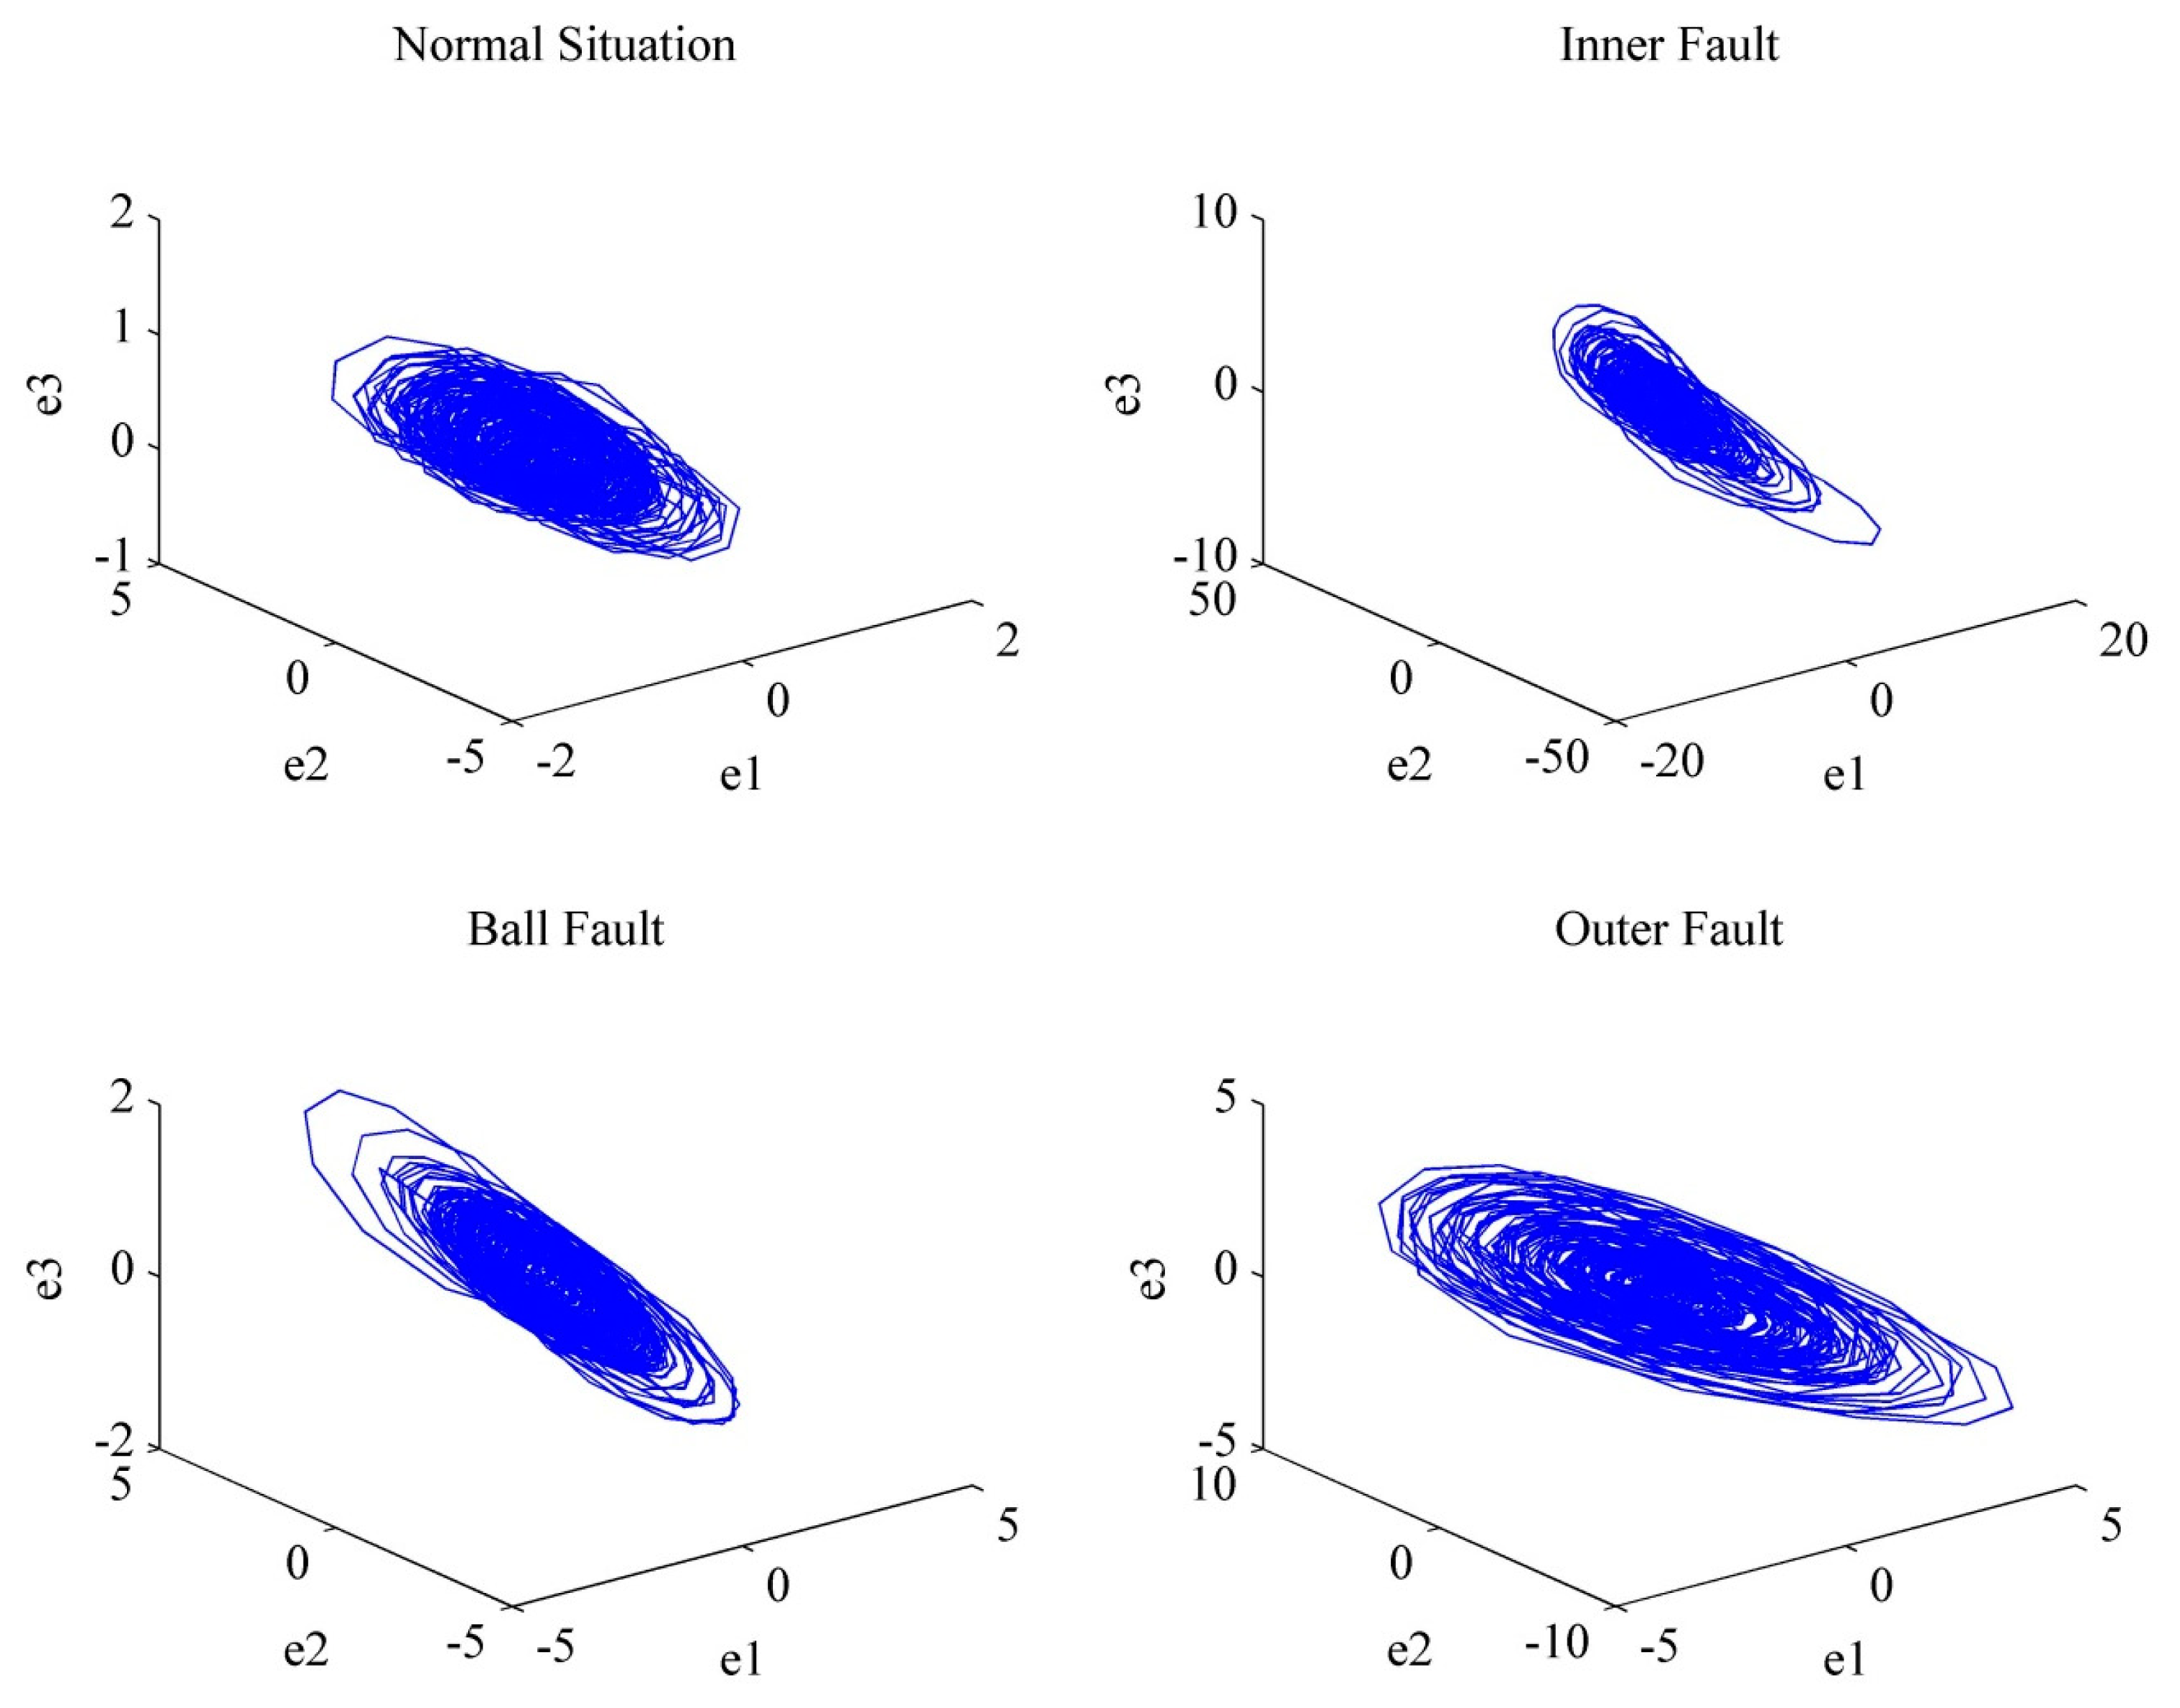
This signal is loaded into the chaos synchronization system to obtain the three-dimensional signal trajectory of normal bearing dynamic errors
ė1,
ė2 and
ė3 generated by the chaos synchronization system in
Figure 4. The differences among various states can be observed from two of them. For example,
Figure 5 uses the signals of
ė1 and
ė2 as the two-dimensional signal of normal bearing in two-dimensional motion trajectory. The master system bears a normal zero voltage signal; the slave system bears 1665 data of ball bearing signals to be measured. In the slave system,
y1 bears
Sth data to [(s + 1664) − 2]th data;
y2 bears (s + 1)th data to [(s + 1664) − 1]th data;
y3 bears (s + 2)th data to [(s + 1664)]th data.
3.3. Fractal Theory
For overall signal analysis, the mean value, RMS value and maximum value are mostly used. However, the mathematical calculation will influence and change the original signal. Thus, this paper uses fractal theory to estimate the fractal dimension and lacunarity of the signal, not only avoiding changing the original signal, but also displaying the complete analysis information of the signal [
25,
26].
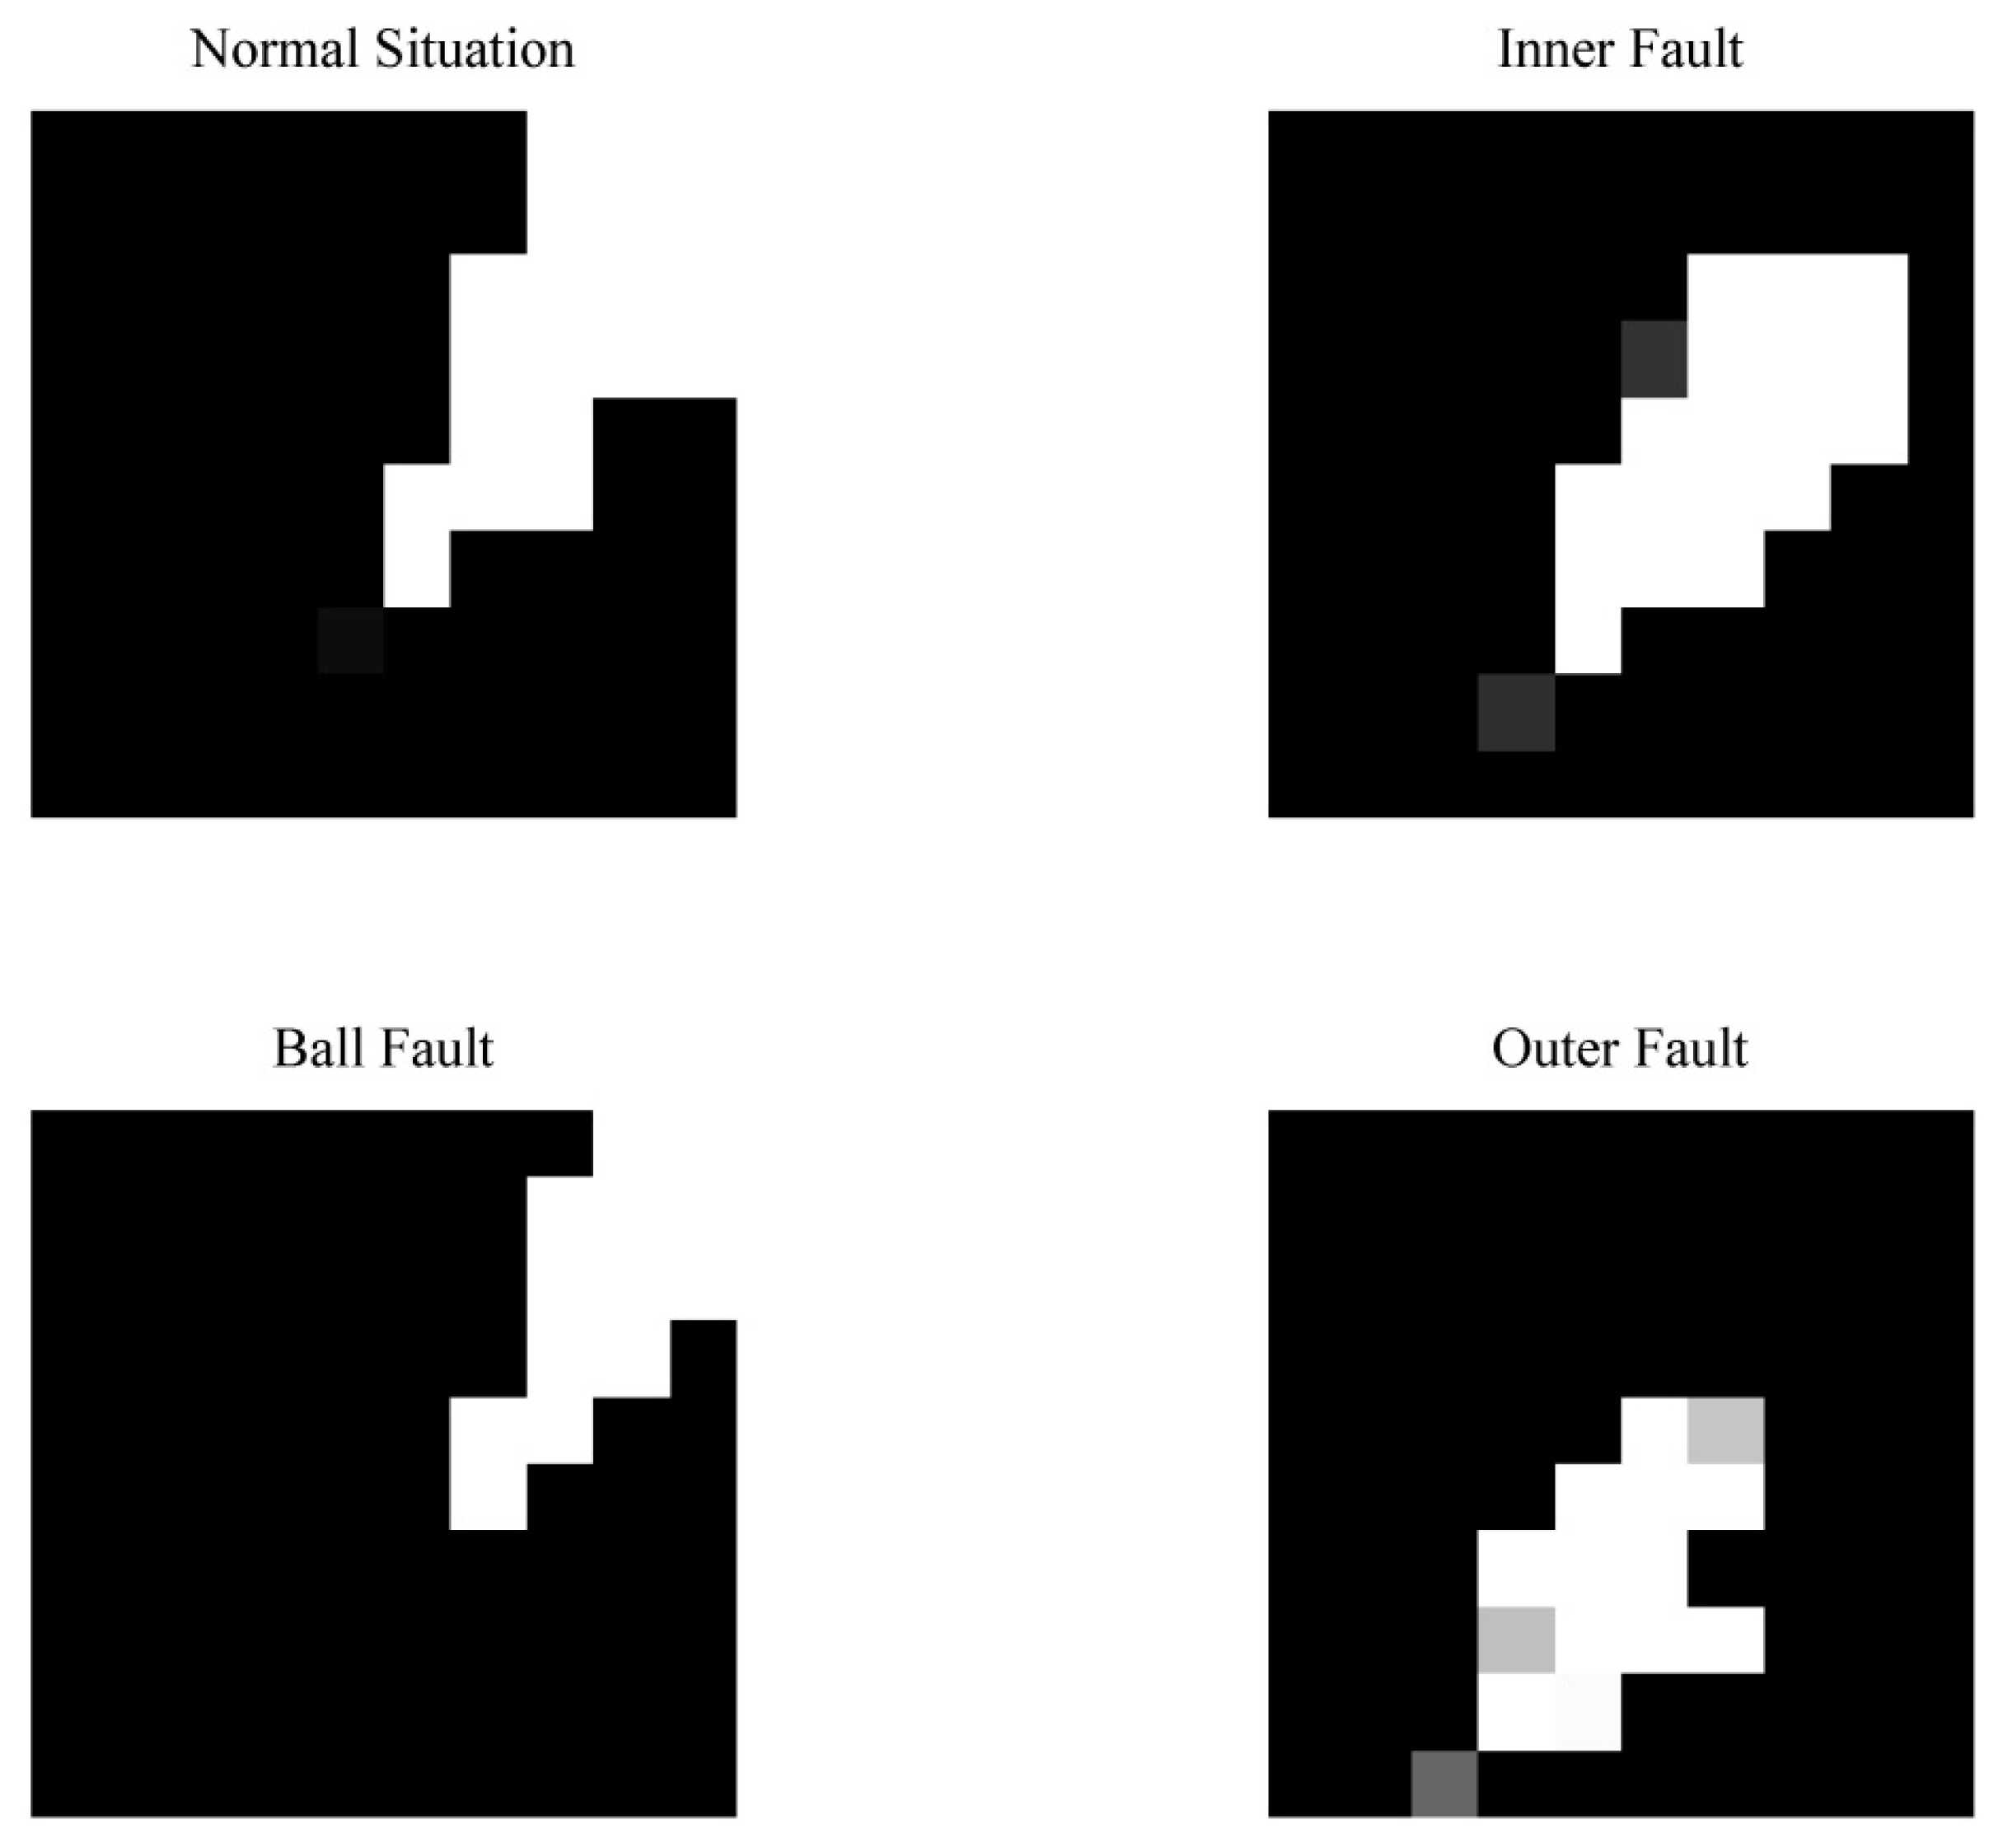
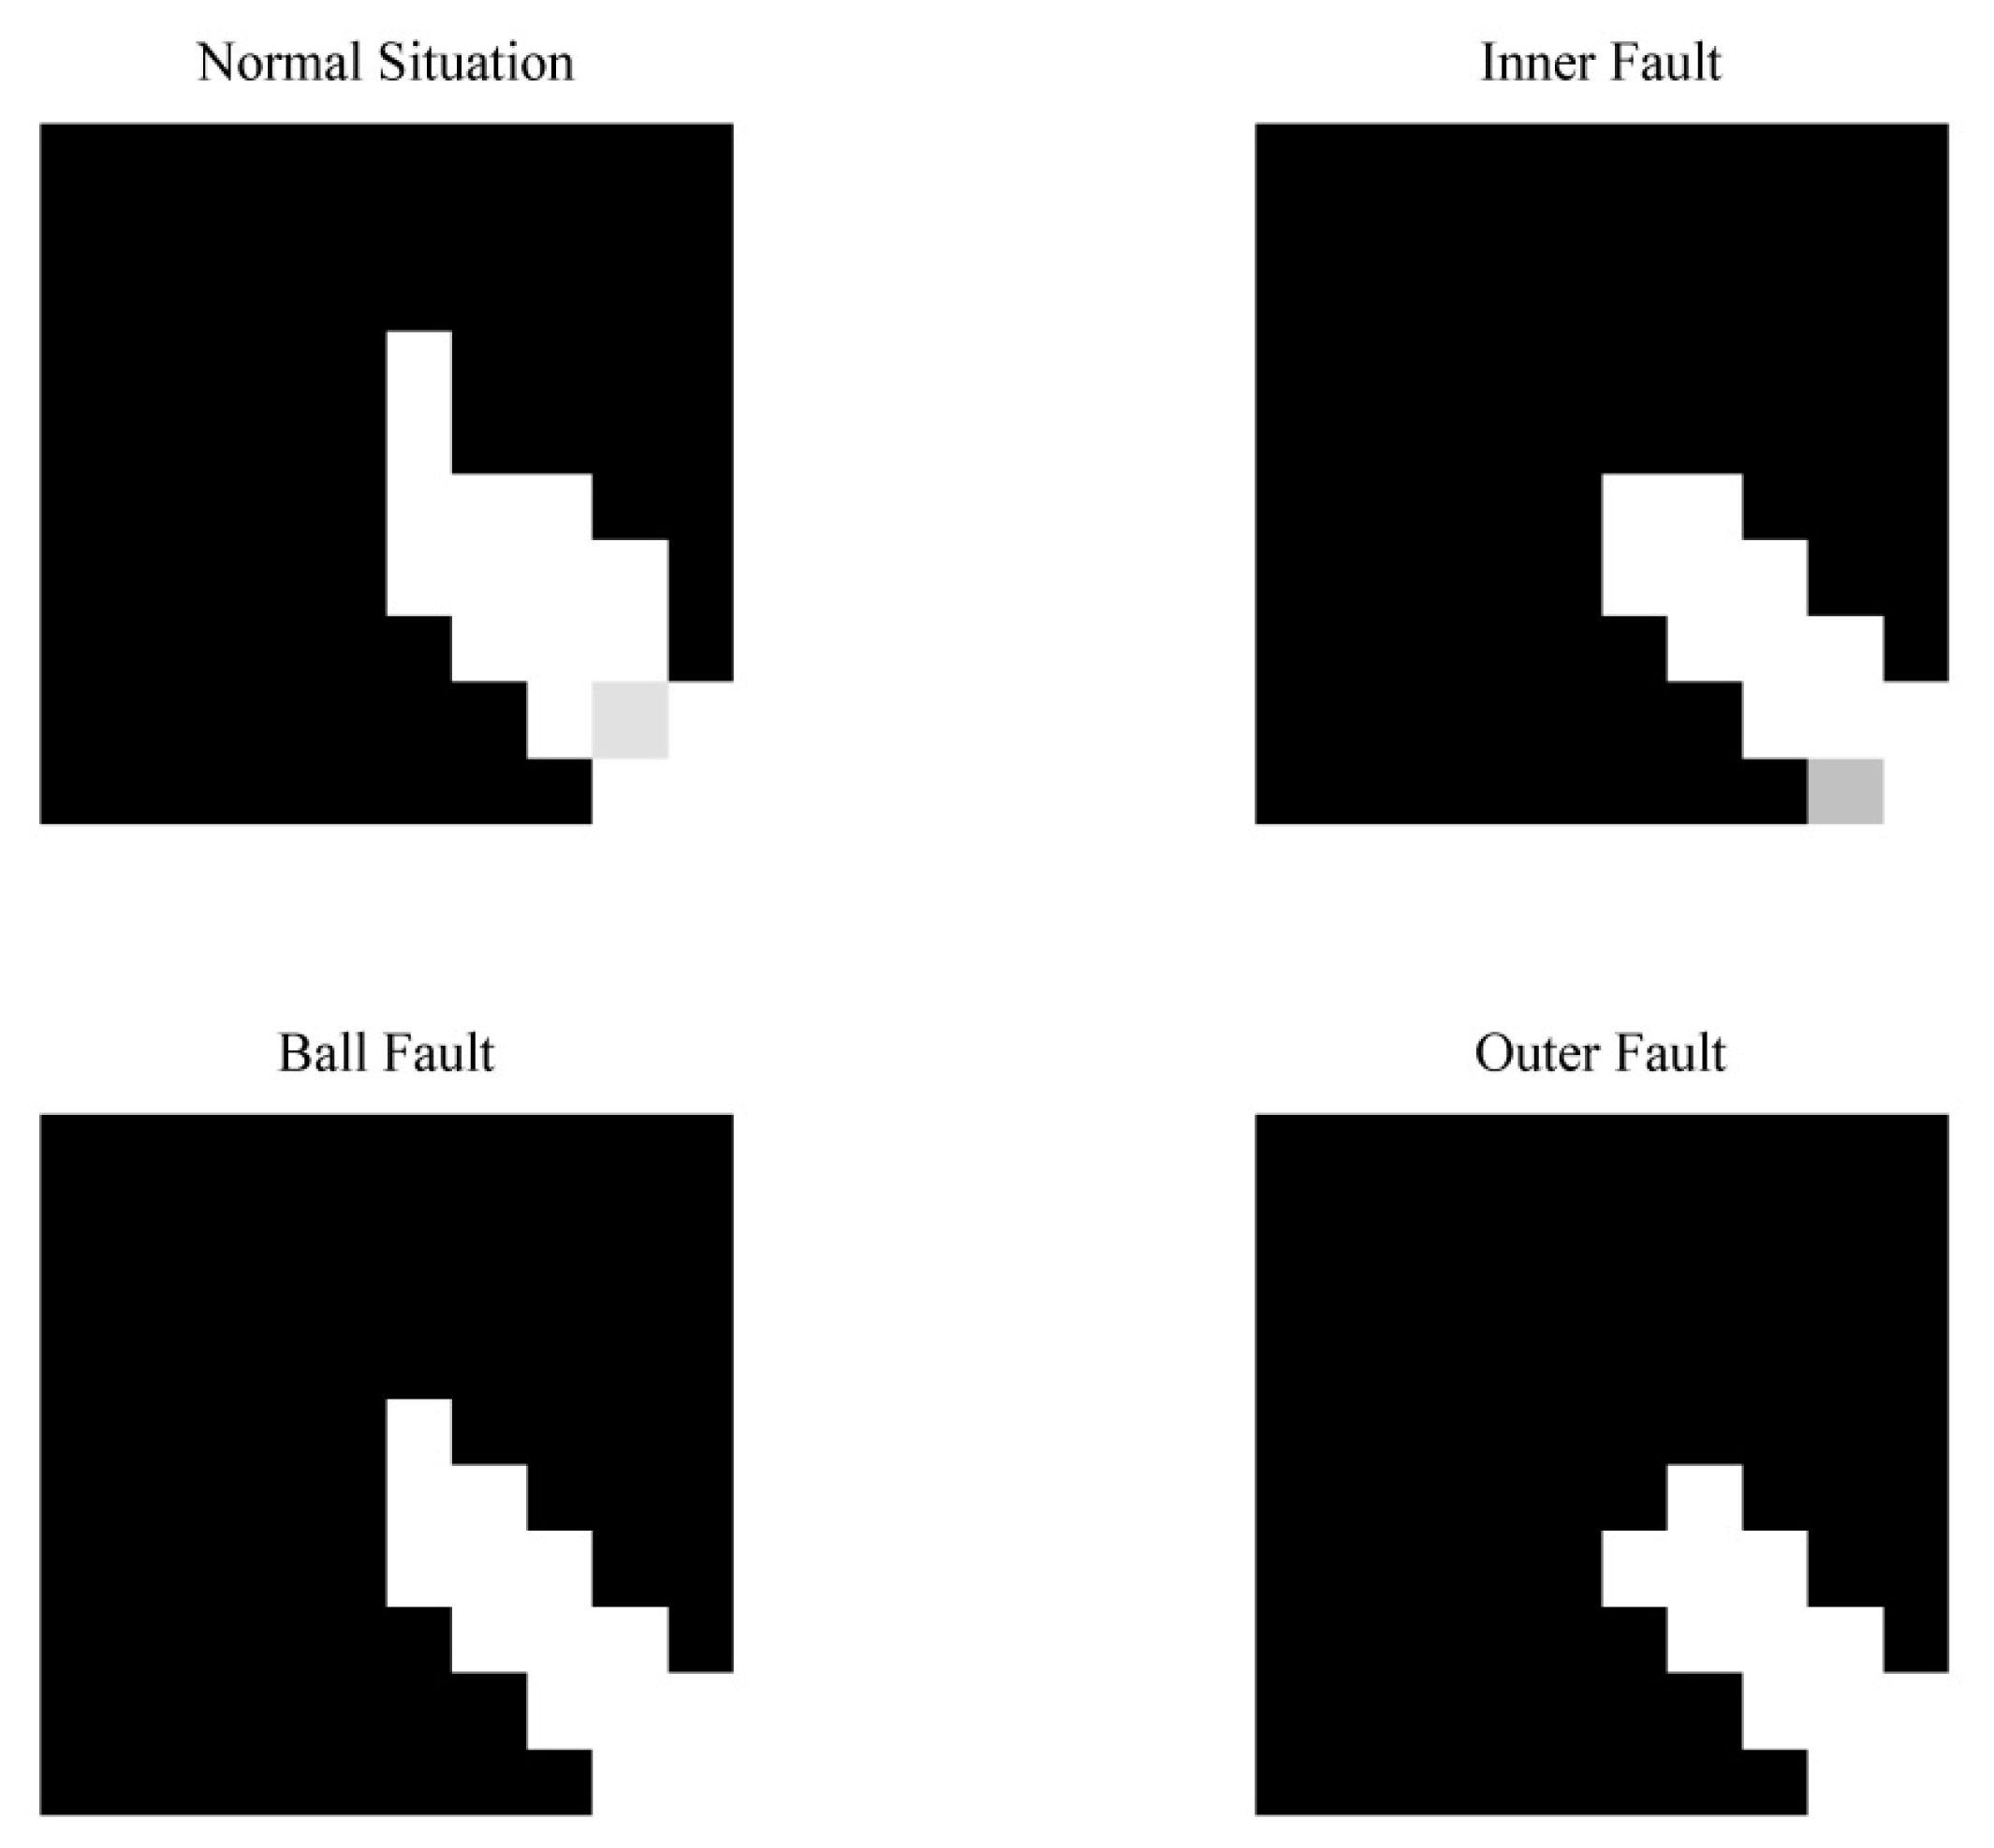
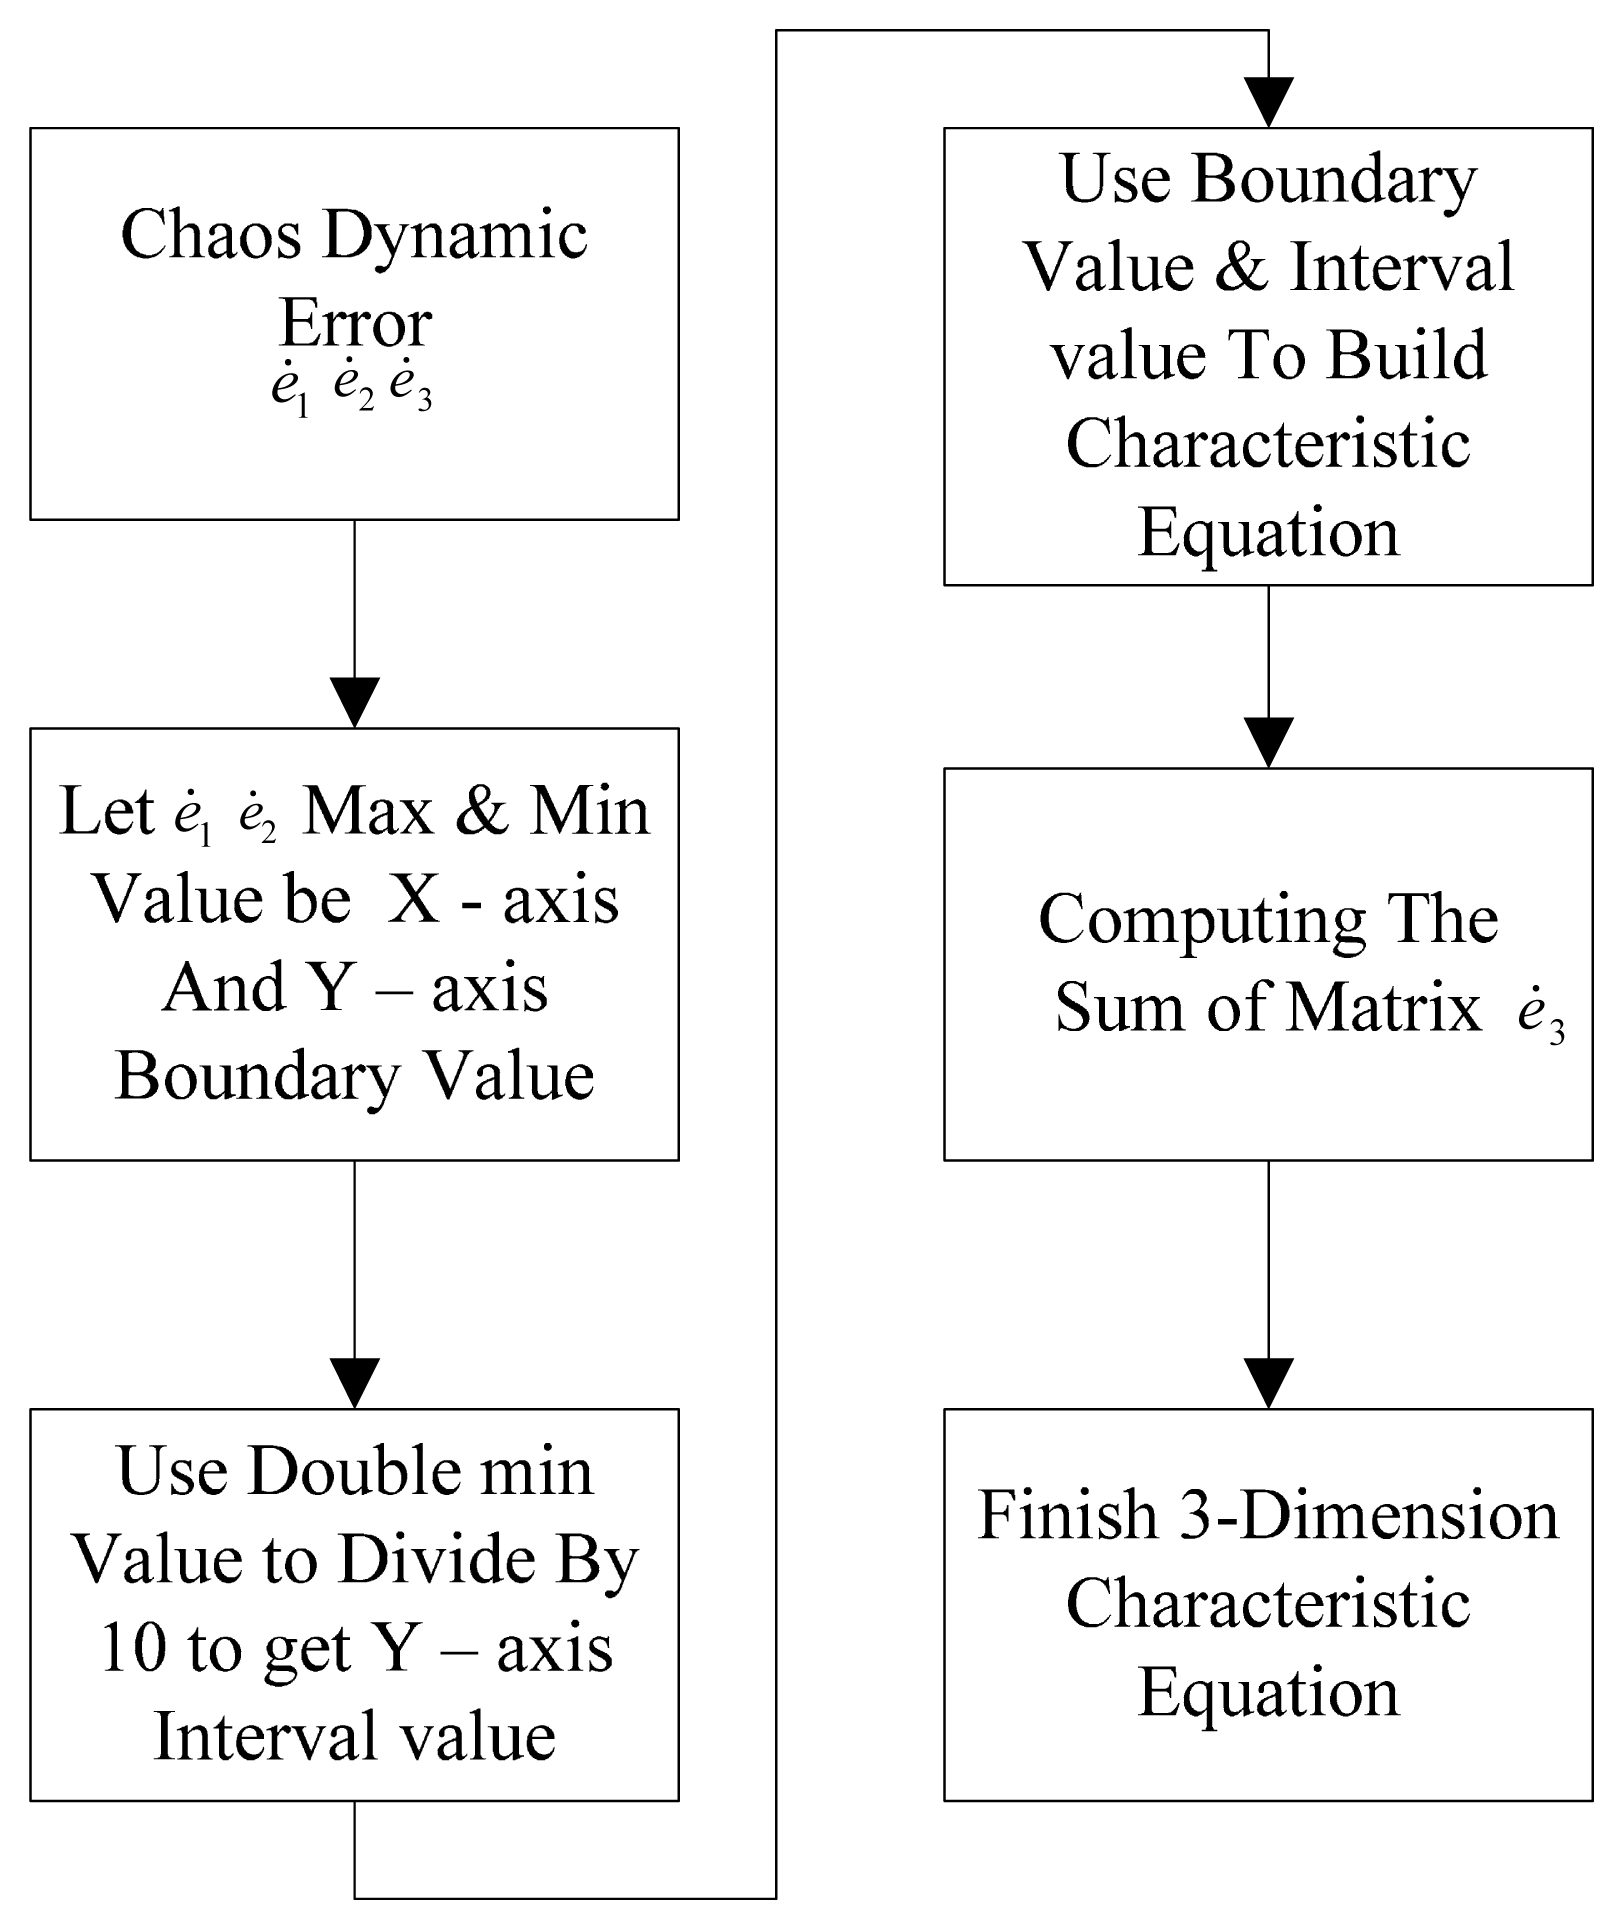
Therefore, the fractal theory is used to image the numerical values to estimate the fractal dimension and lacunarity, and the numerical values will be matrixed. This paper converts the dynamic errors
e1,
e2 and
e3 of chaos theory into a 10 × 10 three-dimensional characteristic matrix. Then it is magnified to 64 × 64 by nearest-neighbor interpolation, so as to amplify the error signal. Matlab displays the matrix in graph form.
Figure 6 shows significant differences.
Figure 7 shows the process of building the characteristic matrix. The detailed information of the computation of the matrix can be found in [
25].
3.3.1. Fractal Dimension
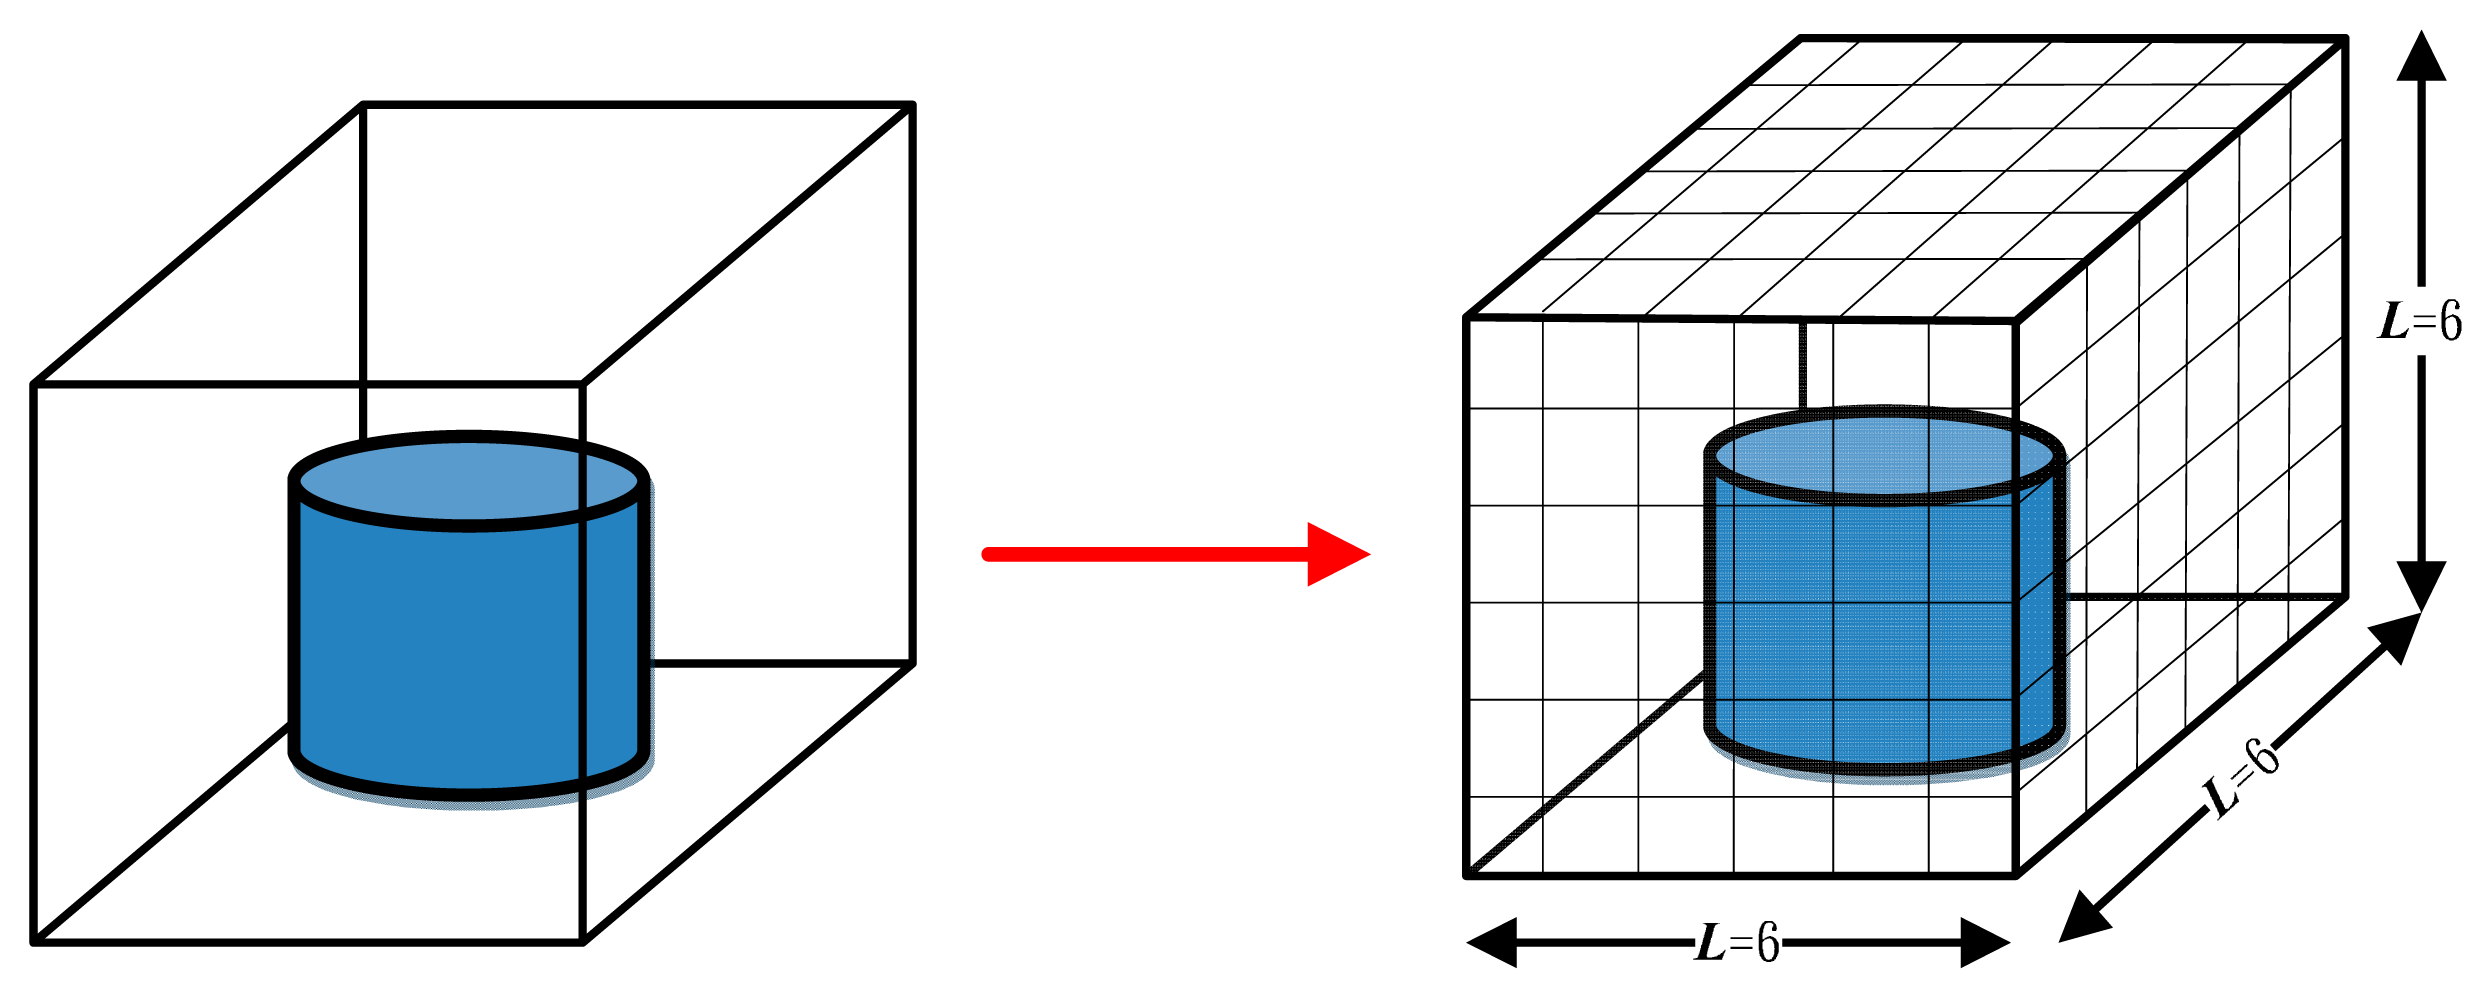
The calculation of the fractal dimension of the difference box method is not complex, as long as the analyte is put in a square block and is equally cut into L3 blocks. The average image grayness placement of each block is estimated, and the least square method is used for linear fitting of [log(1/
s), log(
Ns)]. The fractal box dimension can be estimated from
s =
L/
M. Where
L can be a positive integer,
s is the calculated fractal dimension value and
M is the magnification of the object.
Figure 8 shows the condition of
L = 6.
3.3.2. Lacunarity
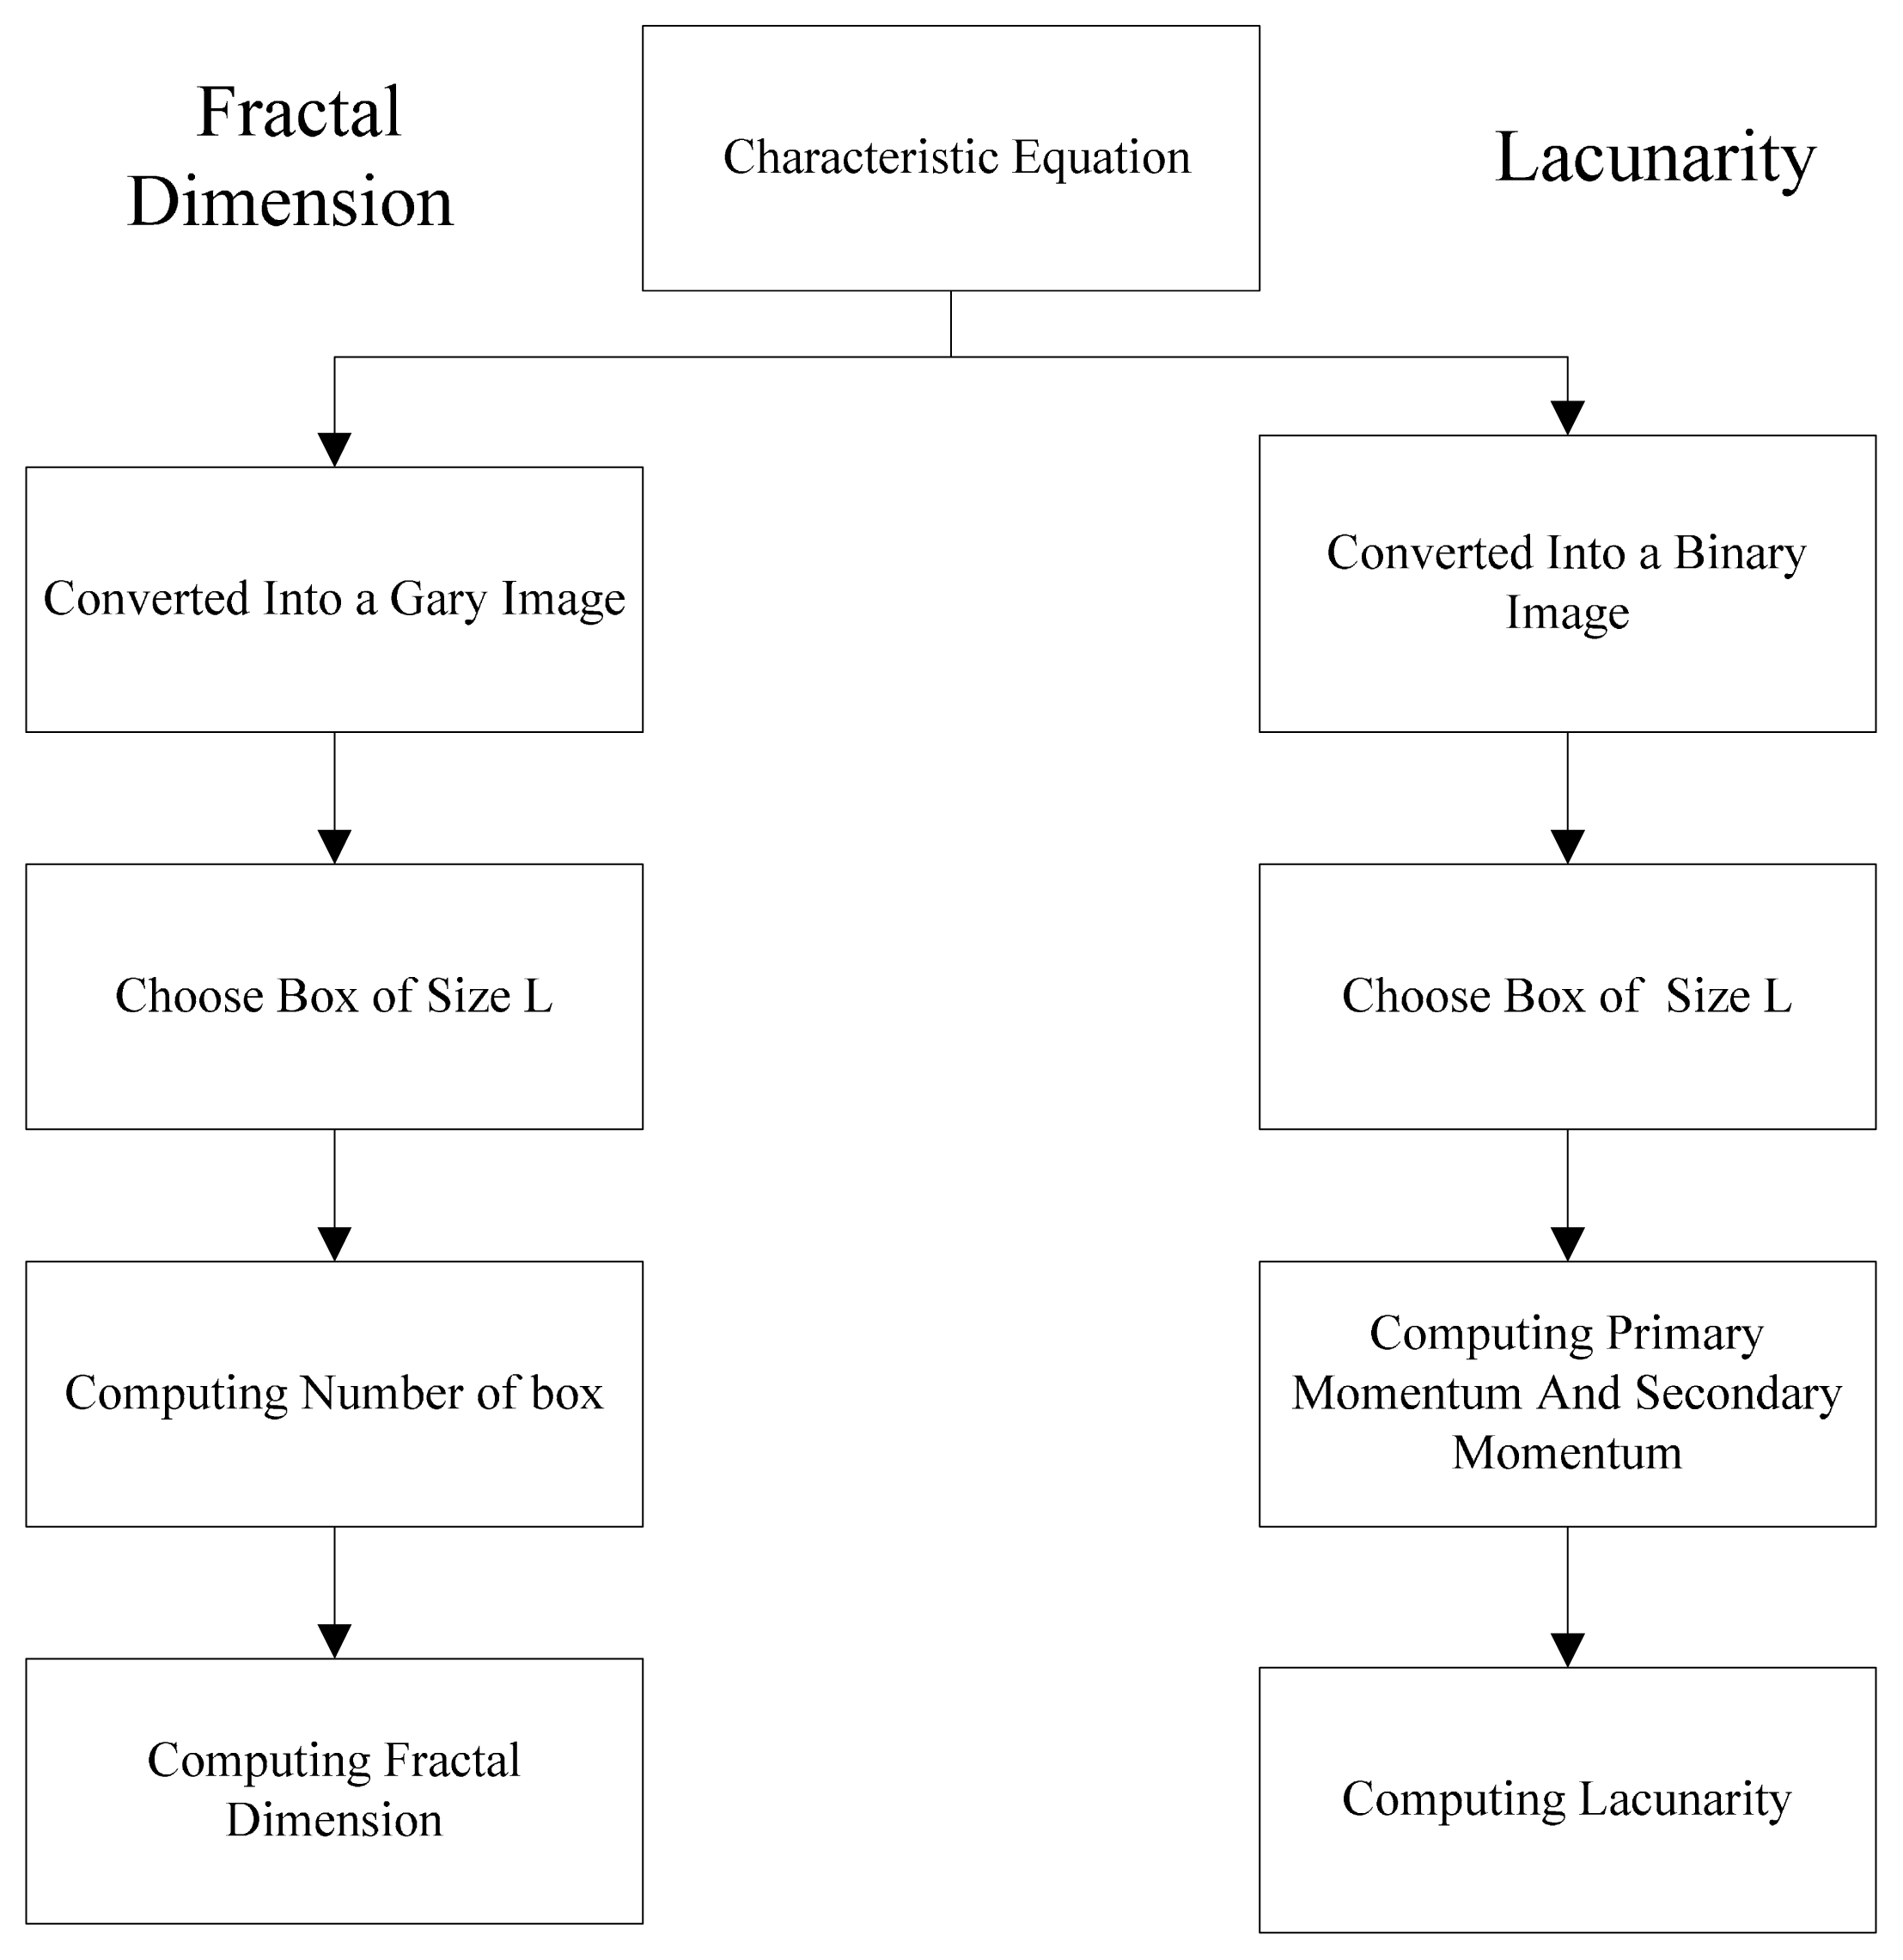
In the estimation of the fractal dimension, the lacunarity is another characteristic for describing the fractal dimension, and the distribution of the image surface gaps is quantified to represent the intensity. When the characteristic of the chaos synchronization system is used to estimate the lacunarity analytically, the image is converted into a binary image at a threshold of 128, and the first-order and second-order momentum in the image are obtained by the statistical distribution probability algorithm, so as to calculate the lacunarity indirectly.
Figure 9 shows the fractal dimension and lacunarity computing process.
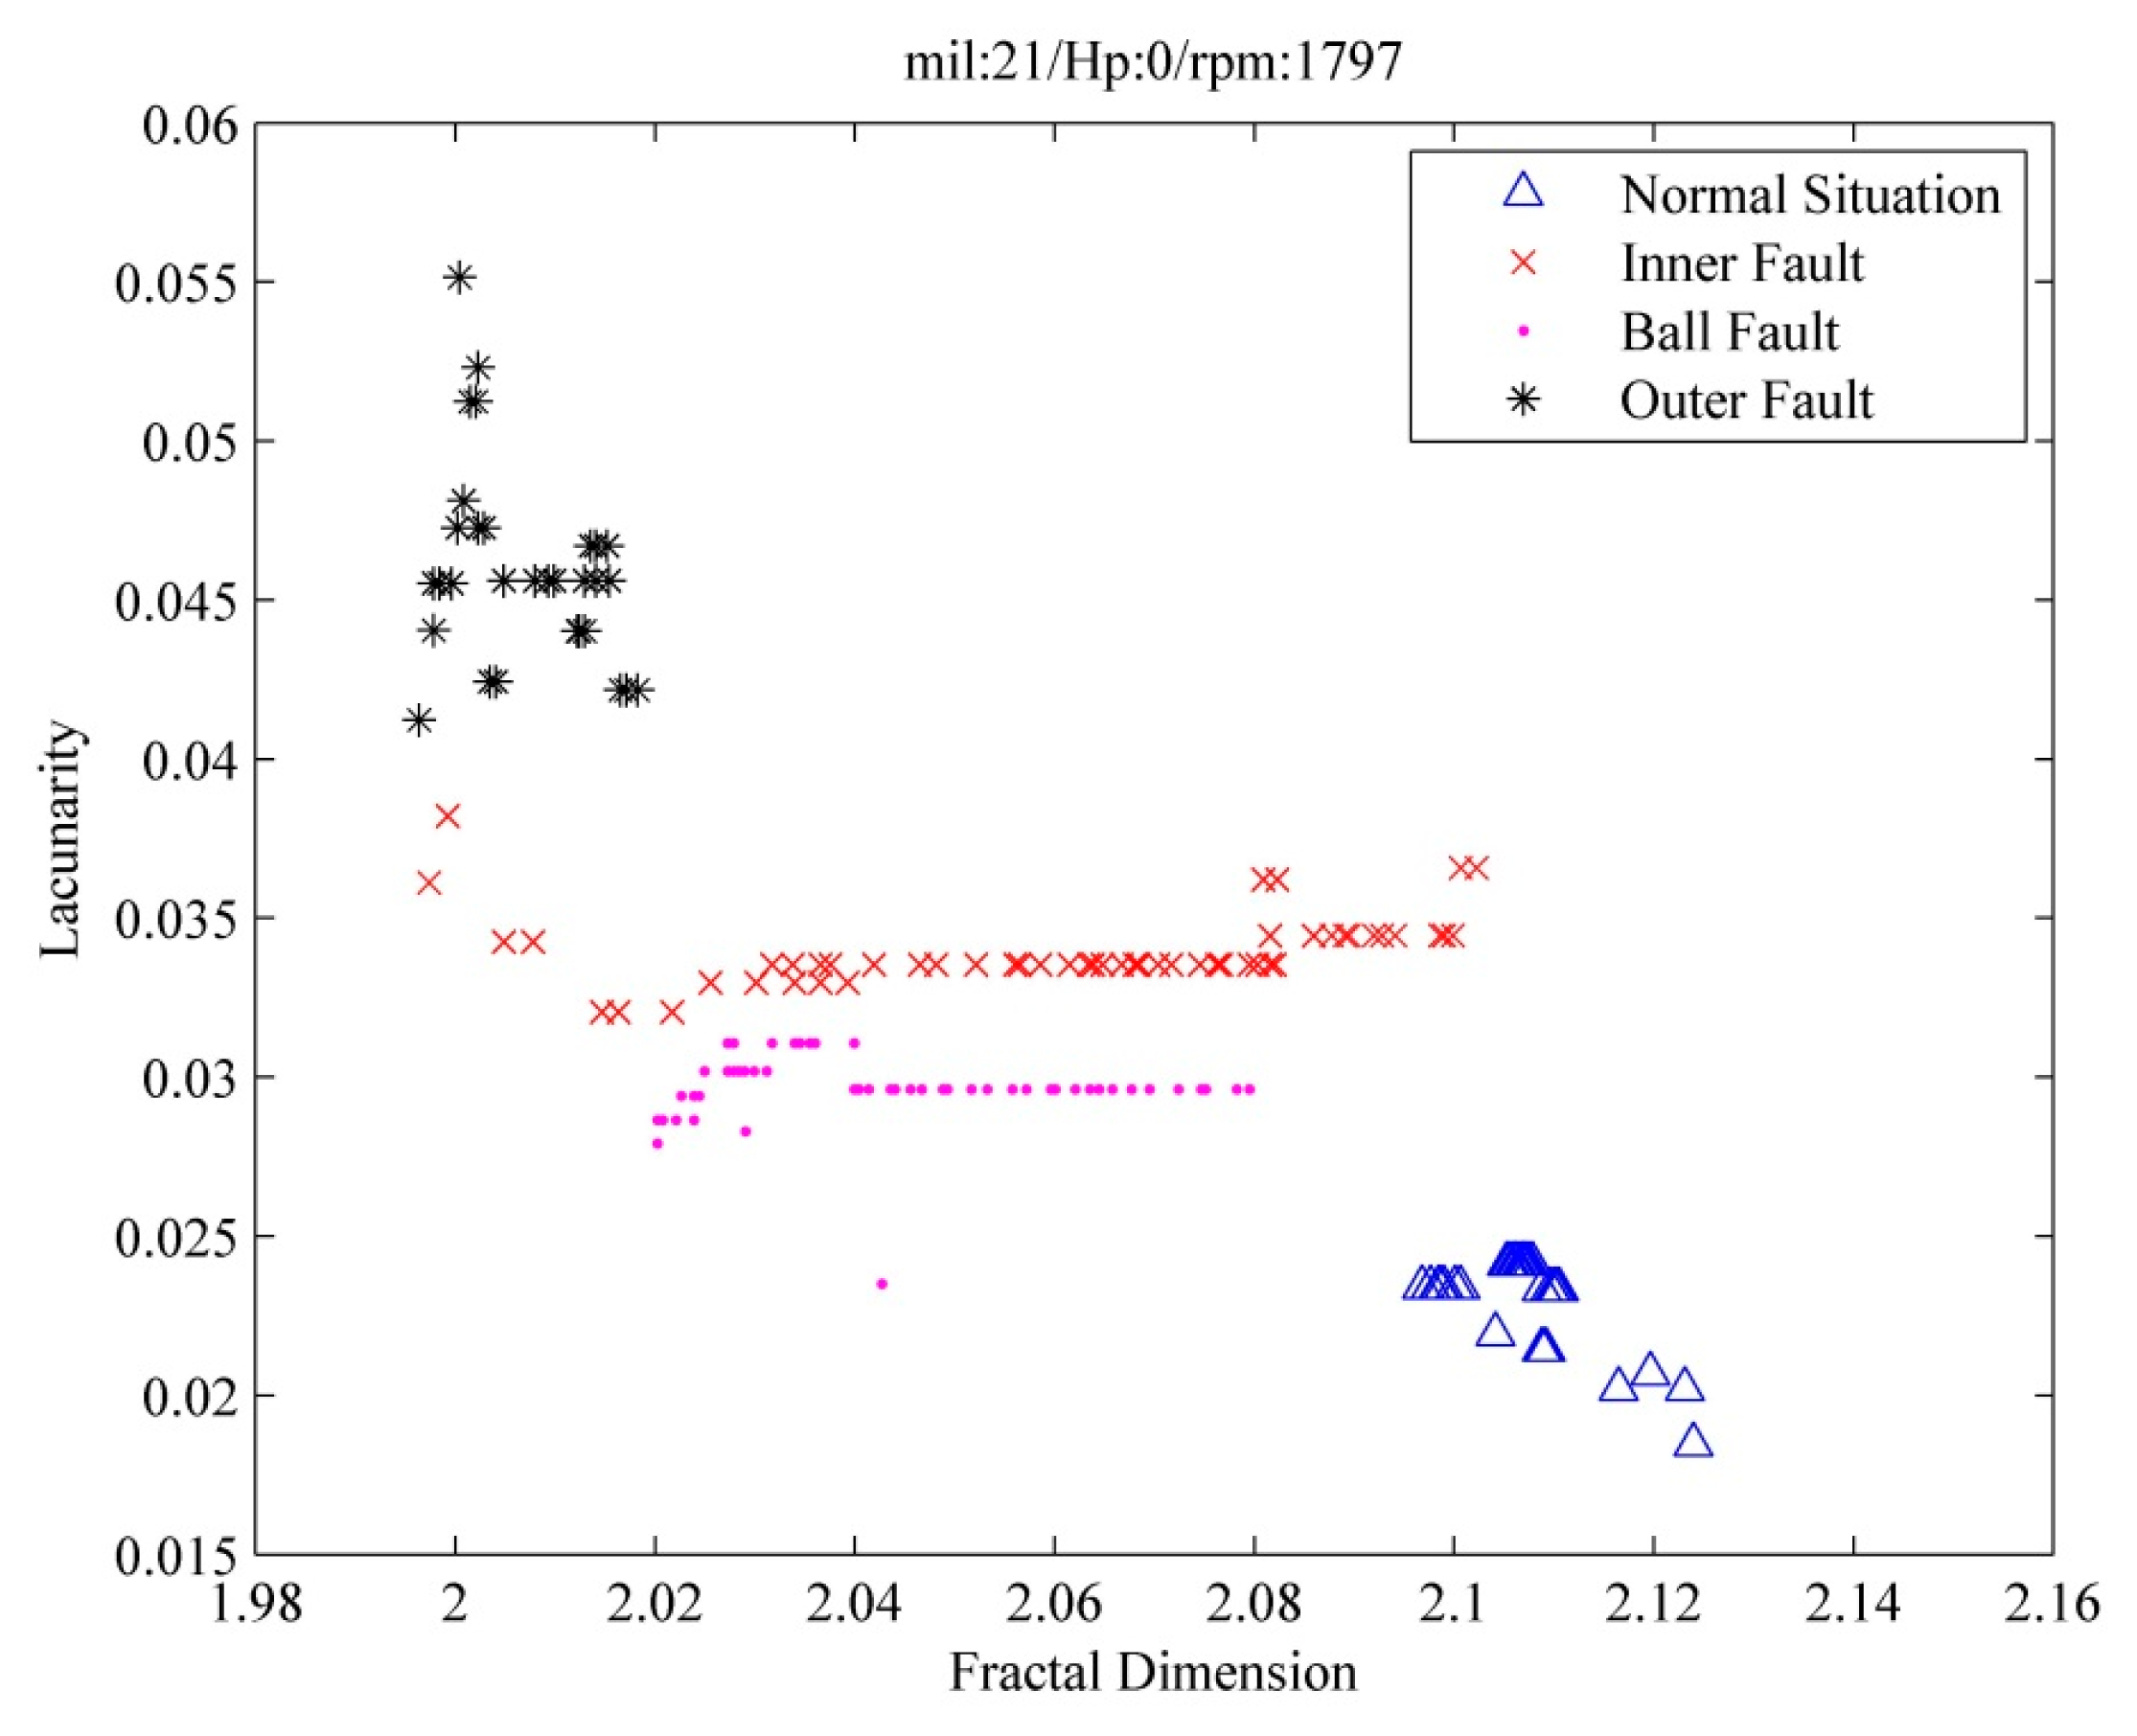
The pattern of the characteristic matrix is estimated mutually by the difference box method. The box size in this paper is 2, 3, 4, 6, 8, 12, 16 and 32. The least square method is used for straight line fitting of each estimated result to obtain the fractal dimension as the slope of the straight line after fitting. The lacunarity is obtained from the computing equation between primary momentum and secondary momentum. However, the fractal dimension uses one rotation as a base number; this paper divides 96,000 data for analysis by 1665 data to obtain the amount of one revolution. As it shall be reconstructed as a three-dimensional signal, 1667 data are sampled from each revolution. The conversion result shows that the test signal can rotate about 57 revolutions.
3.4. Extenics Theory
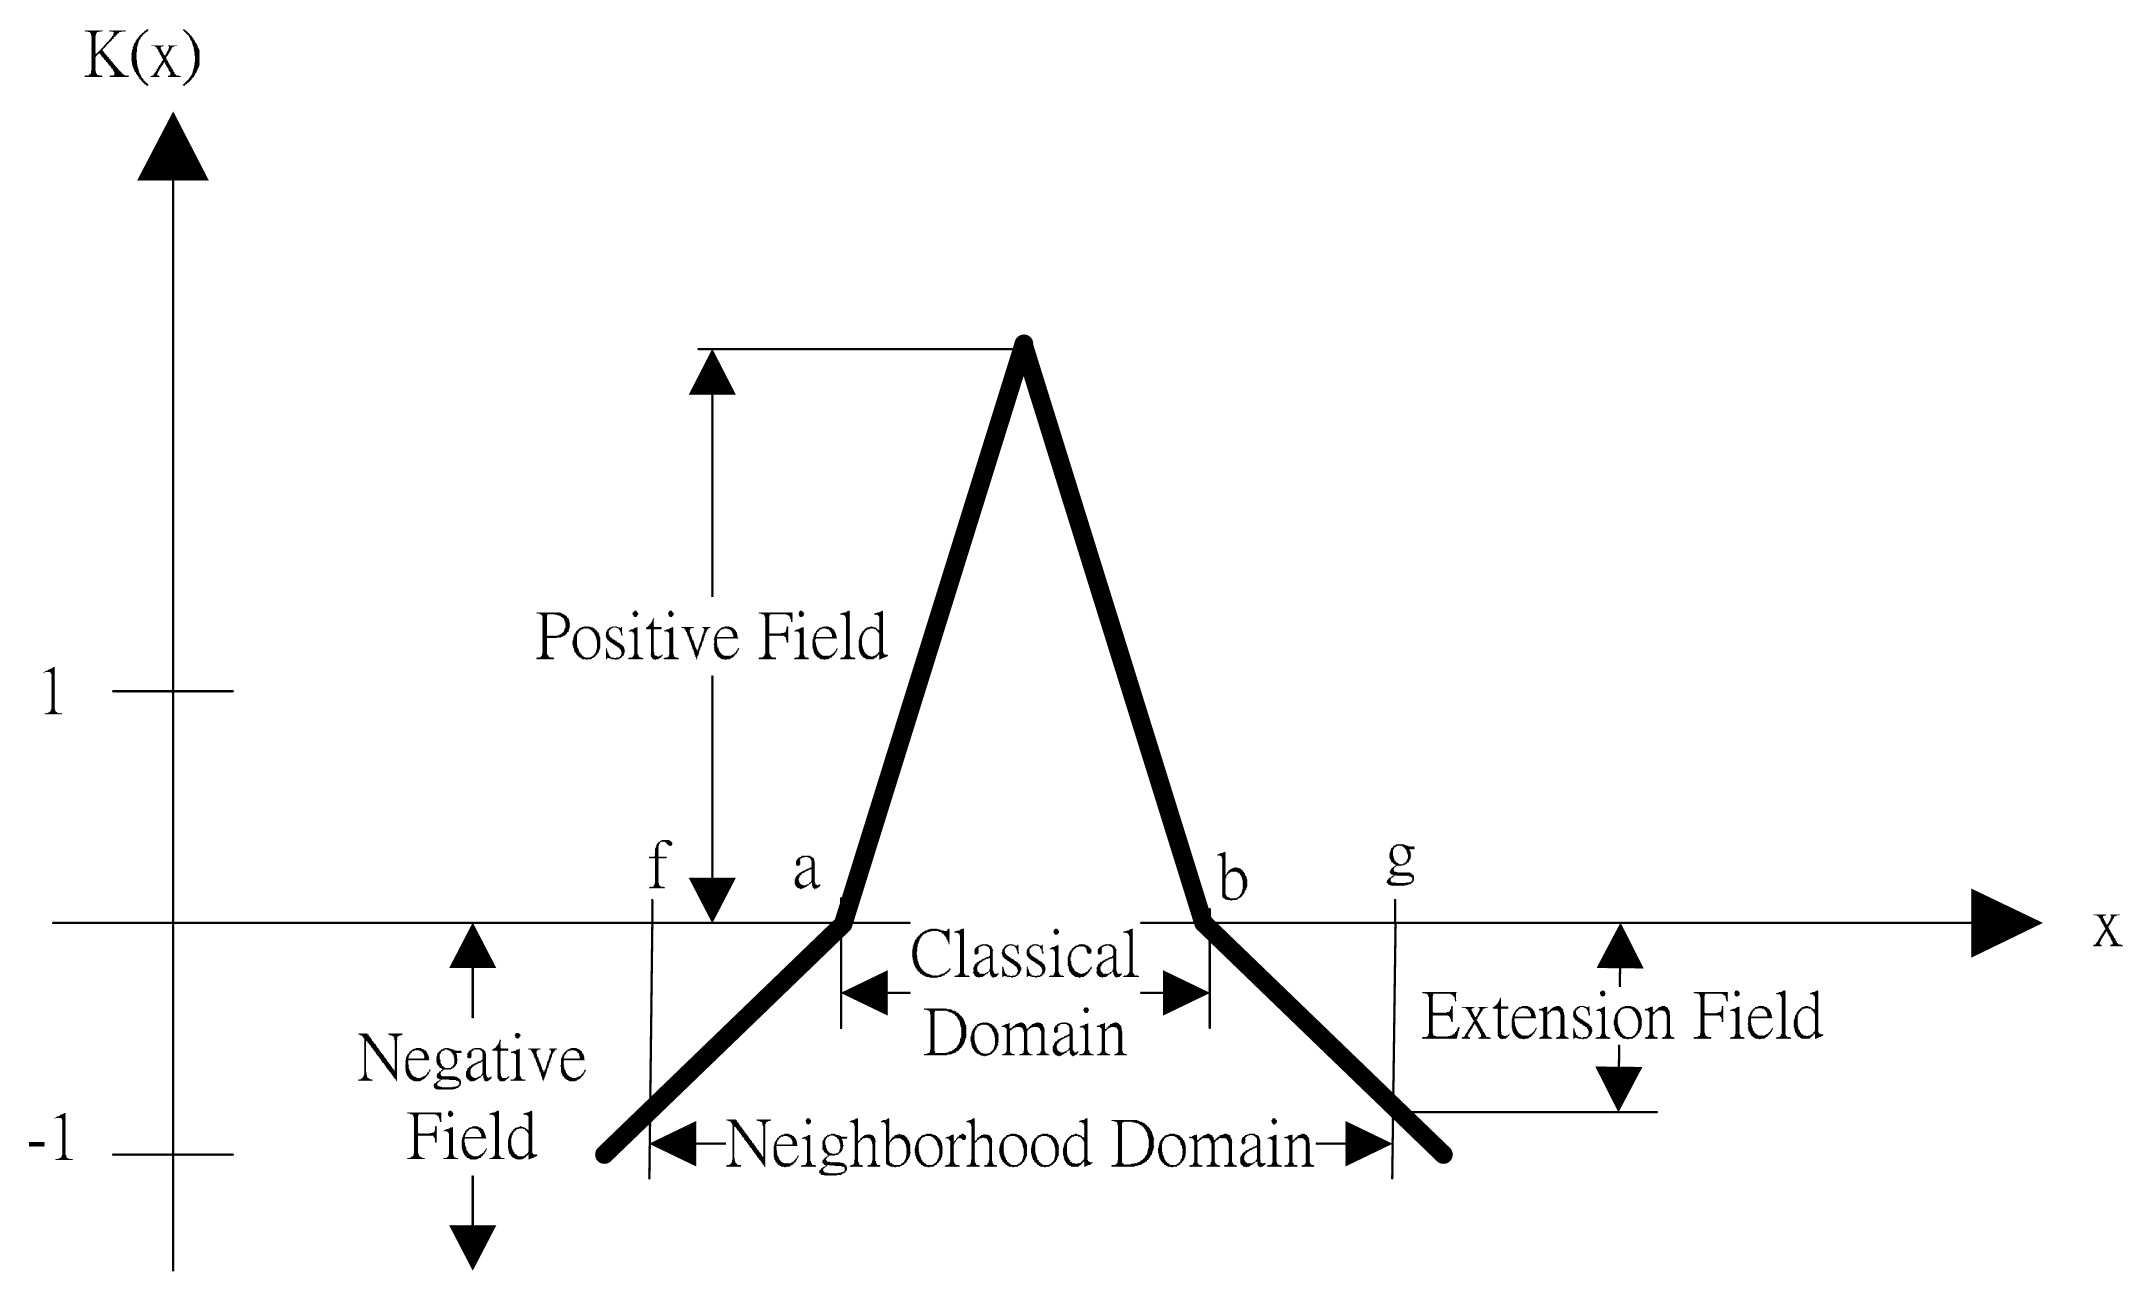
Extenics theory is based on fuzzy theory, extending the fuzzy set range of fuzzy theory to [−∞, ∞] real number. It is applied to fault pattern discrimination according to the “distance” concept of extenics theory. The “distance” between the matter-element to be measured and various states is calculated in this concept. The state type of the matter-element to be measured is judged according to this distance value. Compared with traditional mathematics and fuzzy mathematics, the extension mathematics balances shortage with abundance, and is applicable to and effective in many fields.
Traditional mathematics essentially has only traditional logic of right and wrong; it does not contain all answers in many cases. In contrast, fuzzy mathematics has a different view from traditional logic, and cannot describe things completely. Extension mathematics uses the concept of the matter-element model, and displays things more completely than either traditional mathematics or fuzzy mathematics [
27]. The traditional set concept only has deterministic ideas of 0 and 1, such as yes and no, and right and wrong. Uncertain concepts can be expressed by an extension set.
Figure 10 is the schematic diagram of the correlation function in extenics theory. When extenics theory is used, the degree of contradiction is expressed by magnitude, so the theory extends the concept of distance in the time-varying function into “distance”. Let
x be a point in the real domain (−∞, +∞), and the interval
x0 = <
a,
b> is in the real domain;
Equation (7) can be regarded as the “distance” between
x and
x0.
Extenics theory uses the concept of distance to calculate the correlation function, and this correlation function value represents the distance between the signal to be measured and each fault state. For example, if the normalized data are distinguished as closest to a state, after normalization, the distance between the state and the signal to be measured is expressed as “1”, and the signal to be measured is classified as the state. If there is another state farthest from the signal to be measured, it is expressed as “−1” after normalization.
To use the extracted characteristics to judge the fault, the matter-element model of various fault states is required to be built before distinguishing the extension fault. If there are multiple fault states, building a fault matter-element model will take much time. For example, in this paper, it depends on artificial judgment of characteristic placement range in different fault conditions under different loads. To establish the classical domain, it is required to build the fault matter-element model for all bearing states in
Table 1. It is both time consuming and inefficient, and it is likely to cause errors. Therefore, this paper analyzes the placement distribution diagram, spreading outward from the centroid of the placement pattern as the center, so that the automatic calculation of the program generates the classical domains of various fault states. A neighborhood domain containing various classical domains is formed after cross-comparison of classical domains. This method not only remedies the defects in the aforesaid manual establishment of the classical domain, but also completes overall intelligence. When the classical domain and neighborhood domain are made, the result of the fault diagnosis can be obtained from the correlation function, and the normalization makes the range −1 to 1, so as to complete the diagnosis. This paper randomly selects 20 data of different fault conditions for different loads for testing. The test result shows that, regardless of the fault diameter, fault state and load, the chaos theory with fractal theory and extenics theory for distinguishing bearing fault states proposed in this paper can detect bearing faults correctly.
5. Conclusions
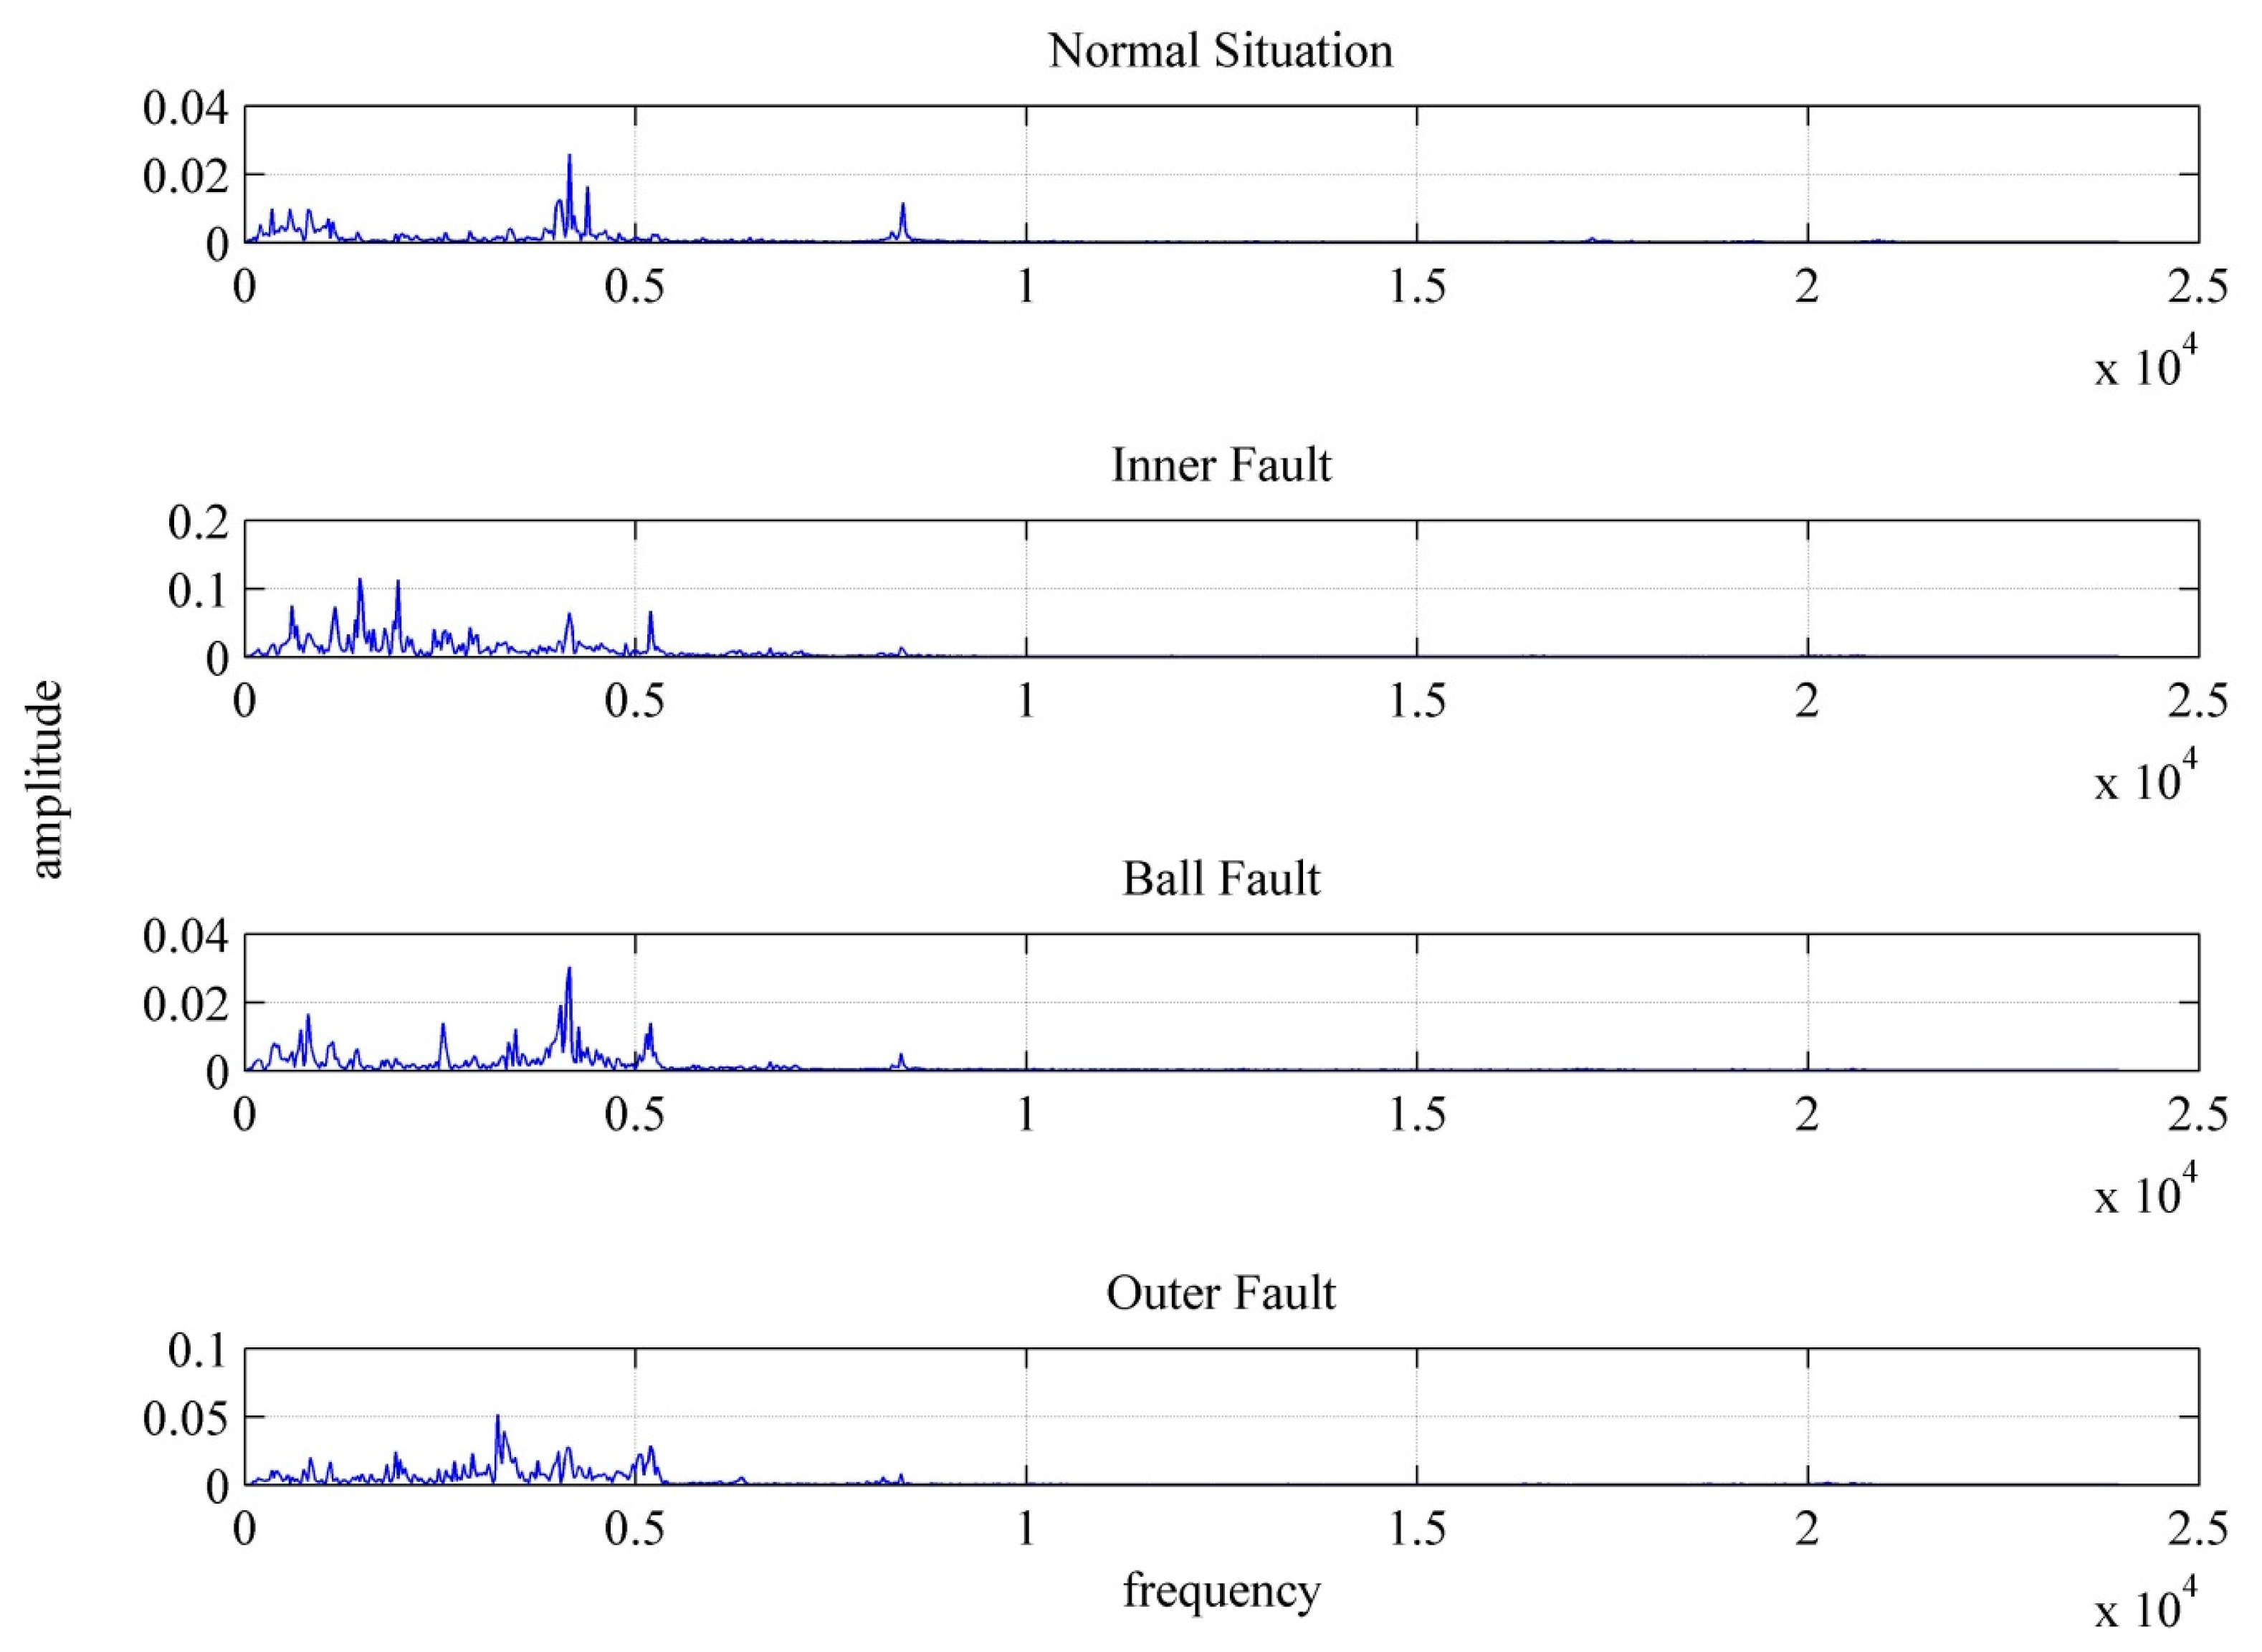
This paper proposes a new method, combining chaos synchronization theory with fractal theory and extenics theory to process the vibration signal generated by the rotation of ball bearings, so as to diagnose the faults in ball bearings. The results show that this scheme has a better diagnostic rate than the two common methods of frequency-domain analysis, i.e., Discrete Fourier analysis and wavelet packet analysis. The method proposed in this study is rapid, low cost and easily implemented, and it does not cause misrecognition. If this technology is extensively applied to various ball bearing mechanisms, the condition of the ball bearings can be known rapidly, and the faults in the bearing can be known accurately. It does not take a long time to look for the fault point, as the fault point in the ball bearing can be found rapidly according to the judgment results.


