Two-Atom Collisions and the Loading of Atoms in Microtraps

Abstract
: We review light assisted collisions in a high-density far-off resonant optical trap (FORT). By tuning the parameters of the light that induces the collisions, the effects of the collisions can be controlled. Trap loss can be suppressed even at high atomic densities, allowing us to count the atoms using fluorescence detection. When only two atoms are trapped, individual loss events reveal new information about the process, and the simplicity of the system allows for a numerical simulation of the dynamics. By optimizing the experimental parameters, we implement an efficient method to prepare single atoms in the FORT. Our methods can be extended to load quantum registers for quantum information processing.1. Motivation
Over the past few decades, scientists have developed a wide range of tools to control and manipulate microscopic systems [1–6]. A major motivation factor driving this development is the potential use of such systems for quantum information processing [7–12]. The level of control of systems consisting of individual or small sets of charged ions or neutral atoms is impressive, and quantum computing beyond the limitations of classical computation now appears to be a realistic goal [13–21].
The advancement in experimental capabilities revitalizes long standing questions in physics. This happens in part as a consequence of their relevance to quantum information processing, but also because the new technologies may be able to facilitate answers to these questions. For example, the process of thermalization in an isolated system is not fully understood despite it being fundamentally important [22]. Answers to questions, such as how, when and why do isolated few-body and many-body systems thermally equilibrate, remain incomplete, despite these being a subject of study since the establishment of statistical physics [23]. Alongside theoretical advances [24–27], experiments are now addressing such questions. Demonstrations of systems that do not thermally equilibrate [28], the occurrence of prethermalization in an isolated system [29] and the nonequilibrium dynamics of fermions in an optical lattice [30] have been reported in recent years.
The dynamics in the few-body regime is of particular interest. Studying few-body systems of increasing complexity may enable the understanding of many-body phenomena [31–36]. Additionally, explorations in this regime allow for the observation of individual dynamical events and fluctuations away from the equilibrium, which often lead to discoveries of phenomena that are hidden in ensemble measurements [6,37–41].
Optically trapped neutral atoms provide an exciting platform for studying few-body dynamics. The atoms are nearly perfectly shielded from their environment, and a wide range of the system parameters can be configured in a short timescale [42,43]. For the same reasons, they are also favorable candidates for qubits in a quantum logic device [9,12,44,45].
In this review, we will describe our progress towards developing some of the tools necessary to realize the full potential of this platform. We will focus on two key issues: firstly, fluorescence imaging and the counting of atoms at high peak densities in a far-off resonant trap (FORT) and, secondly, the deterministic loading of a single atom into a FORT. For both issues, light assisted collisions play a crucial role. By implementing the idealized collision experiment where only two atoms are involved, we gain detailed insight into the dynamics of the processes. Such experiments enable the observation of individual atom loss events. A numerical model of the experiments allows us to interpret the ongoing dynamics of the processes.
This review paper is structured as follows: Section 2 provides the physics behind light assisted collisions between two neutral atoms and discusses how atoms release energy upon collisions. Section 3 gives a comprehensive account of our experimental methods to prepare a small number of atoms in a FORT and how to count them. Section 4 presents the study of atomic collisional events between two atoms and presents a numerical model and a simulation of the process. Section 5 describes our method for deterministically preparing a single atom inside a FORT. Section 6 discusses the potential applications and the future outlook of our system. Section 7 is a summary of the paper.
2. Light Induced Interactions between Two Atoms
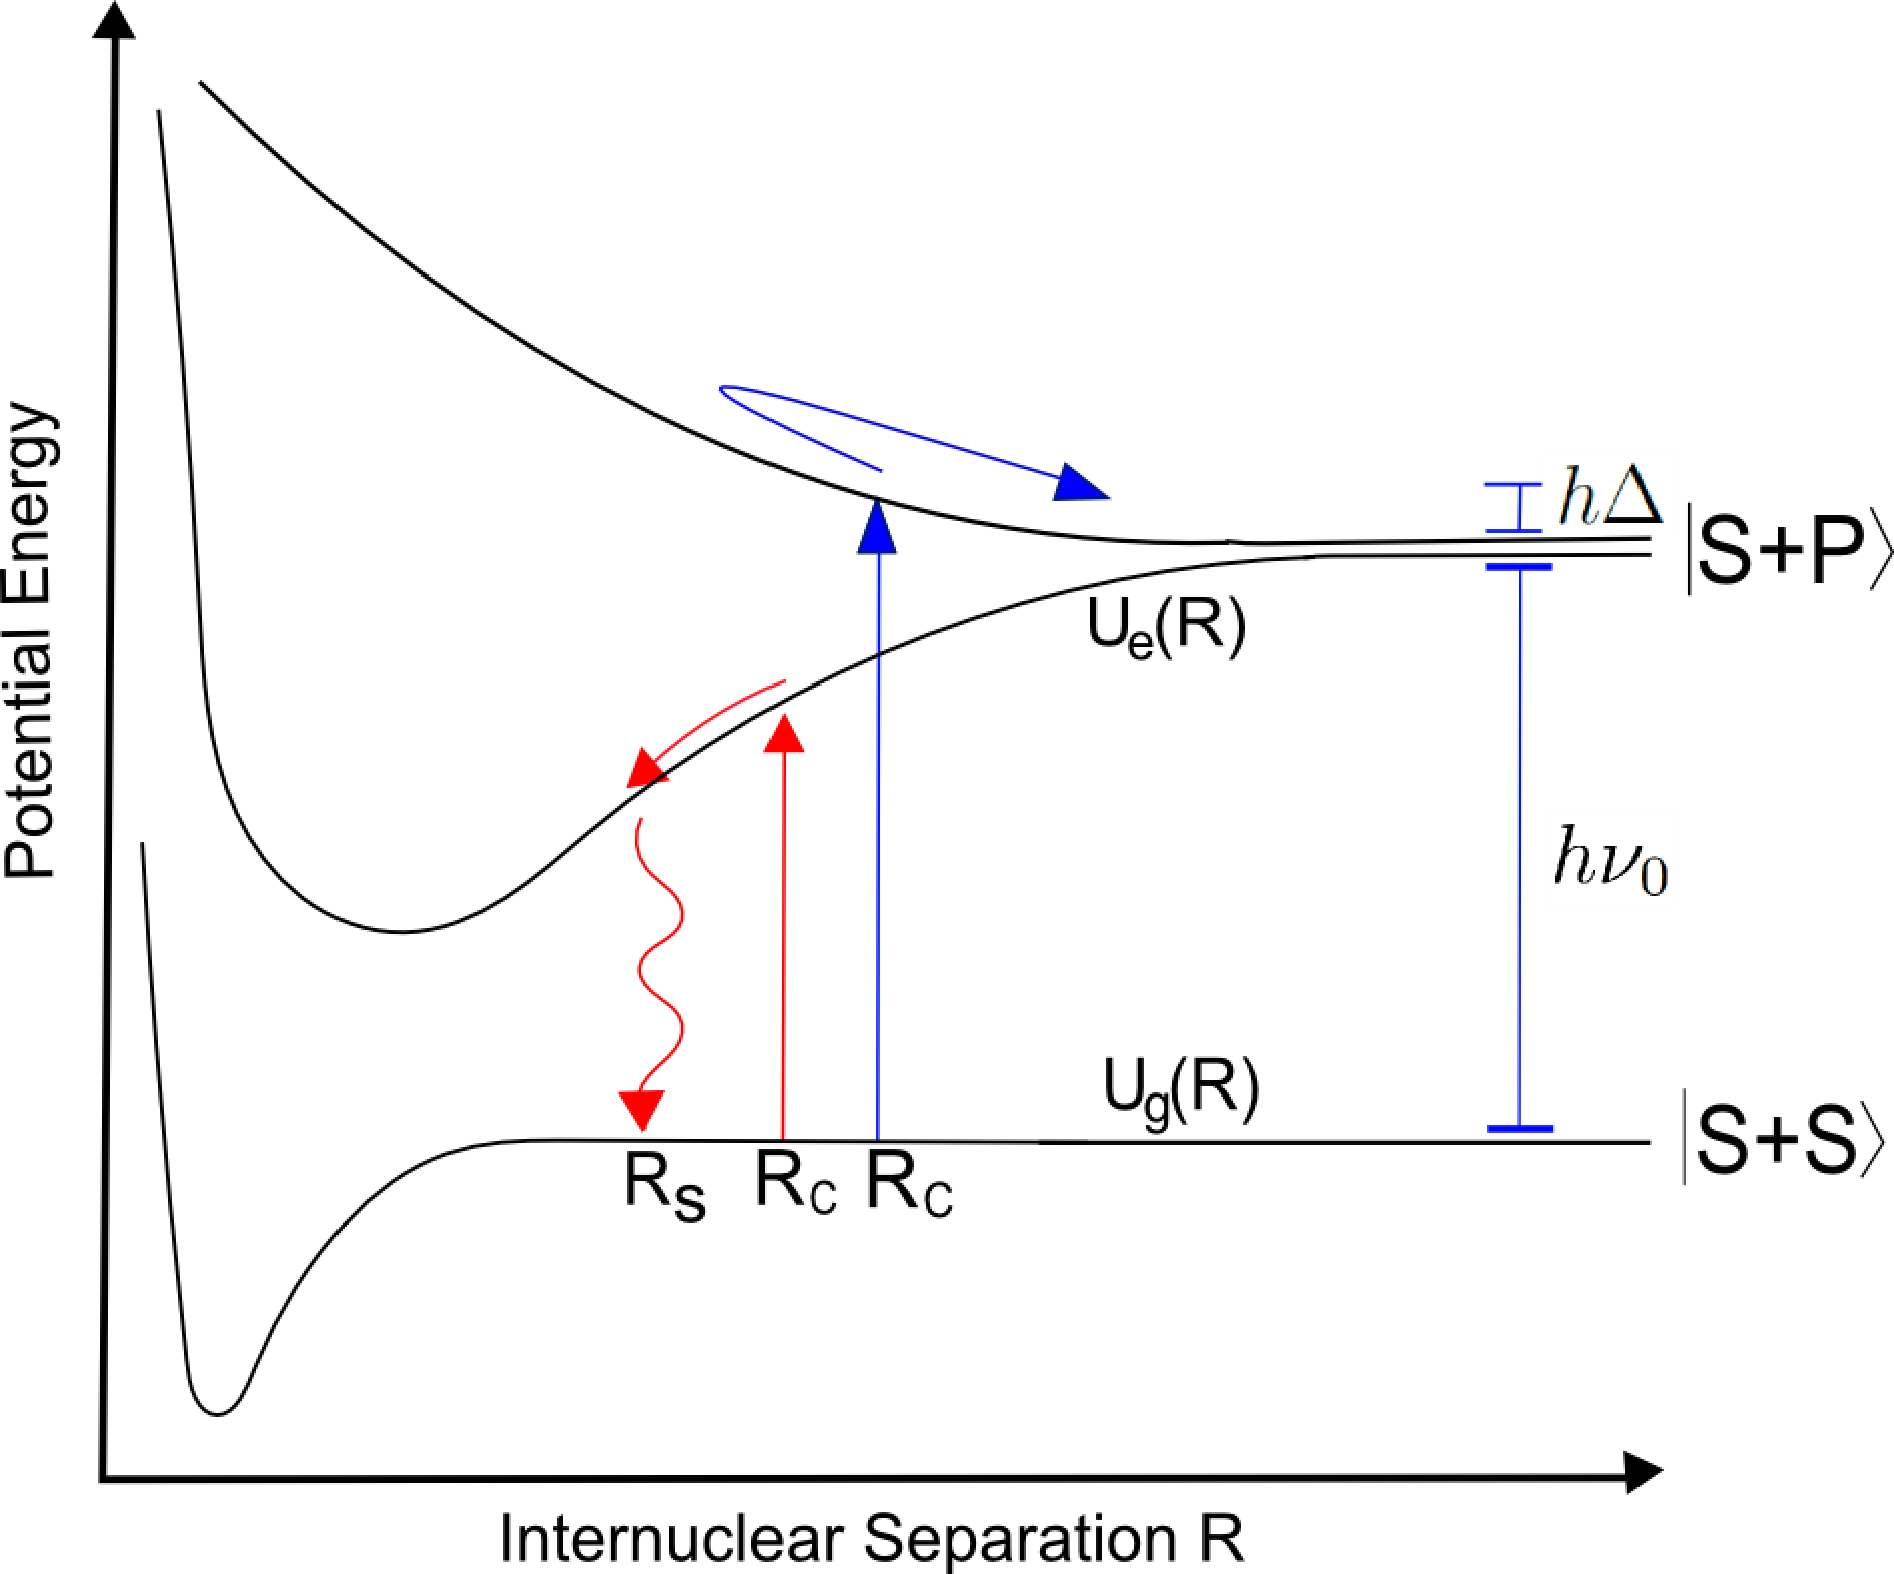
In this section, we introduce the model of light assisted collisions that we employ to interpret our experiments. We use the semi-classical approach developed in [46–48]. Figure 1 shows a schematic description of a collision between two 85Rb atoms in the presence of a light field. Ug(R) and Ue(R) represent the ground and excited-state molecular potentials, respectively, which depend on the inter-nuclear separation, R. In the large R limit, the atom-atom interaction can be neglected, and the ground state is simply two 85Rb atoms in their ground state (denoted |S + S〉). Similarly, the first excited state is a ground and an excited state atom (denoted |S + P〉). The ground and the excited states are separated by the free atom excitation energy, hν0. At intermediate R, the relatively short range of the ground state interaction potential (its long-range asymptote is C6/R6 with C6 a constant) ensures that we can consider it to be independent of R. Due to a resonant dipole interaction [47,49], the excited state has an interaction potential of a much longer range, which, for intermediate R, can be approximated by its C3/R3 asymptote, where C3 is a constant [50]. Depending on the relative phase of the interacting dipoles, the excited state can either be attractive or repulsive.
In the presence of light with frequency νL (detuned by Δ = νL − ν0 from a free atom), the ground and excited states can be optically coupled. The optical transition frequency changes as two atoms approach each other in a collision. The Condon point, Rc, is the inter-nuclear separation, where the atom pair is in resonance with the light field (Ug(Rc) − Ue(Rc) = hνL). When the light is red-detuned (negative Δ), it becomes resonant with transitions to the attractive excited potential, whereas blue-detuned light (positive Δ) becomes resonant with transitions to the repulsive excited potential.
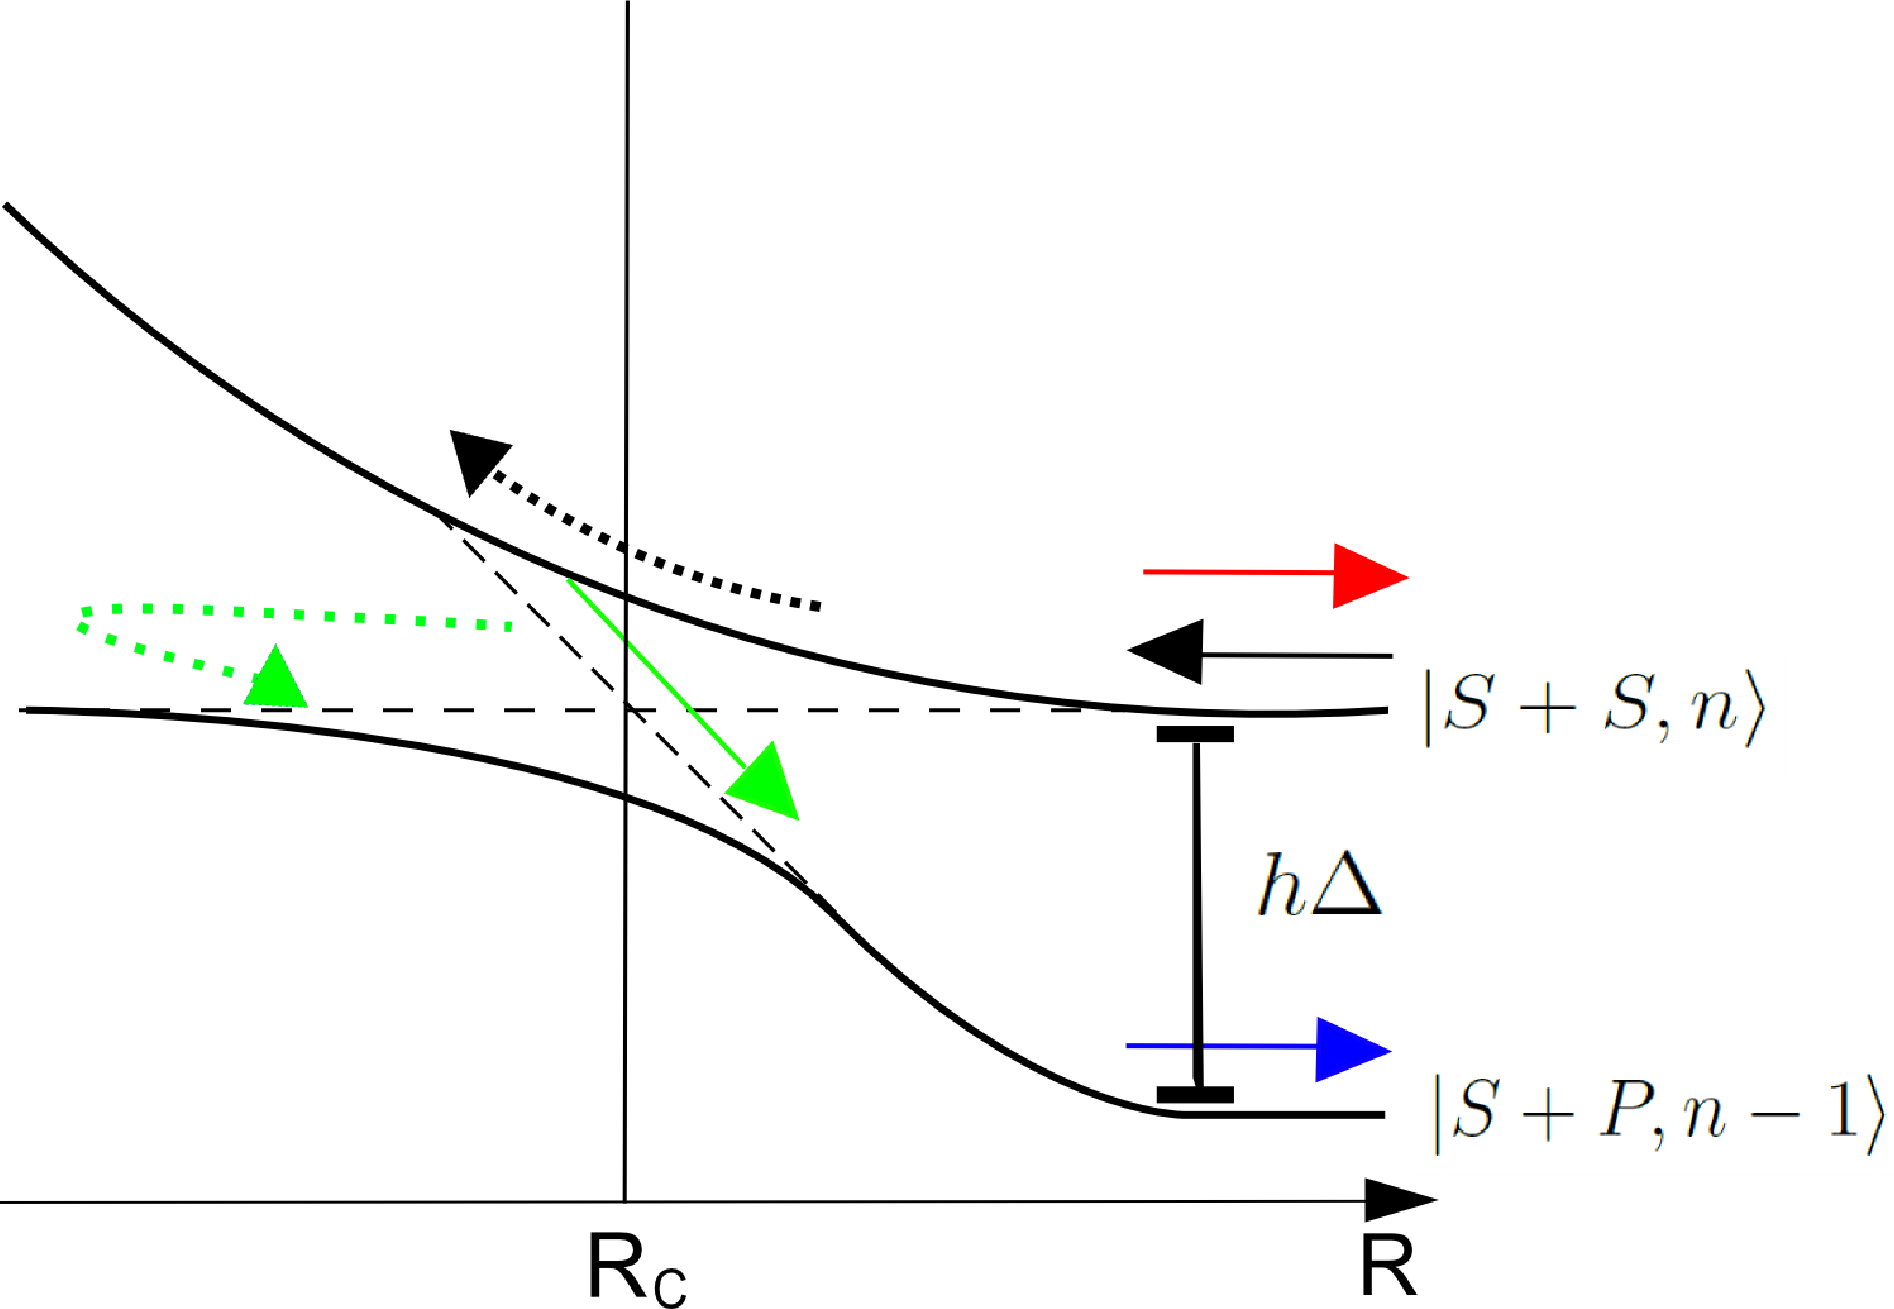
The probability for the atom pair to get excited at (note that Rc is always a positive value, as both Δ and C3 are positive values for blue-detuned light and negative for red-detuned light) can be determined by using the Landau–Zener (LZ) formalism in the dressed state picture [47], where the excited state energy is offset by photon energy (see Figure 2). The optical coupling causes the two dressed states to form an avoided crossing at Rc. When the atom pair pass Rc, they may go through one of two different processes: a Landau–Zener (LZ) transition to the other dressed state, or they can move adiabatically through the coupling region while remaining in the same dressed state (adiabatic following). The probability that the two approaching atoms undergo an LZ transition to the other dressed state is given by [47]:
2.1. Collisions Induced by Blue-Detuned Light
For a blue-detuned optical field, the atom pair in the ground state may get transferred to the repulsive excited state at Rc. In a collision, a pair of atoms cross Rc twice: when the atoms come together and again when they move away from each other. As we will see, the resulting collision may be elastic or inelastic. An elastic light assisted collision occurs when an atom pair starts and ends on the |S + S, n〉 state (represented by the red arrow in Figure 2). This happens when the atoms undergo adiabatic followings or LZ-transitions at both crossings of Rc. An inelastic light assisted collision occurs when an atom pair starts on the |S + S, n〉 state and ends on the |S + P, n − 1〉 state (blue arrow). For this to happen, the atoms must undergo an adiabatic following (dotted black arrow) and then an LZ transition (green arrow), or the other way round (dotted green arrow). The probability that an occurring collision is inelastic is thus:
By combining Equations (1) and (2), we can deduce that PI is dependent on Ω in a way such that PI increases with Ω for low values of Ω up to a maximum probability and then decreases for high values of Ω, which gives rise to optical shielding [51]. At high Ω regime, the probability of elastic collisions increases with Ω. However, our experiments are operated in the low Ω regime, where PI increases with Ω. During the inelastic collision, if no spontaneous emission occurs, then the atom pair will gain the maximal amount of energy given by hΔ, which is the energy difference between the dressed states at large R. The atom pair will gain some amount of energy less than hΔ, should spontaneous emission occur at some point during the inelastic collision. Consequently, by controlling the frequency of the blue-detuned light, we can choose the energy released in each induced inelastic collision.
2.2. Collisions Induced by Red-Detuned Light
In the presence of red-detuned light, two atoms in the Ug state that cross Rc can undergo a transition to the attractive Ue state. In this state, the atoms attract and accelerate towards each other, gaining kinetic energy. During the acceleration, there is a probability of spontaneous emission to the ground state. When this occurs, the pair will have gained a kinetic energy, Kr, given by the difference between the excited state interaction energy at Rc and at the inter-nuclear separation at which the spontaneous emission happened (Rs) (see Figure 1). This means that there is no precise control over the amount of energy released in an inelastic collision induced by red-detuned light.
3. Experimental Setup
In our experiments, we use atoms trapped in an 828 nm FORT [52] and study collisions induced by an optical field. The first step of the experiments is to prepare a sample of atoms that we load into the FORT from a magneto-optical trap (MOT). We have the ability to measure the number of atoms inside the FORT from zero to 200 by using fluorescence detection of the trapped atoms. This allows as to determine the average number of atoms at any stage of the experiment.
3.1. Loading Atoms into a Microscopic Dipole Trap
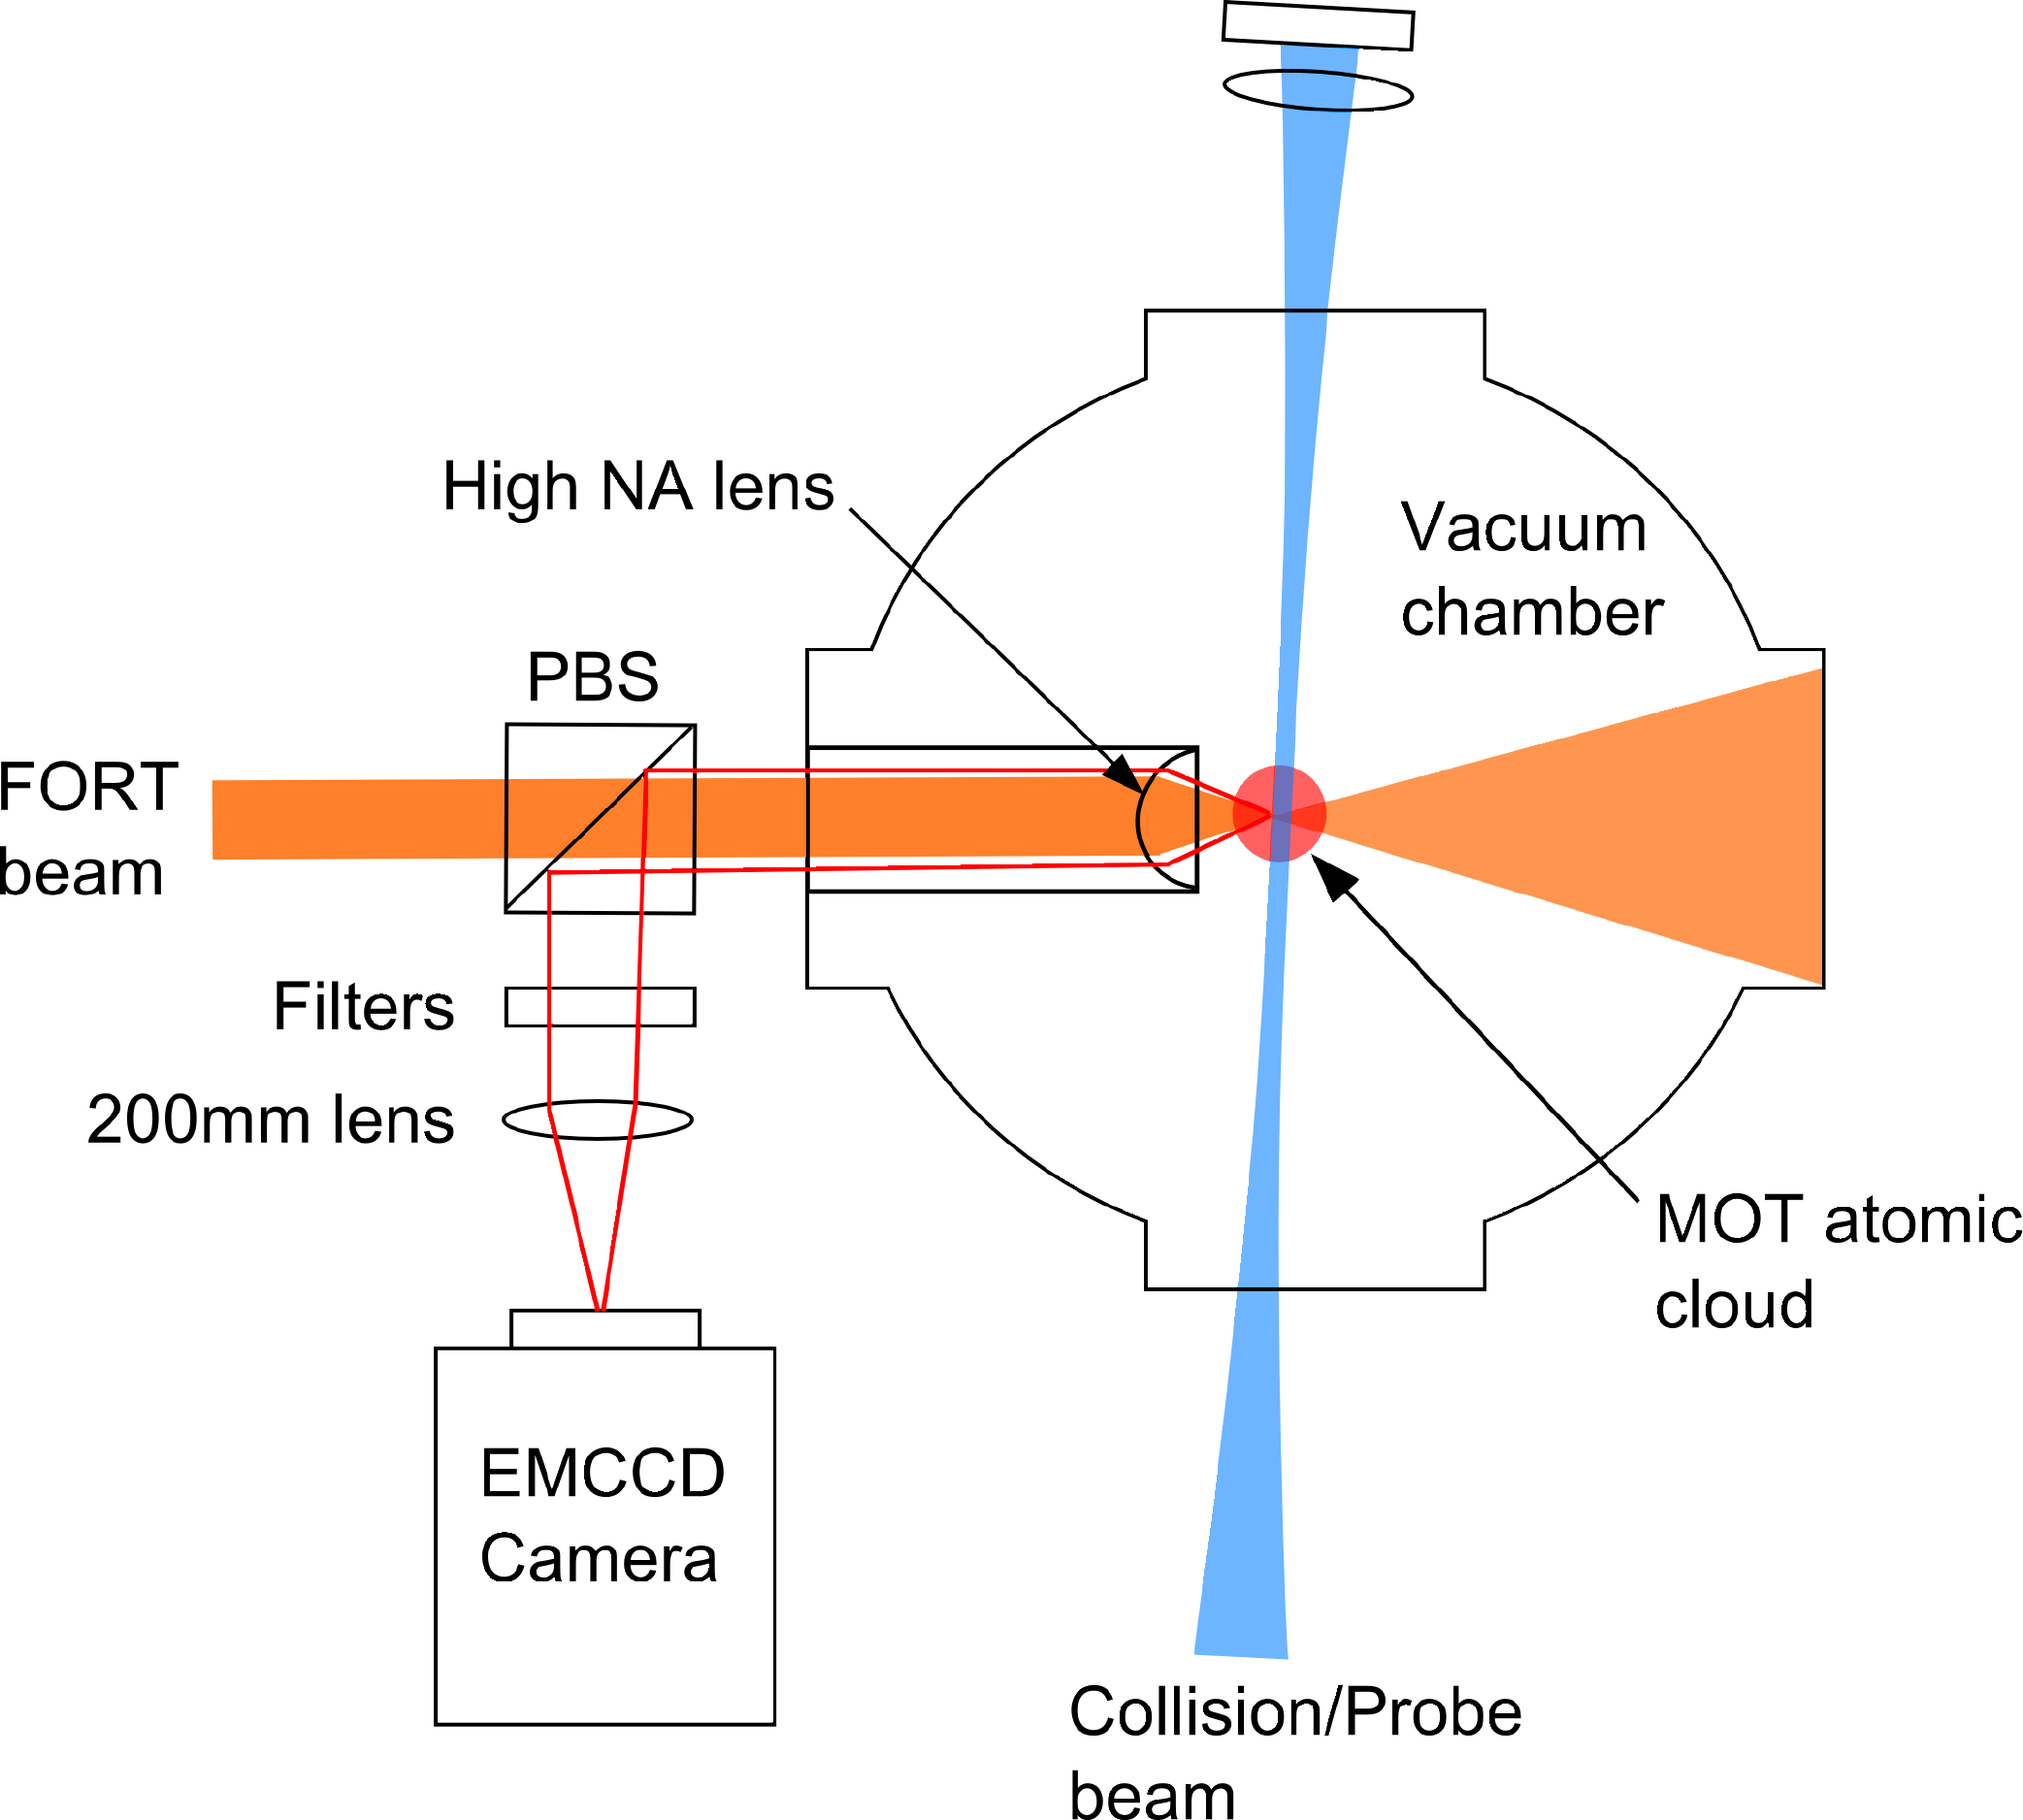
A drawing of our experiment is shown in Figure 3. The experiment takes place inside an ultra-high vacuum chamber, where the vacuum-limited lifetime of a trapped atom is about 60 s. The experiment chamber is connected to a source chamber containing a Rubidium (Rb) reservoir. This provides controllable constant flux of Rb into the experiment chamber. To prepare a small number of atoms, a MOT is used to cool and trap a cloud of 85Rb atoms. The MOT, which operates on the F = 3 to F′ = 4 transition of the D2 line, consists of three pairs of counter propagating beams with 6.4 mm diameter. Since the MOT beams may excite atoms from the F = 3 ground state to the F′ = 3 excited state, the atoms may decay to the F = 2 ground state through spontaneous emission events. A repump beam is included to optically pump atoms from the F = 2 ground state back to the transition used for the MOT. Up to about 105 atoms are loaded into the MOT. Then, a 150 ms compressed MOT (CMOT) phase increases the sample density and overlaps the center of the CMOT cloud with a FORT. The FORT is on during the CMOT and subsequent stages. The atoms are further cooled through a 5 ms polarization gradient cooling stage, and up to 200 atoms can be loaded into the FORT. The number of atoms loaded can be decreased by reducing the MOT loading time. The FORT is a Gaussian beam with a wavelength of 828 nm focused by a high numerical aperture (NA = 0.55) lens to a spot size of w0 = 1.8 μm, which is verified by Gaussian fitting to the cross sections of a magnified charge coupled device (CCD) camera image of the focused beam and further confirmed by trap depth measurement from fluorescence spectroscopy of single atoms. The beam power is 30 mW, corresponding to a trap depth of U0 = h × 85 MHz.
With 200 atoms, the peak density of our microtrap is about 3.5 × 1014 cm−3. High peak densities inside a FORT are usually prohibited, due to limiting factors, such as light assisted collisions, which lead to rapid atom loss from the trap [53,54]. A peak density on the order of 1014 cm−3 is high for a FORT without forced evaporative cooling. We achieve this density because the MOT beams efficiently pump the atoms at the center of the trap to the F = 2 hyperfine ground state during the loading of the FORT. This occurs because the FORT induces light shifts [55] that drive the MOT beams close to the F = 3 to F′ = 3 transition at the center of the trap (the light shift is 109 MHz). At the same time, the FORT also shifts the repump transition by 109 MHz away from resonance, so it cannot efficiently pump the atoms at the center of the trap back to the MOT transition. The atoms accumulated in the F = 2 hyperfine ground state are about 3 GHz off resonance with the MOT light. This prevents the MOT light from inducing light assisted collisions and, hence, allows higher peak densities. High-density traps are conducive for the exploration of light controlled atom-atom interactions, since the atoms are close enough to each other, such that light assisted collisions occur on short timescales.
3.2. Detection and Counting of Atoms
For some atomic physics experiments, it is necessary to have the ability to detect and count atoms inside a FORT. A standard technique is to collect fluorescence emitted from the atoms when they are exposed to red-detuned cooling light [56,57]. However, the red-detuned light drives light assisted collisions that cause rapid atom loss at high densities. This prohibits the counting of more than one trapped atom [45,56].
In our experiments, we induce the atoms to fluoresce with an imaging beam close to the D1 line at 795 nm. The use of the D1 line is motivated by the fact that the light shifts in the D1 transitions are independent of m-states, such that we can have well-defined detunings in our experiments. By using near resonant blue-detuned light, we limit the energy released in each inelastic light assisted collision to less than the FORT potential depth. However, a blue detuned probe beam may cause the atoms to preferentially pick up the recoil momentum of the absorbed photons along the direction they move, causing Doppler heating and subsequent atom loss. To counteract Doppler heating, the beam is retro-reflected to form an optical standing wave. The resulting spatial intensity modulation of the imaging beam leads to a form of Sisyphus cooling that counteracts the Doppler heating [58]. As a result, atom loss is reduced, allowing us to accurately count several atoms in the FORT. Our probe beam has a Gaussian intensity profile with a peak intensity of 142 mW/cm2 (unless otherwise stated) and is blue detuned from the D1 F = 2 to F′ = 3 transition for an atom at the center of the FORT. Since there is no cycling transition on the D1 line, an excited atom can decay to either of the two ground states (F = 2 and F = 3). To ensure that the atoms are always optically pumped back to the F = 2 ground state, some of the light in the probe beam is shifted by about 3 GHz, such that it is resonant with the D1 F = 3 to F′ = 3 transition. In addition, during detection, we use the six cooling beams (also used during the MOT and molasses stages) slightly detuned from the D2 F = 3 to F′ = 3 transition to return atoms at the center of the trap to the F = 2 ground state. We denote the combination of the probe beam and the six cooling beams as the imaging light.
The fluorescent light from the atomic sample is collected by the high numerical aperture (high NA) lens used to focus the FORT laser beam (see Figure 3). Afterwards, it is reflected by a polarizing beam splitter. It then passes through optical filters (used to remove stray light) and a second infinity corrected lens of a focal length of 200 mm that causes it to form an image on an electron-multiplying charge coupled device (EMCCD) camera. The high NA lens collects 10% of the fluorescent light, which combined with the total transmission of 37% of the optics and a measured quantum efficiency of the EMCCD camera of 60%, gives a total photon detection efficiency of 2.3%.
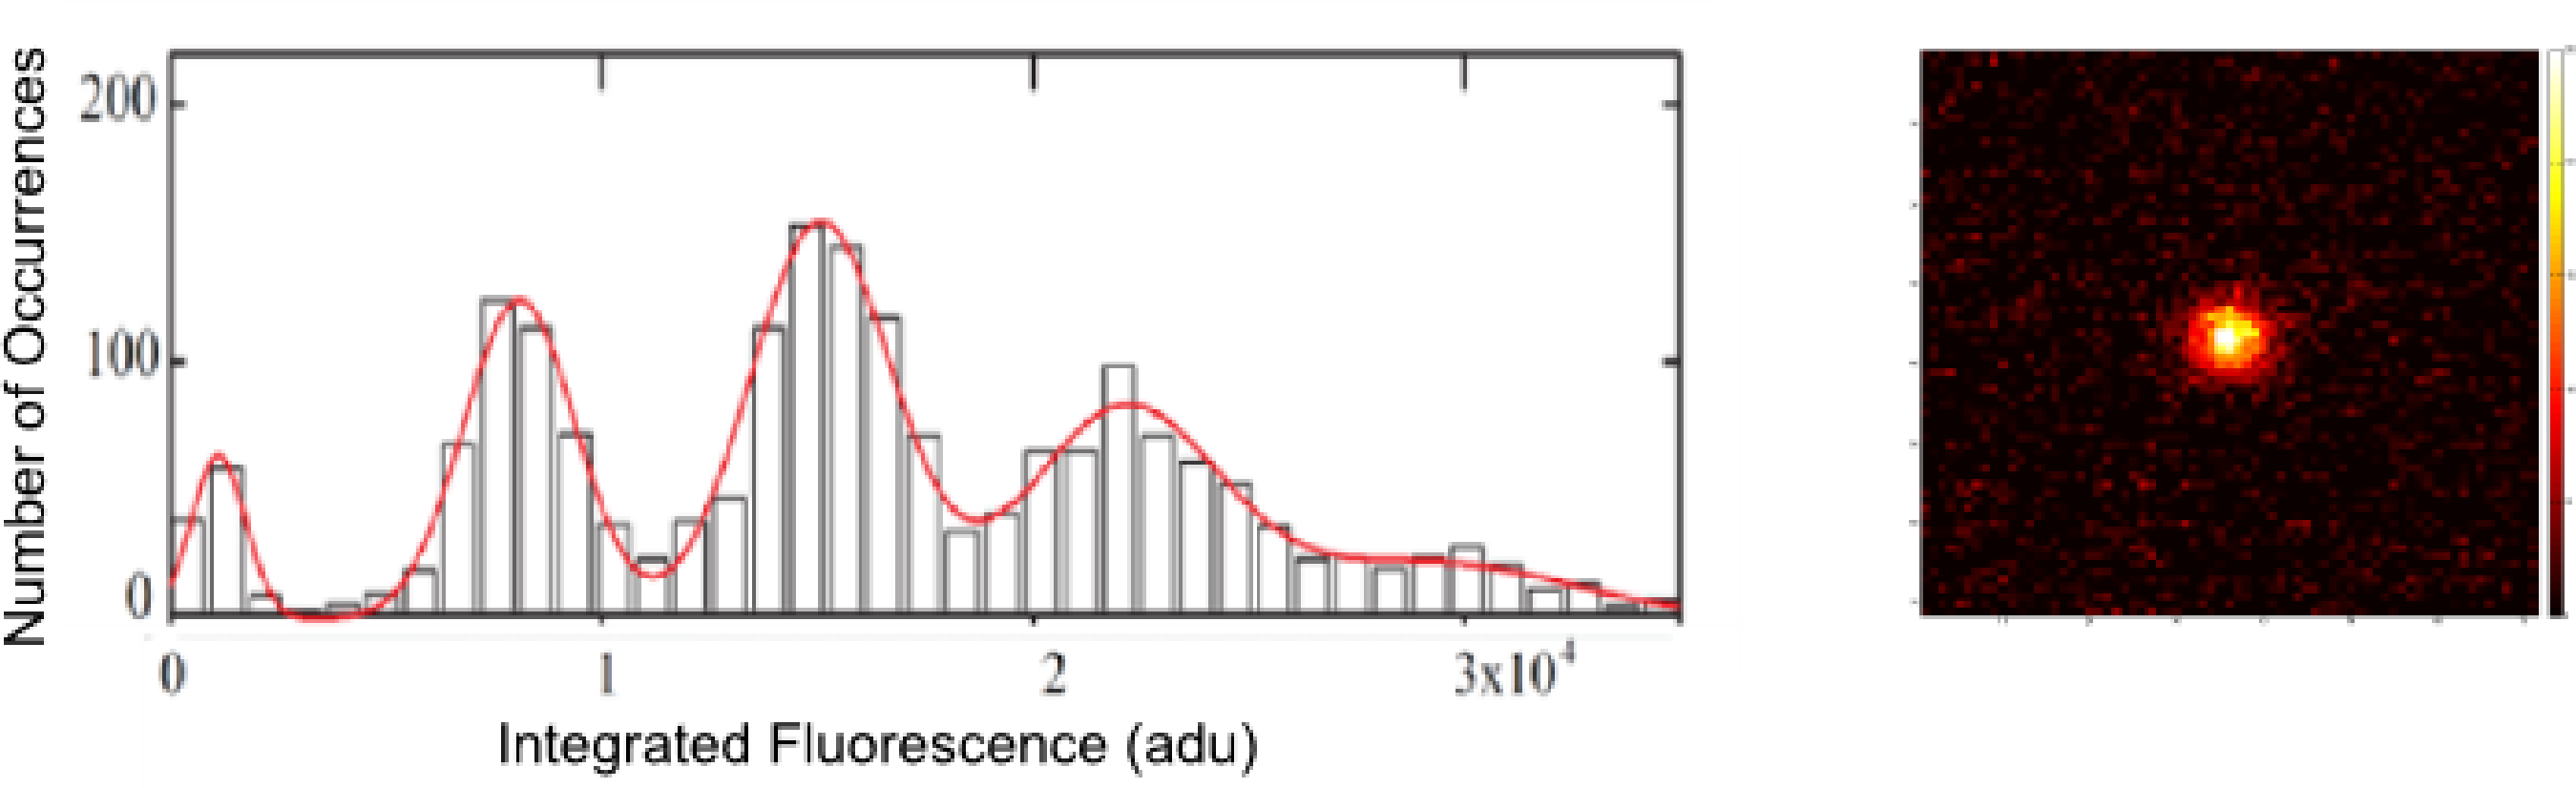
To determine the number of trapped atoms, we expose them to a 10-ms rectangular pulse envelope. The EMCCD camera collects the fluorescence from the atoms while they are exposed. The total fluorescence detected is calculated by integrating the area of the picture where the atom is imaged. Figure 4 shows a histogram of the integrated fluorescence signal (with the gain settings of the EMCCD camera used in our experiment, 1 detected photon increases the signal by, on average, 21 analog-to-digital units (adus); however, the camera cannot resolve individual photons) for 2, 000 experimental runs. The peaks represent 0, 1, 2, 3 and 4 atoms and become more unresolved as the number of atoms, N, increases. This is because the collision rate scales as N (N − 1). For large N, the high rate of light assisted collisions causes significant heating and, thereby, atom loss, prohibiting us from counting the number of trapped atoms non-destructively.
In order to determine the number of atoms for N larger than 4, our approach is to account for the atom loss during the exposure to imaging light. This allows us to subsequently deduce the averaged initial and final atom number. We proceed as follows:
The atom loss rate due to collisions and one-atom losses is described by:
Solving Equation (3) gives:
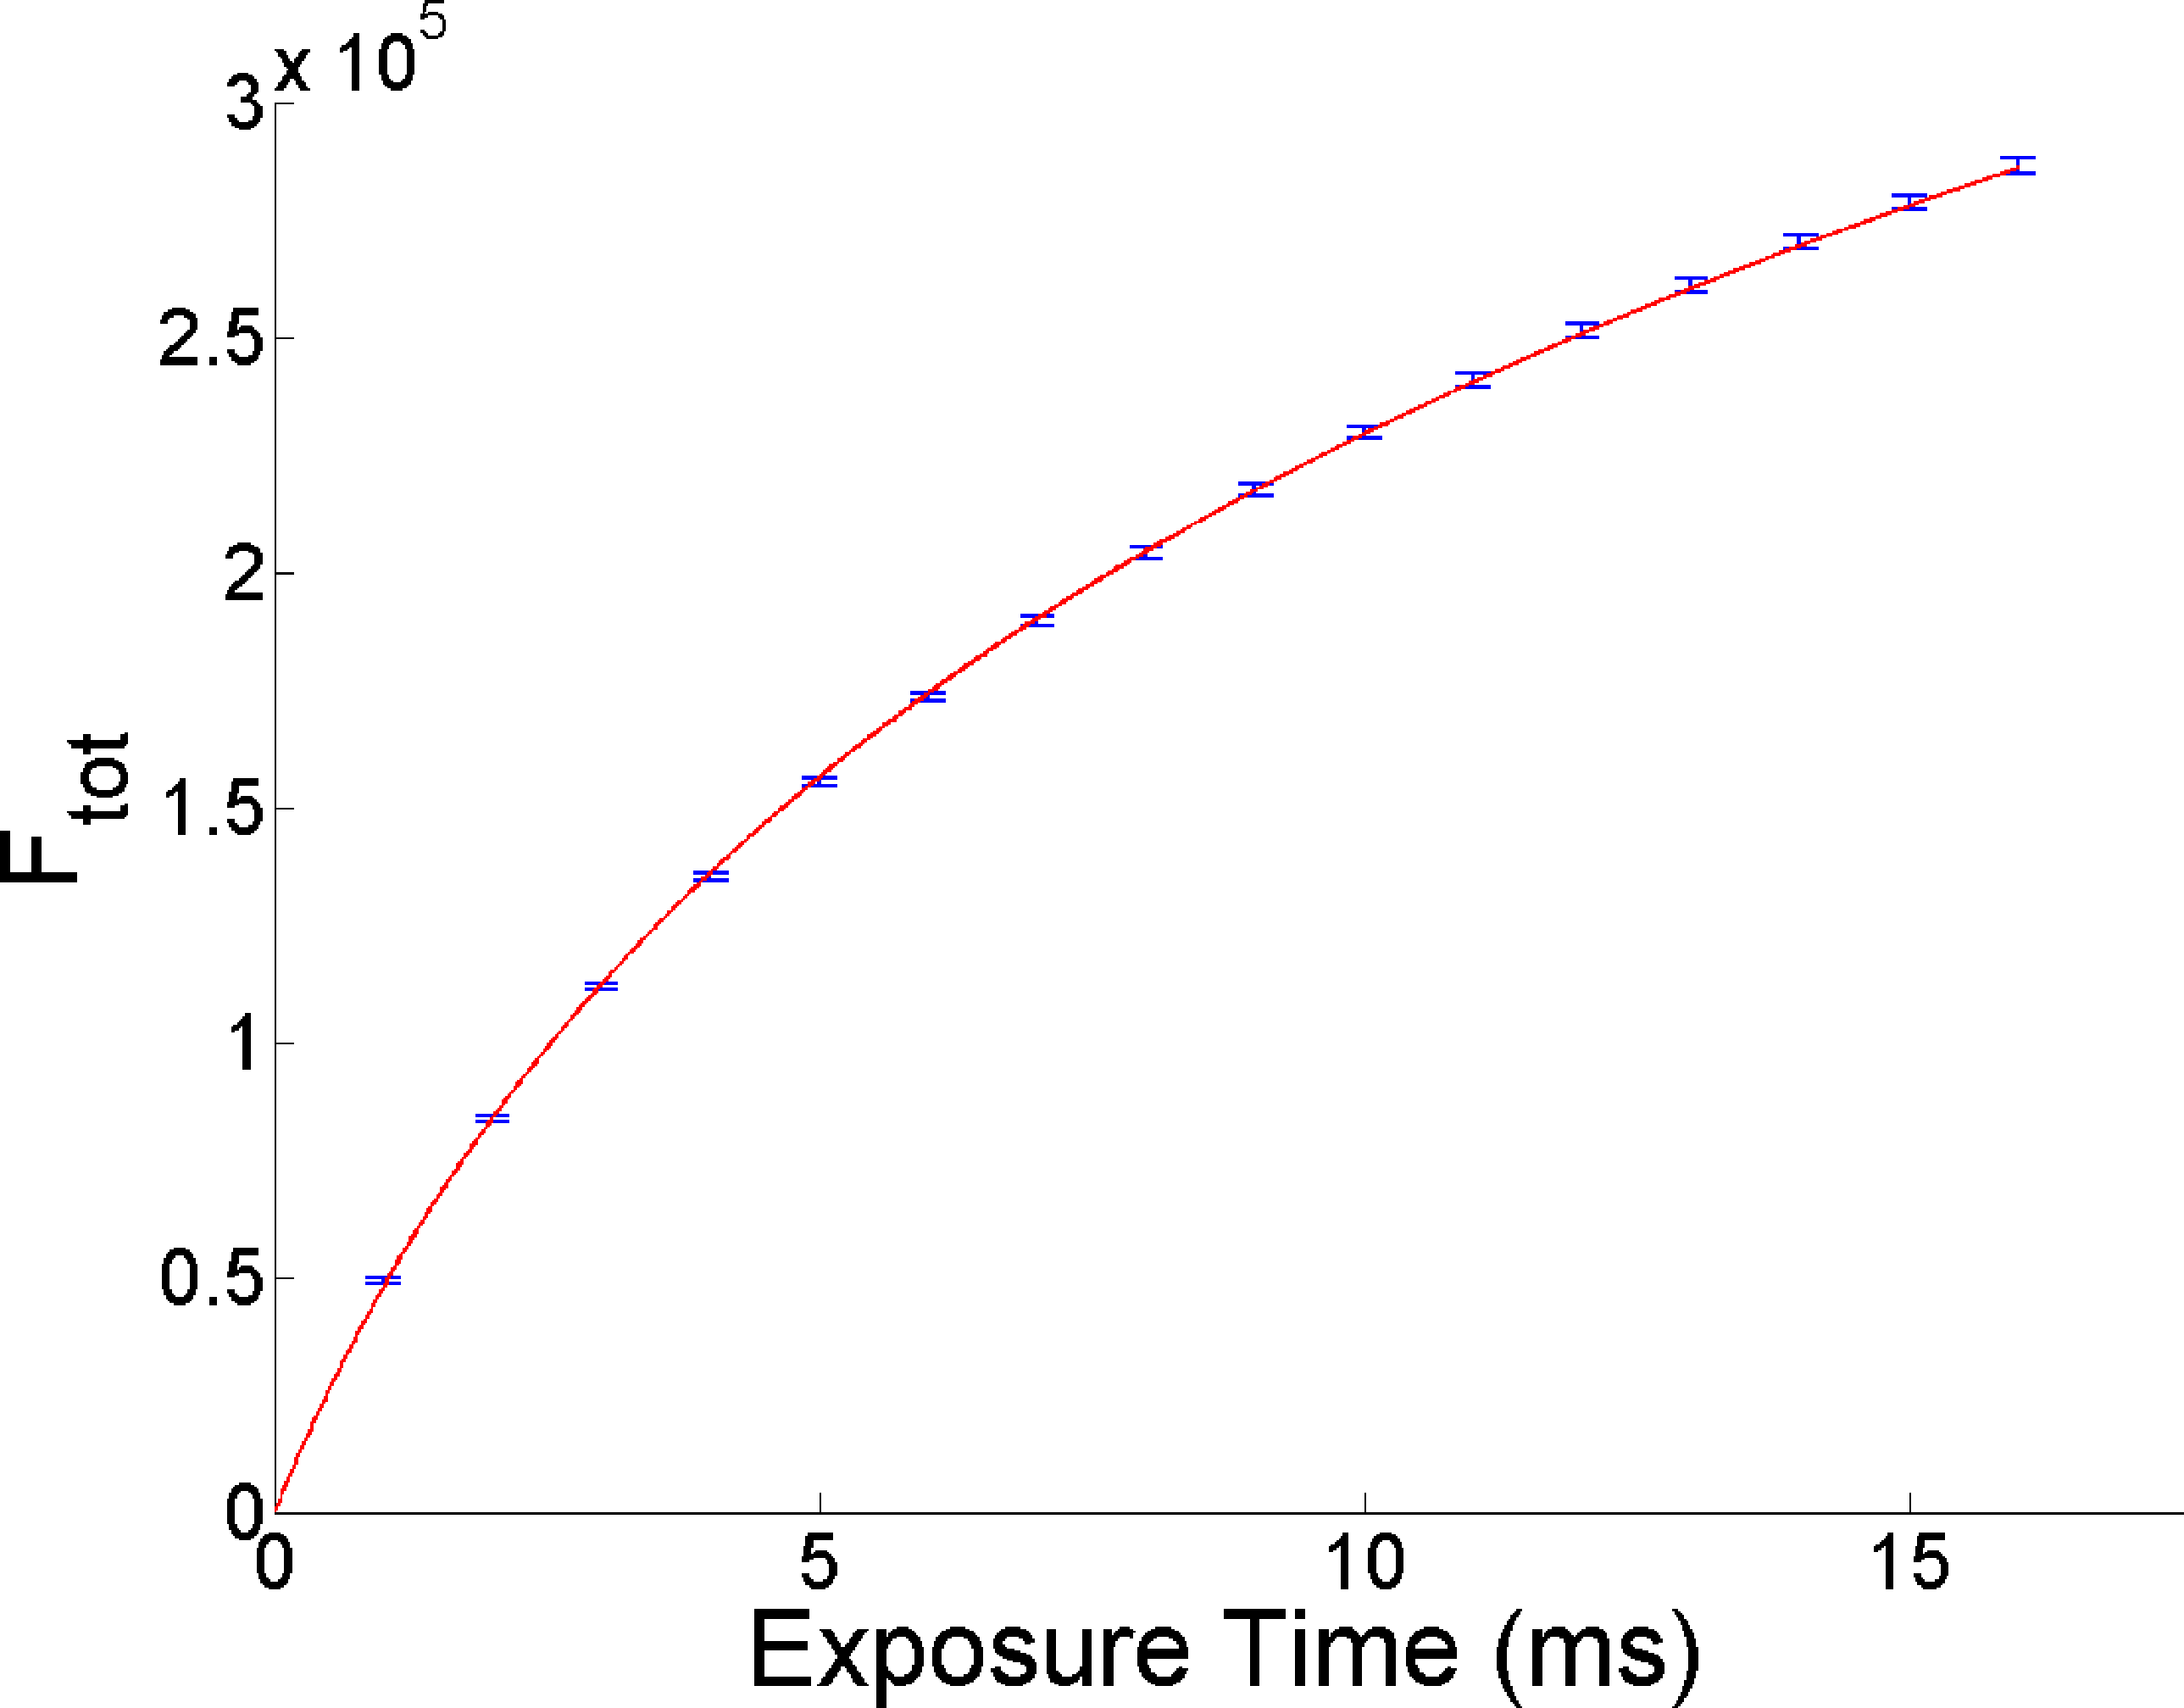
Experimentally, we measure the integrated fluorescence of the atomic sample as a function of time, averaged over several runs. After preparing an atomic sample of N0, we take several successive fluorescence images of it, each with 1 ms exposure time, and register Ftot for each image. We then induce light assisted collisions with another light beam to reduce the atom number down to one or zero before taking a final fluorescence image of 10-ms exposure time to determine F1, as well as the background light level. After that, we plot the accumulated Ftot versus exposure time, as shown in Figure 5. We measure α by preparing a single atom and measuring its survival probability at different imaging light exposure times. From the survival probability, we can deduce the single atom loss rate due to the imaging light. We then fit the data of the Ftot versus exposure time graph with Equation (6) using the measured values of F1 and α, with the free parameters being N0 and β. Figure 5 shows an example. The gradient of the Ftot curve decreases with the exposure time, indicating that N gradually decreases due to atom loss.
4. Study of Collisional Events at Individual Levels
Typically, experiments on light assisted collisions or photo-association of cold atoms are conducted on large samples. The shortcoming of such experiments is that the trap loss will be described by averaged parameters, such as β and α, as we did in the previous section. Studying individual events reveals information that is not accessible in experiments using large samples. Recently, there has been interest in observing individual photo-association events by immersing a single trapped ion into a bath of neutral atoms [60,61].
The earliest studies of light assisted collisions at the individual event level were conducted using small samples of atoms in a high gradient MOT [62,63], where it was reported that up to 10% of the loss events from the MOT are collisional one-atom losses. More recent work [64] reported a surprisingly large normalized two-body loss rate, in a study of light-assisted collisions in a microscopic dipole trap typically loaded with three atoms.
In this section, we investigate light assisted collisions induced by blue-detuned light by preparing exactly two atoms in the FORT and observing their dynamics. This allows us to investigate the collisional trap loss processes at the individual event level. We prepare the initial atom pair by starting with a low number of atoms in the dipole trap and then count the atoms and select realizations with two atoms present. With only two atoms taking part in the experiment, we can provide a detailed numerical model of the process and compare it with our results.
4.1. Evolution of Two Atoms Undergoing Light Assisted Collisions Inside a FORT
Inside the U0 = h × 85 MHz deep FORT, we induce collisions between the two atoms by using a “collision beam” blue detuned by Δc = 85 MHz from the D1 F = 2 to F′ = 3 transition at the center of the trap. It has a power of 11 μW and a waist of w0 = 150 μm at the position of the atoms. Simultaneously, we include the six MOT cooling beams with reconfigured frequency and intensity to cool the atoms between collision events. We denote the combination of collision and cooling beams, the light assisted collision (LAC) light. Note that since the FORT light is far off-resonance, it does not induce light assisted collisions between the atoms. This was experimentally verified by preparing a pair of atoms and observing that they both remained trapped for typical durations of our experiments when no other light was present.
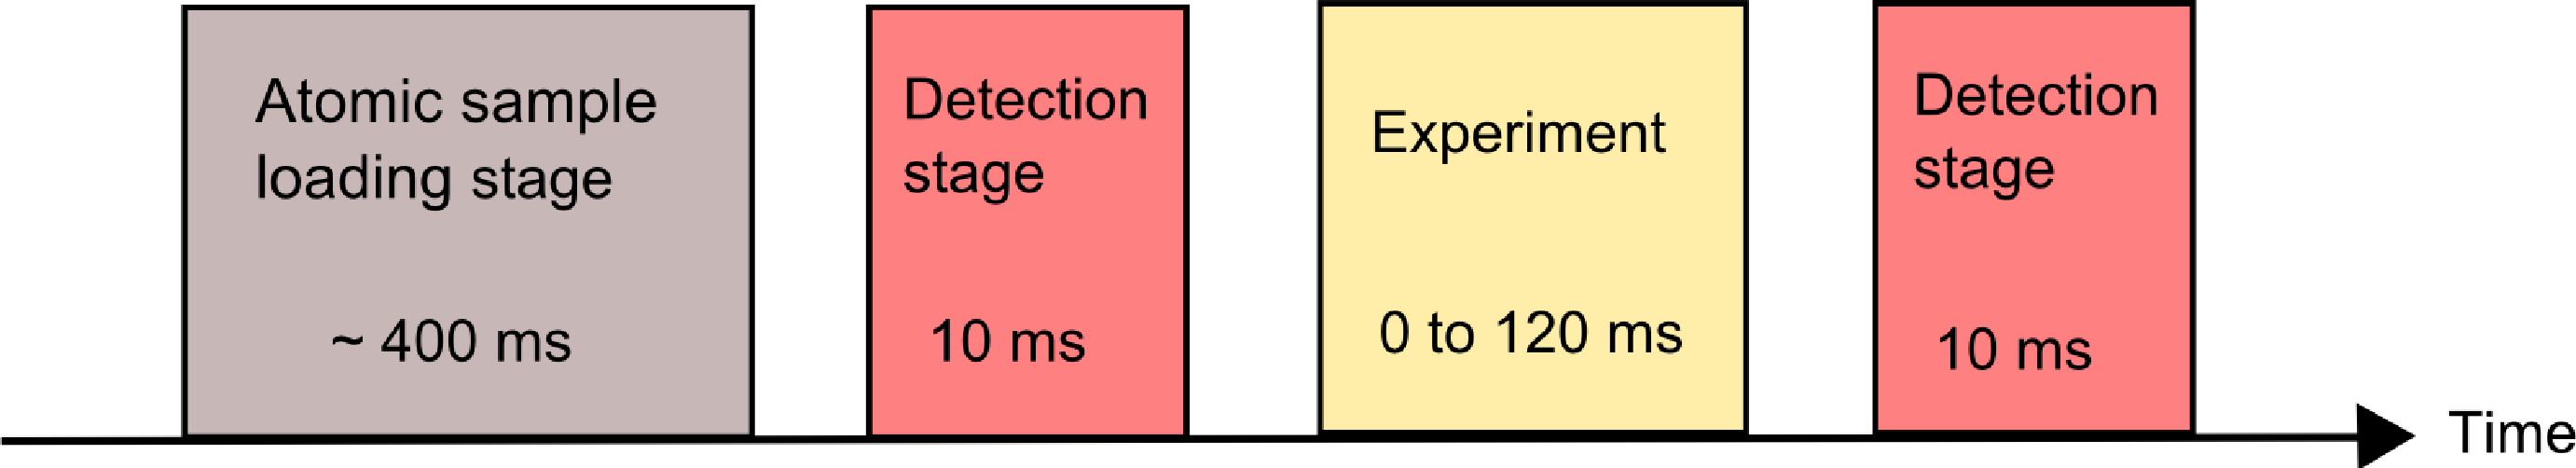
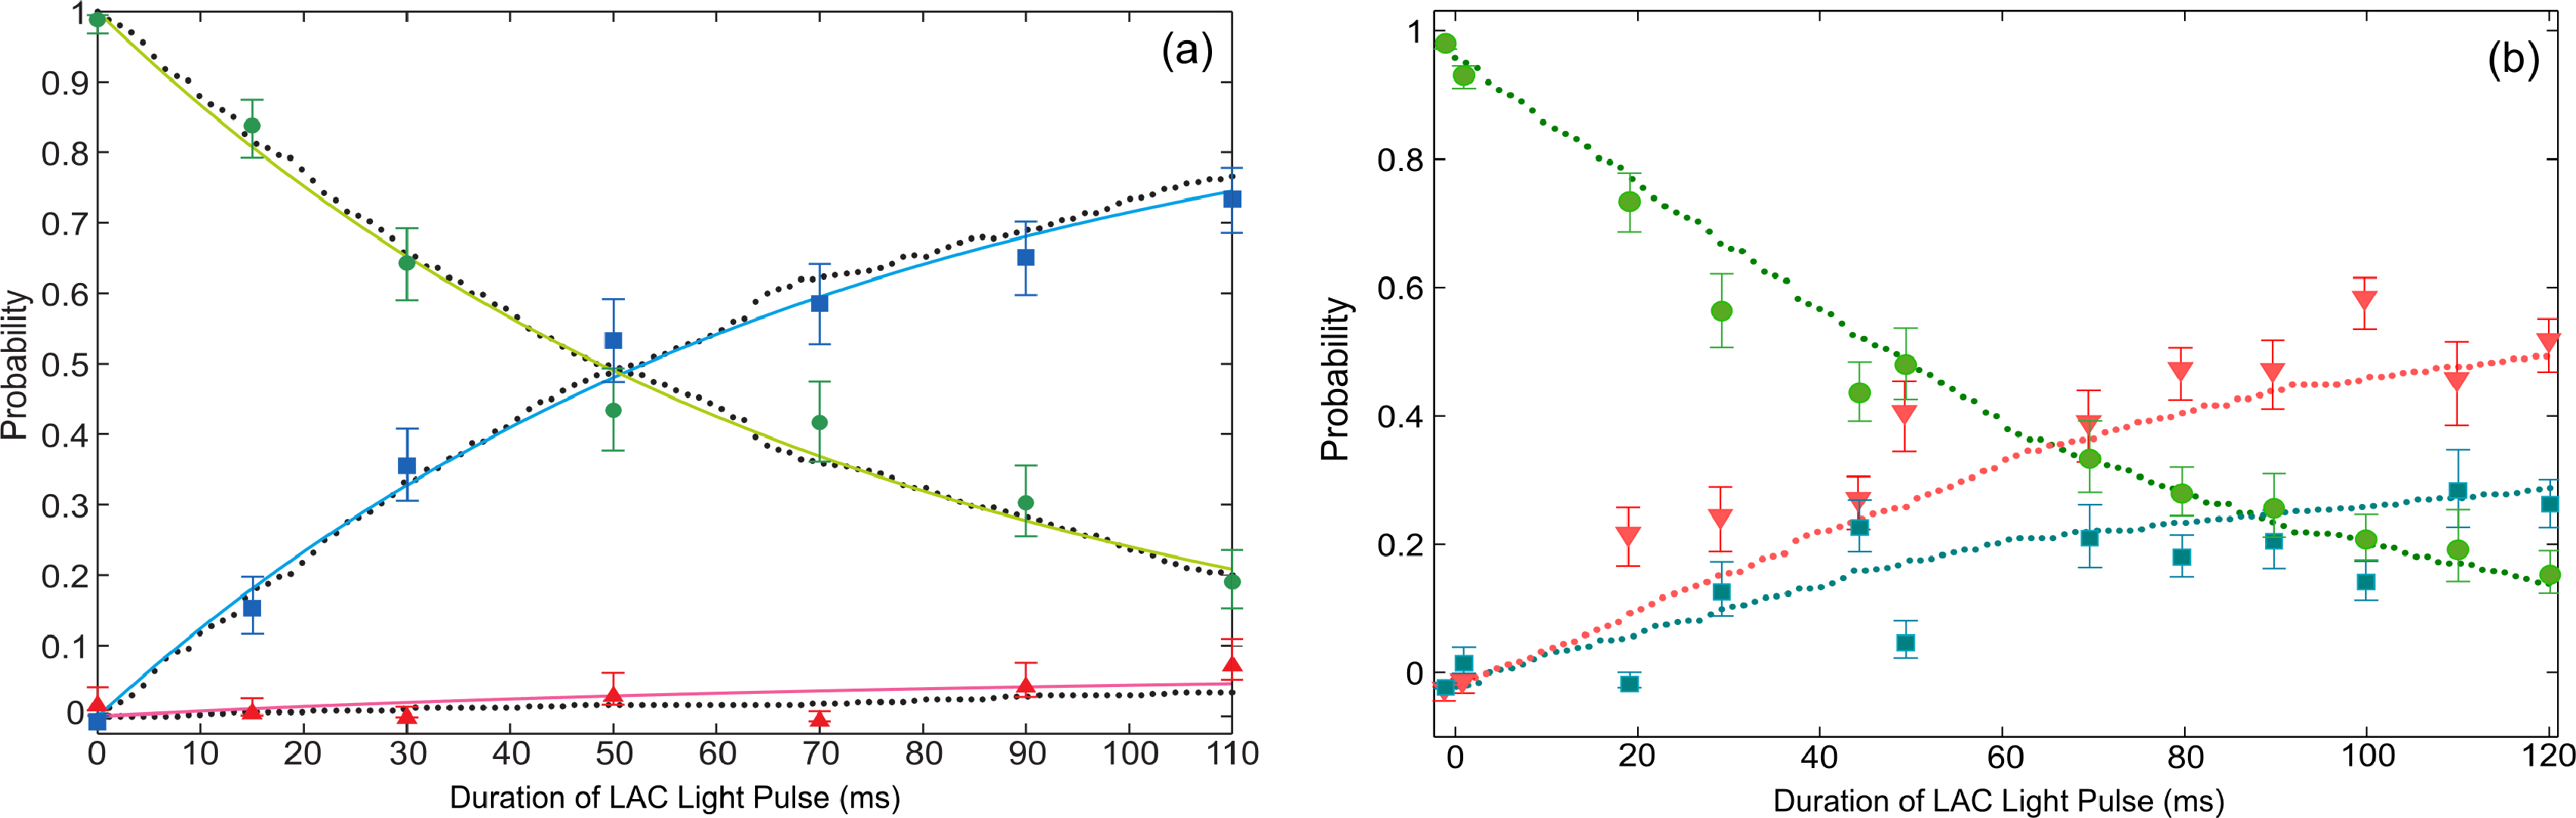
Using the sequence illustrated in Figure 6, we have studied the evolution of two trapped atoms under the influence of LAC light. The result is plotted in Figure 7a. We used the first detection stage to select the realizations with two trapped atoms. We then varied the LAC light pulse duration, Δt, to explore the time evolution of the atoms inside the FORT. After that, we determined the number of atoms (zero, one or two) remaining in the trap using a second detection stage. By repeating the experiment 180 times, we measured the probabilities of obtaining zero, one or two atoms. The fitted curve in Figure 7a yields a pair decay time of 70 ms. We can see that the most probable outcome of a trap loss event is that only one of the two atoms is lost (2–1 decay) for the LAC light parameters used.
We define our potential, such that U(0) = −U0 and U(x) = 0 far from the trap (x is where the collision happens). An atom is lost once its kinetic energy exceeds |U (x)|. For 2–1 decay to dominate, as observed in Figure 7a, an inelastic collision needs to release enough energy for one, but not for both, of the atoms to escape from the FORT. Both atoms will be lost (2–0 decay) when a collision gives out sufficient energy, such that the subsequent individual kinetic energies (K1 and K2) both exceed |U (x)|. This scenario can be suppressed when using blue-detuned light by the appropriate choice of Δ (see Section 2.1). The atom pair will most likely gain an amount of energy hΔ and have pair kinetic energy Kp = K1 + K2 above |U (x)| after colliding, but this does not guarantee that an atom will escape from the FORT, since K1 and K2 can both be lower than |U (x)| when Kp < 2 |U (x)|. For only one atom to be lost as a result of a collision, the pair of atoms must have a center of mass momentum prior to the collision, such that the atoms will share the Kp unevenly. In this way, one of the atoms can have a kinetic energy higher than |U (x)| and get lost, leaving behind only one atom in the FORT. For collisions where the atom pair share Kp, such that K1, K2 < |U (x)| (neither is lost), there is a probability that a second inelastic collision will give both atoms enough energy to escape from the FORT altogether. This scenario can be avoided by using the cooling beams to remove some of the Kp between inelastic collisions. Each of the cooling beams has a power of 0.64 mW, and they are 4 MHz red detuned from the D2 F = 3 to F′ = 3 transition for atoms at the center of the FORT. Since the atomic density drops with increasing Kp, at high Kp, the collision rate decreases. The cooling beams will then have time to lower the energy of the pairs between collisions. This mechanism decreases the chance of 2–0 decay.
4.2. Pair Dynamics Simulation
Since we are performing our collision experiments with a system consisting of only two atoms, the dynamics of the process can be modeled numerically. This can be used to verify our explanation of the physics behind the experimental data. The numerical simulation is based on three essential elements: the initial selection of two atoms from a Maxwell–Boltzmann distribution, the calculation of the trajectories of two atoms inside the FORT while undergoing laser cooling and the determination of the probability of two atoms undergoing an inelastic collision event (PI) when they reach Rc.
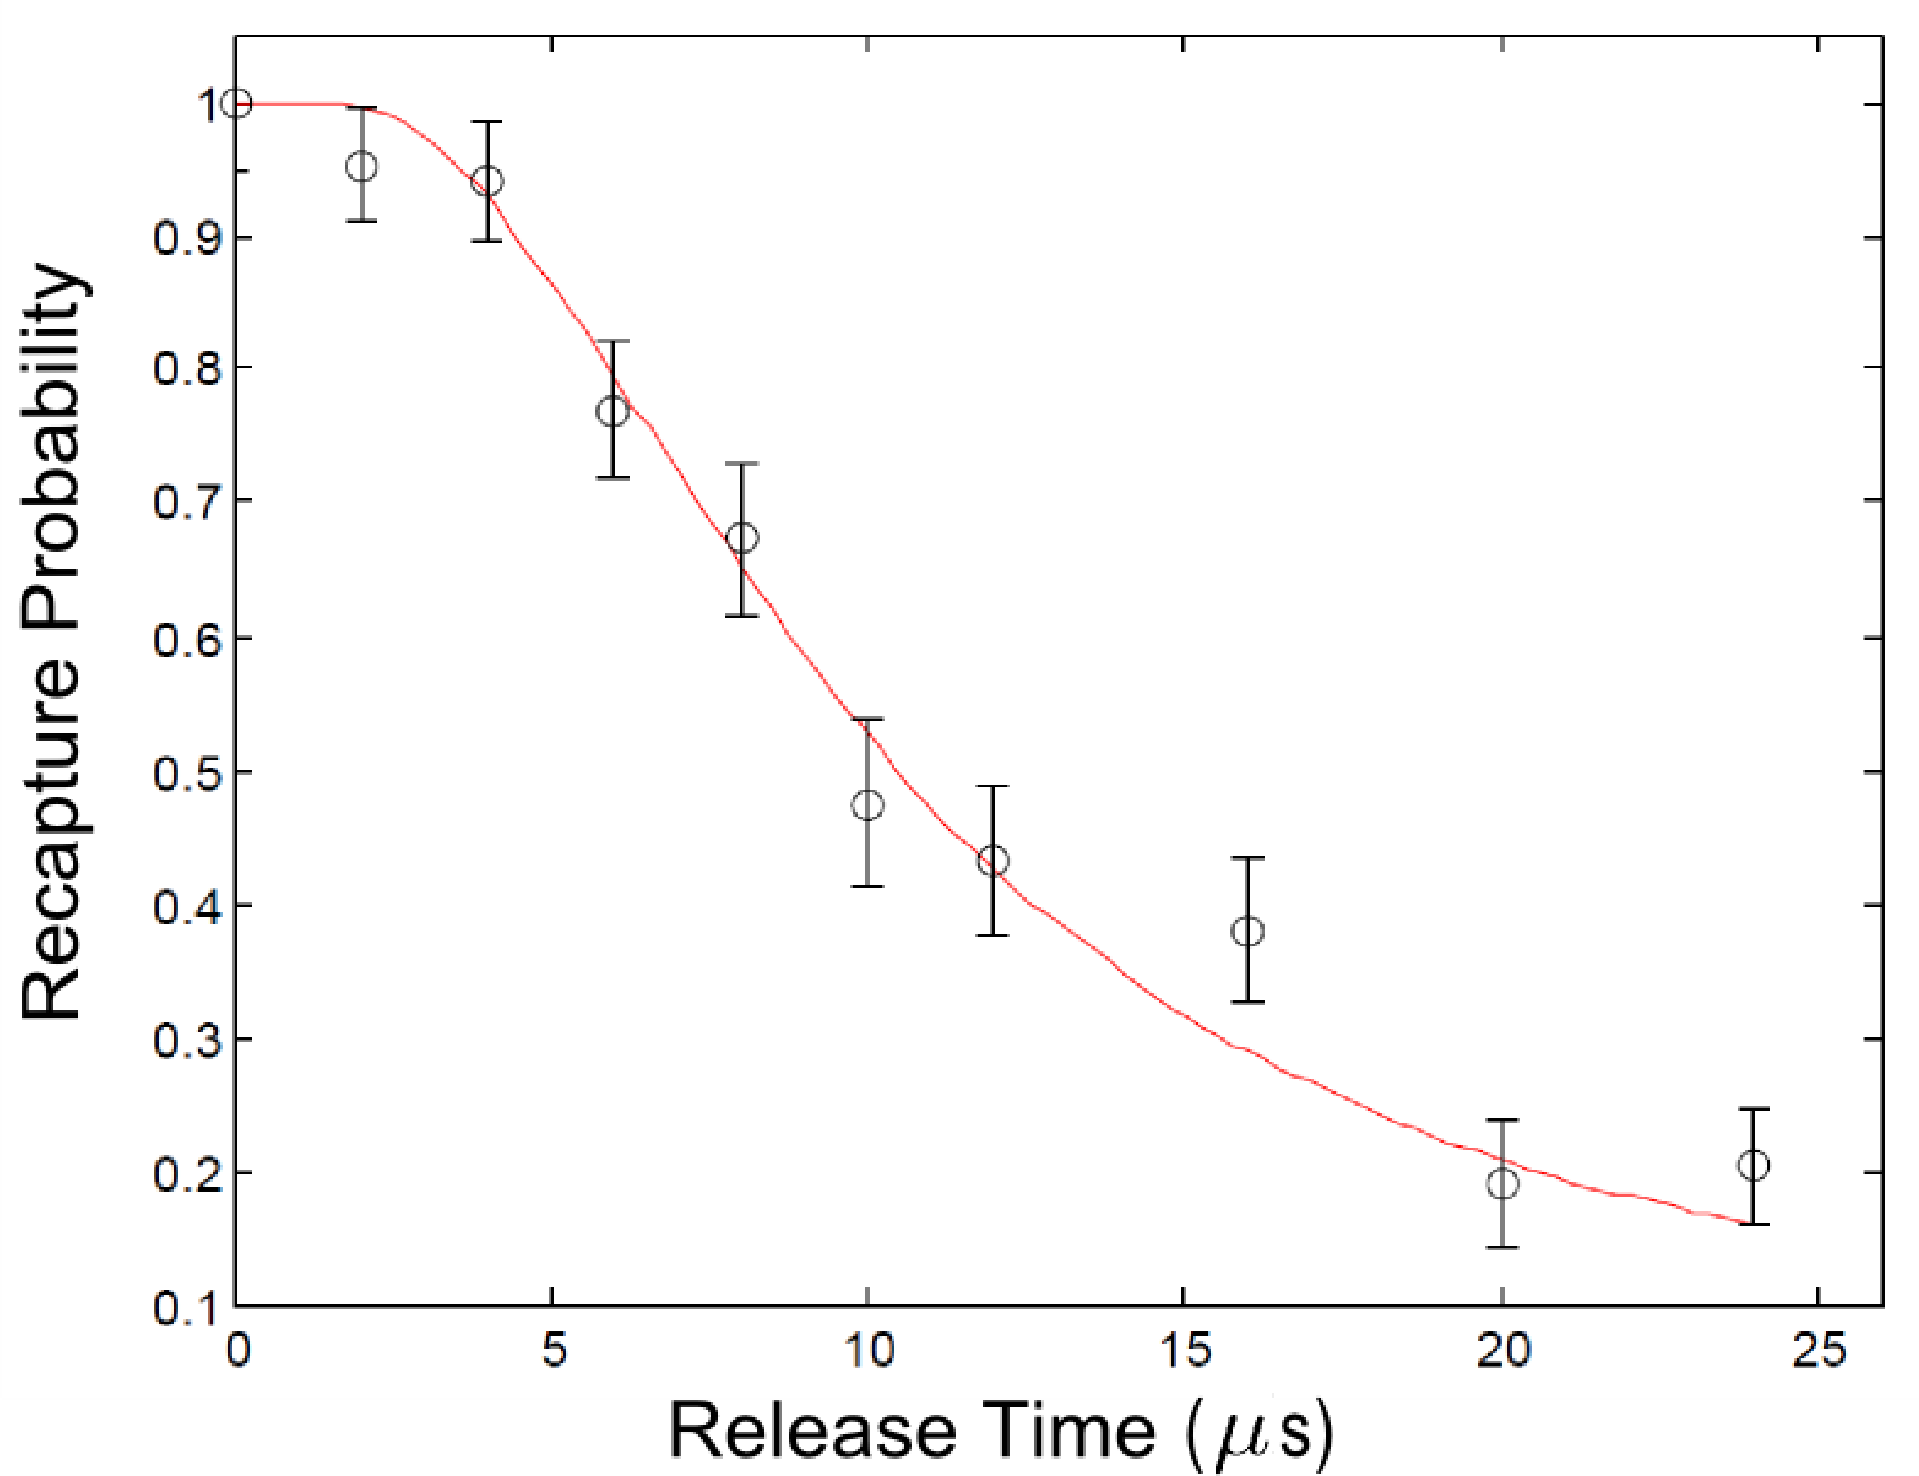
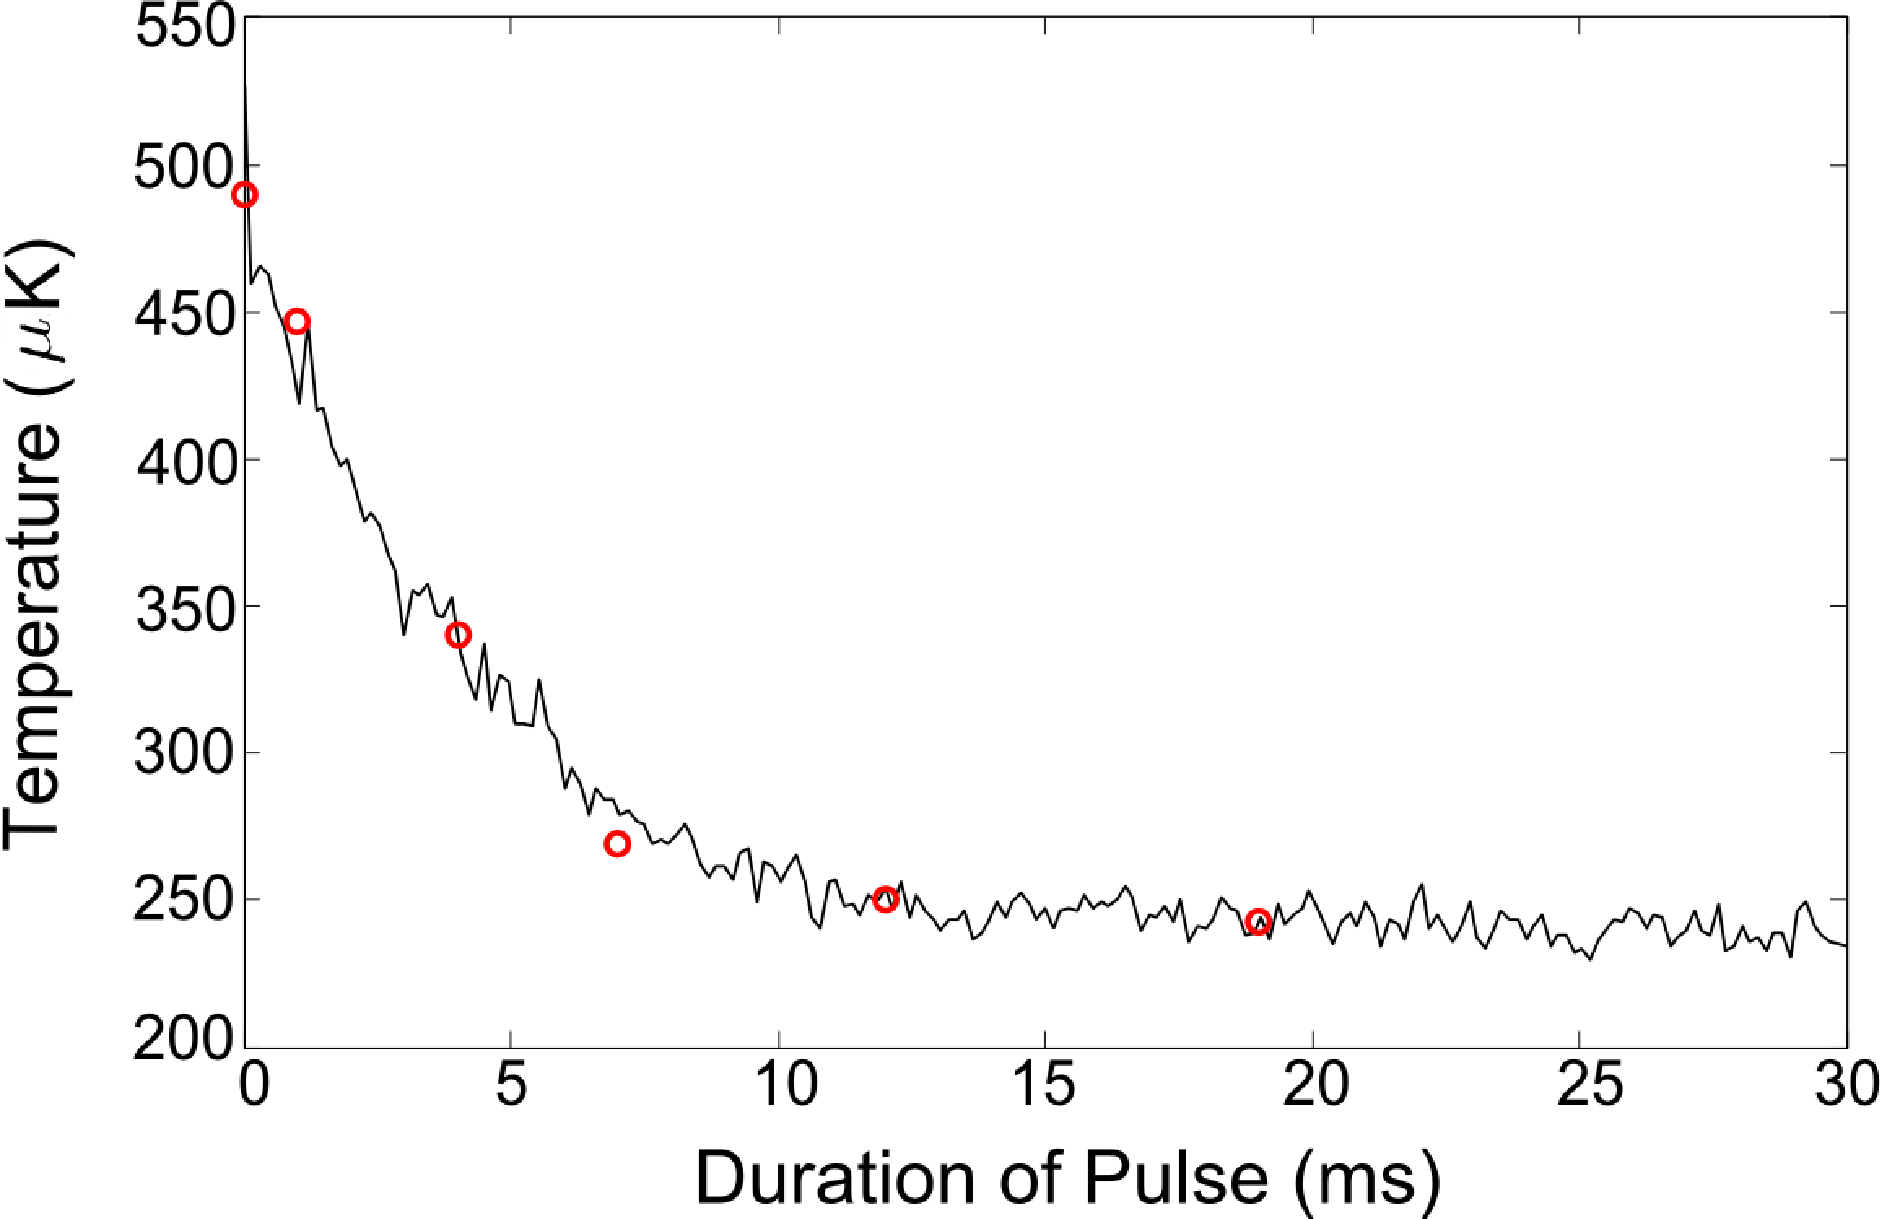
The initial temperature of the atom pairs in the experiment is measured by using a release and recapture method [66]. Figure 8 shows the measurement alongside a Monte Carlo simulation corresponding to a temperature of T = 280 μK. The pair dynamics simulation starts by randomly selecting two atoms from a Maxwell–Boltzmann distribution with this temperature. Afterwards, we determine the motion of the atoms in the FORT, which is treated as a Gaussian potential. This involves the computation of the classical trajectories of the atoms using a 4th order Runge–Kutta algorithm and the simulation of the effect of laser cooling on the atoms. For this, we determine the momentum change of an atom if it, in a time step, scatters a photon from any of the six laser cooling beams. The photon scattering probability is given by the two-level Doppler shifted absorption rate [67]. In order to determine suitable detuning and intensity for the Doppler cooling model, we experimentally measured the temperature evolution of an atom under the influence of the LAC light. This was done by heating up the atom and measuring its temperature after it had been cooled by the LAC light for different pulse durations. The parameters of the model are adjusted, such that the temperature evolution of a simulated single atom agrees with the measured temperature evolution. In Figure 9, we show an example of the results of the experiment and the adjusted Doppler cooling model, which corresponds to an exponential decay with time a constant of 5 ms to an equilibrium temperature of 250 μK.
Each time the two atoms reach Rc, an inelastic collision will happen with probability PI (see Equation (2)). A quantity of energy equal to hΔ is then transferred to the atom pair, such that the center of mass momentum is conserved and the change in the individual atoms’ momentum is along their inter-nuclear axis. Since collisions are most likely to happen at the center of the trap, we assume that the atoms are in the F = 2 ground state when computing PI, and so, we use Δc for calculating Rc. When an atom has gained a kinetic energy higher than |U (x)|, it is considered lost.
To quantitatively compare the model to our experimental data, we generated the probabilities for obtaining zero, one or two atoms as a function of time by averaging over 500 simulation runs. The simulated results are exhibited alongside the experimental data in Figure 7a, showing good agreement. In order to compensate for the simplicity of the two-level molecular model in predicting PI, we adjusted the Rabi frequency, Ω, in PLZ, such that the two-atom decay time in the simulation is consistent with the experiment. Figure 7b shows a similar set of data and simulation using different collision beam parameters (Δc = 185 MHz and 7 μW of the collision beam power). Again, there is good agreement, and the adjustment factor for the Rabi-frequency matched that of Figure 7a within 7.5%.
5. Deterministic Preparation of Single Atoms
The efficient preparation of a single atom has been a subject of interest in recent years. The loading of degenerate gases to an optical lattice followed by a quantum phase transition to a Mott-insulator state efficiently loads single atoms into each of the optical lattice sites [40,57]. Light assisted collisions have been used to redistribute atoms in an array of traps [68] and to isolate single atoms in an optical microtrap [52,56,69,70].
In this section, we will explain how we can prepare single atoms in a FORT with an efficiency of 91%. We will also investigate the roles of each beam parameter used during the process and explain how these parameters affect the single atom loading efficiency.
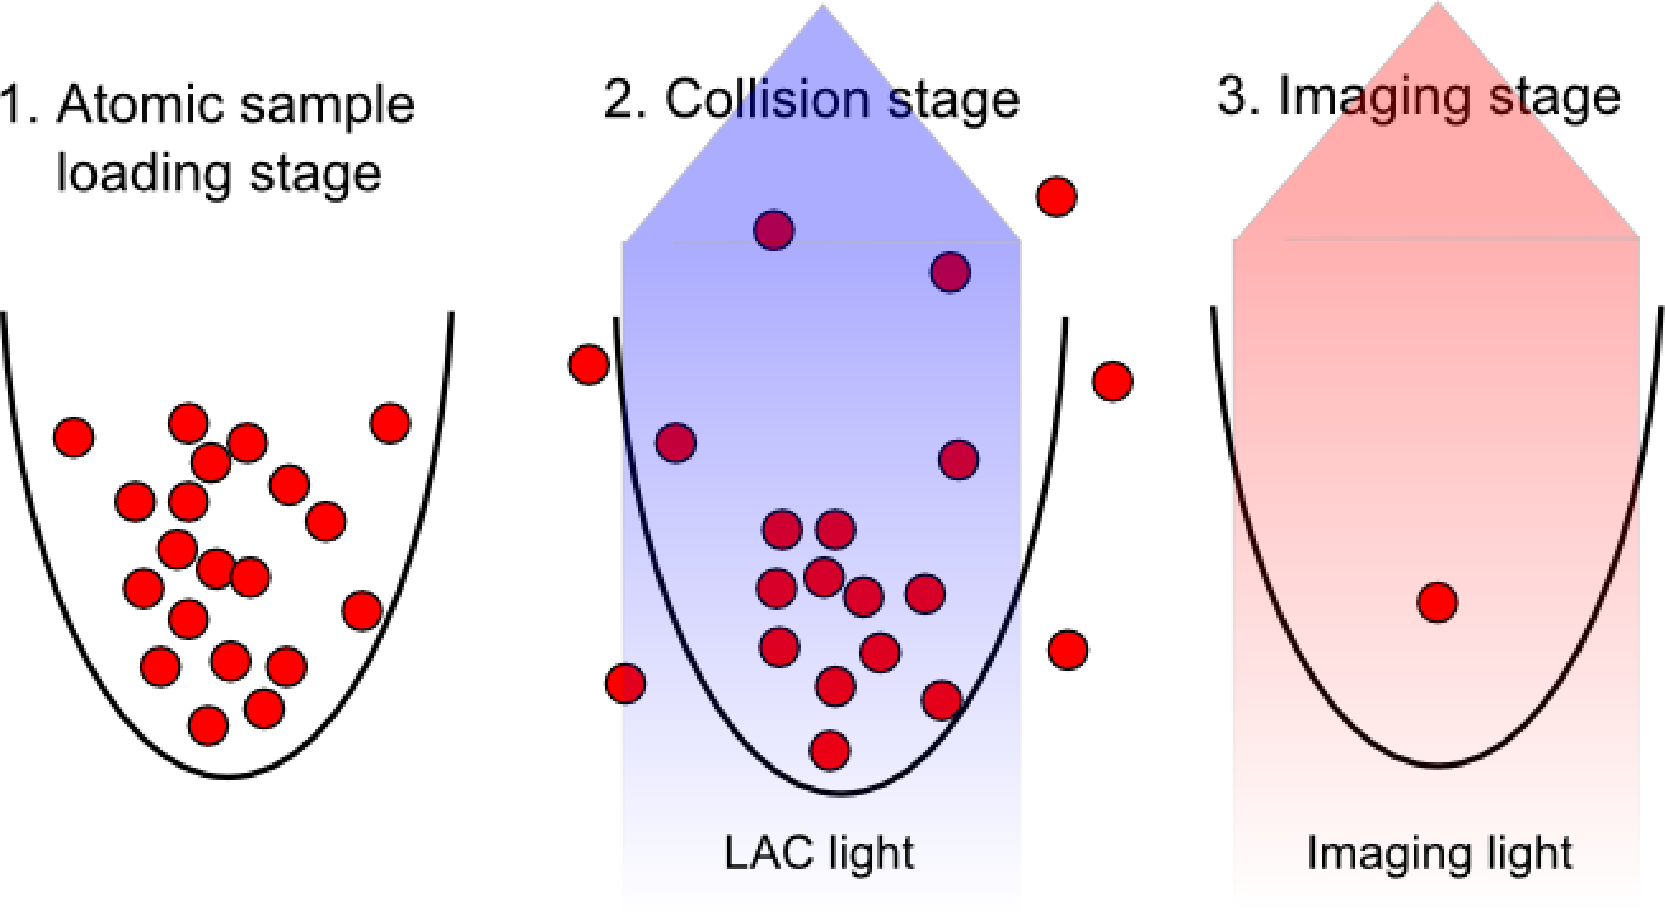
Our target is to find a deterministic way to prepare exactly one atom in a FORT. The stages of the experiment are illustrated in Figure 10. First, we load enough atoms from the CMOT into the FORT, such that the probability of starting with zero atoms inside the FORT is almost zero (we typically load about 20 atoms into the FORT). We then apply the LAC light on the atoms. The LAC light induces light assisted collisions in which the atoms can gain energy and get lost from the trap one by one through the 2–1 decay channel described in the previous section. Once there is only one atom left in the trap, no more collisions will happen, and the final atom remains. Finally, we determine the number of atoms left in the trap. To achieve high single atom loading efficiency, two different processes that can cause a zero-trapped atom outcome have to be minimized: processes where a single atom is loaded before the end of the LAC pulse duration, but is lost before the imaging stage, and processes where the final pair of atoms in the trap is lost upon a collision. As we will see below, the first can be minimized by having a long single atom lifetime, while the latter can be minimized by choosing appropriate parameters for the LAC light.
5.1. Dependence on Collision Beam Detuning
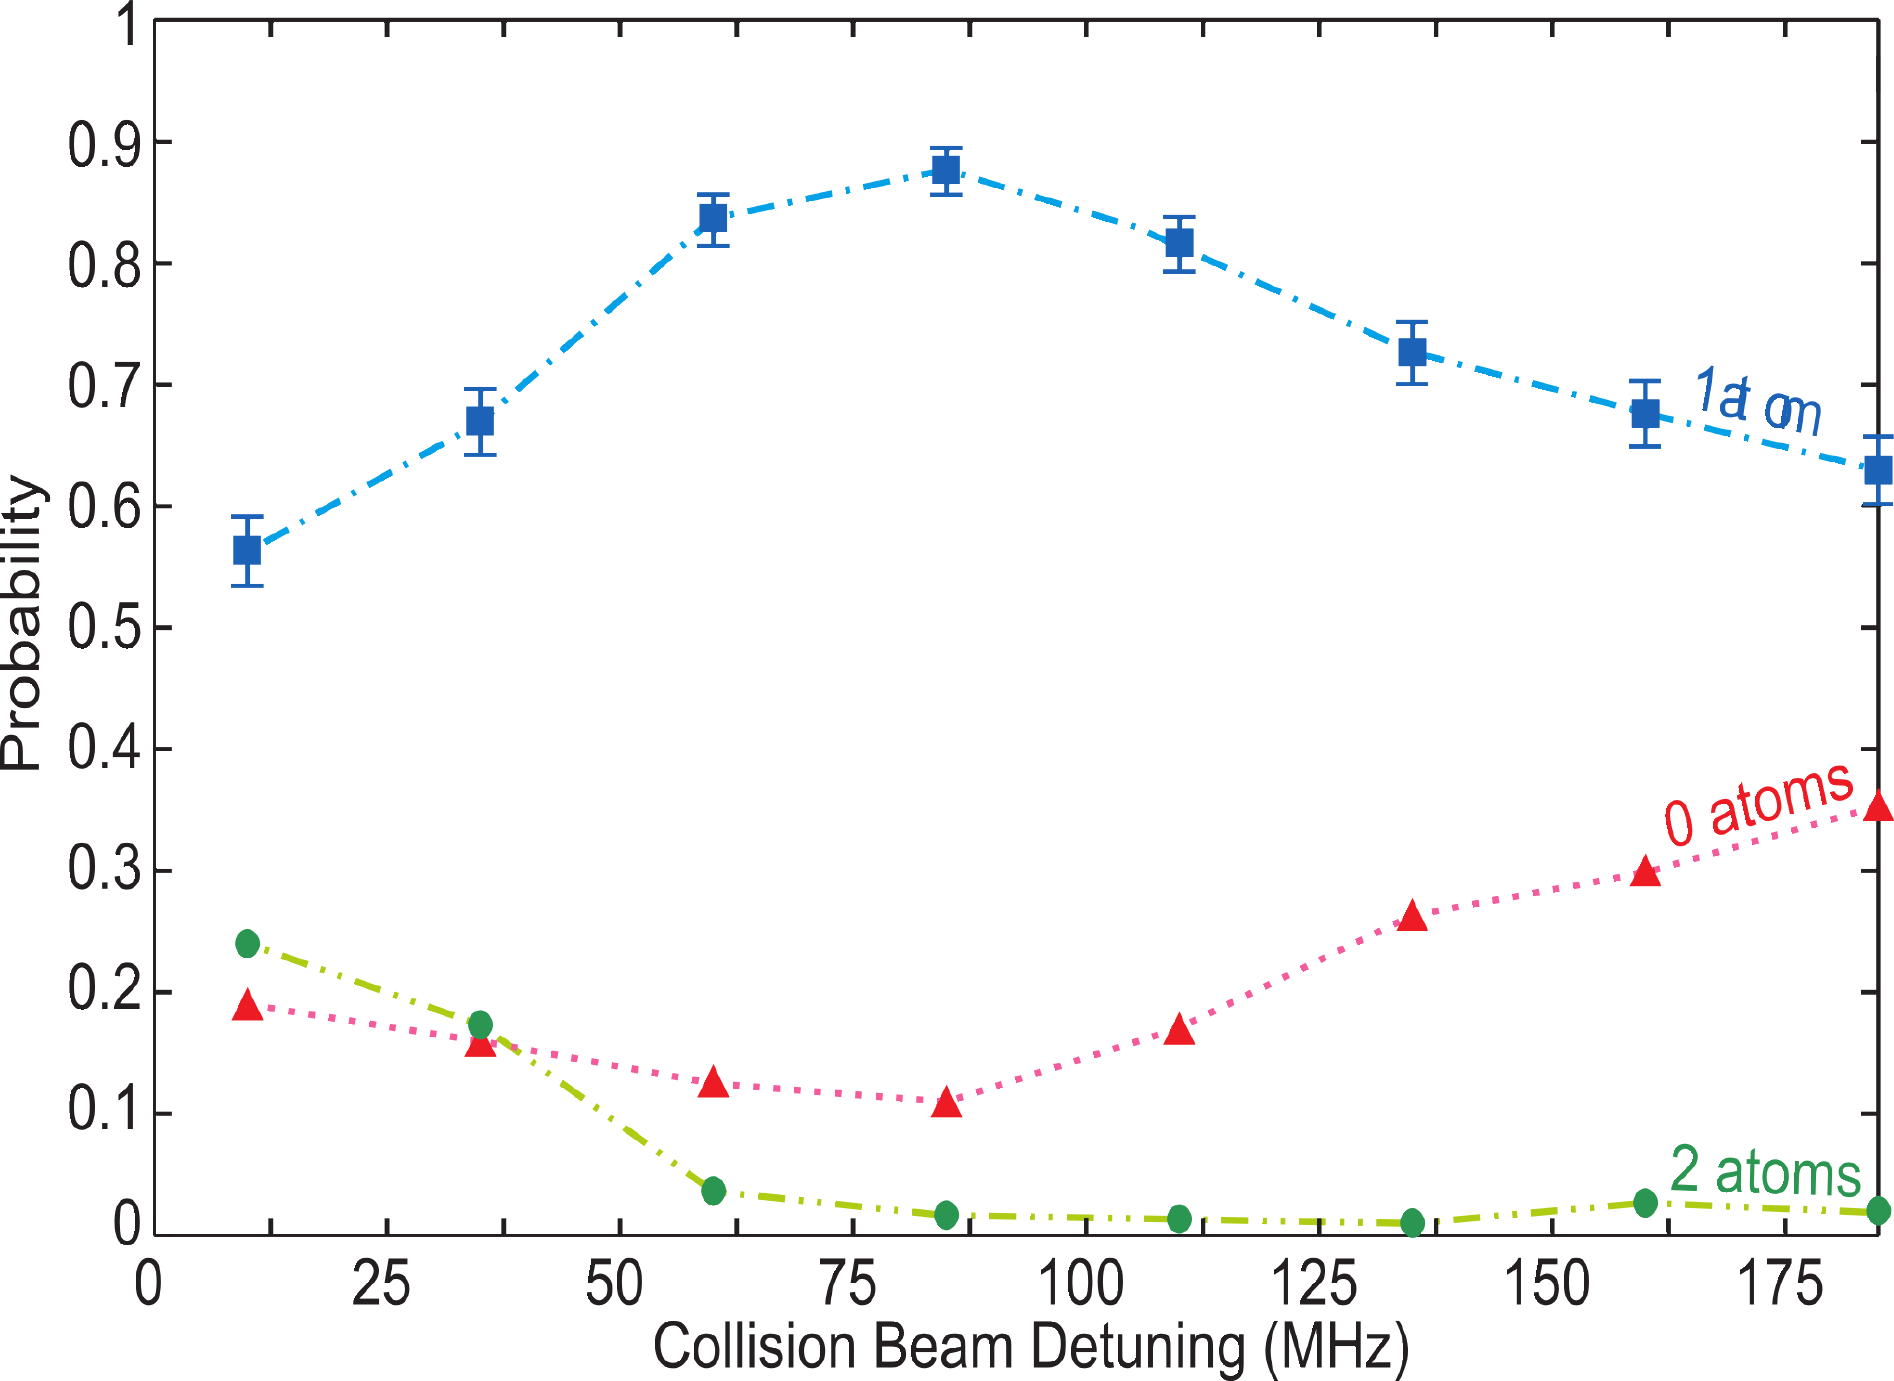
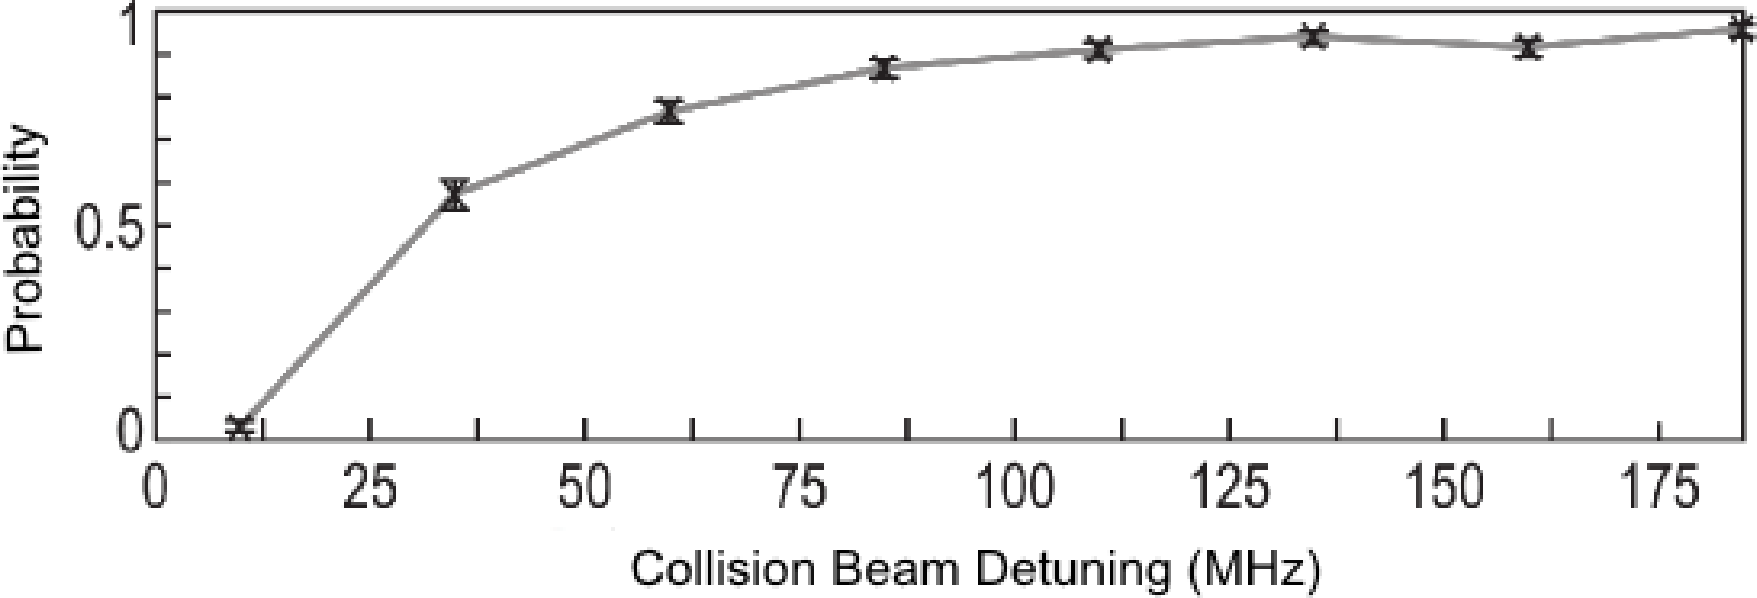
The single atom loading efficiency depends on the energy released due to the light assisted collisions. To study this, we repeated the experiment for different collision beam frequencies in the range 15 MHz< Δc < 185 MHz. In this experiment, we fix the cooling beam power to 0.64 mW and the duration of the collision pulse to 385 ms. The collision beam power has been adjusted at each Δc in order to maximize the probability of loading a single atom in the FORT. In Figure 11, we have plotted the single atom loading efficiency, as well as the probabilities of obtaining zero or two atoms for different values of Δc. We observe that the single atom loading efficiency increases with Δc, until it peaks at Δc = 85 MHz, and drops after that. As stated before, a long single atom lifetime is important in order to avoid losing an atom before its detection. To monitor this lifetime, we prepare a single atom and measure the probability that it remains trapped (survival probability) after being exposed to a fixed LAC pulse duration of 3.5 s. The result is shown in Figure 12. The LAC pulse duration of 3.5 s was chosen to reveal when the single atom lifetime significantly affects the loading of single atoms. In Figure 12, we observe that the single atom survival probability, and, thereby, the single atom lifetime, decreases with Δc. This is due to the stronger radiation pressure exerted on the atoms by the collision beam as it is tuned closer to resonance, causing increased heating on the atoms and leading to a higher equilibrium temperature. An atom that visits the high energy tail of the thermal distribution will escape from the trap after it has been prepared. This explains the reduced single atom loading probability at small Δc observed in Figure 11. The reduction observed at Δc > 85 MHz is due to the higher energy released in each collision event (hΔc), which enhances the chance for both atoms to have enough energy to escape from the trap. To verify this, we measured the two-atom evolution under collision beam parameters identical to those of the Δc = 185 MHz point in Figure 11. We observed that there was a significant increase of 2–0 decay (pair losses) when compared to the results of Figure 7a (in which the parameters corresponded to the Δc = 85 MHz point). Hence, the peak loading efficiency at Δc = 85 MHz occurs as a compromise between the single atom loss at small detunings and pair loss due to increased energy released upon collisions at larger detunings.
5.2. Dependence on Collision Beam Power
To study how the single atom loading efficiency depends on the collision beam power, we first fixed the detuning of the collision beam to Δc = 85 MHz. Next, we varied the collision beam power and measured the single atom loading probability for different durations of the collision pulse. Both the inelastic collision rate and the single atom lifetime change significantly when we change the collision beam power. The collision pulse duration that yields the maximal probability for loading one atom will therefore vary with the collision beam power. For each collision beam power, we varied the pulse duration to optimize the probability for obtaining one atom at the end of the collision pulse. The left axis of Figure 13a shows the probabilities of loading zero, one or two atoms versus the collision beam power for the optimized collision pulse duration. The orange stars and orange right axis of Figure 13a show this optimized duration of the collision pulse at each power. The largest single atom loading probability occurs at a collision beam power of 11 μW with a pulse duration of 385 ms. In Figure 13b, we show the single atom survival probability after a collision pulse of a duration of 3.5 s for each collision beam power (a similar method as in Figure 12). As expected, at high collision powers, the single atom survival probability is reduced, due to the increased heating from radiation pressure.
The high single atom survival probability at a collision beam power of 1 μW (lifetime of 63 s) does not ensure a higher single atom loading probability. This is because the optimized duration of the collision pulse at this power is 2.75 s, which is long enough for the cooling beams to induce light assisted collisions. The cooling beams are about 3 GHz red-detuned from the D2 line for atoms colliding in the F = 2 ground state. The gradient of Ue(Rc) increases with the detuning for intermediate Rc (see Figure 2). A large detuning will therefore lead to the rapid gain of kinetic energy, making it probable that an atom pair after an inelastic collision has enough energy for both atoms to escape from the trap (the 2–0 decay channel dominates). This impedes a high single atom loading efficiency. By measuring the two-atom evolution in the presence of the cooling beams only, we find a pair decay time of 4 s with 2–0 decay dominating. This decay time is comparable to the collision pulse duration at 1 μW of collision beam power. The pair decay induced by the cooling beams thereby explains the decrease of the single atom loading efficiency at the lowest collision beam powers observed in Figure 13.
5.3. Dependence on the Cooling Beam Power
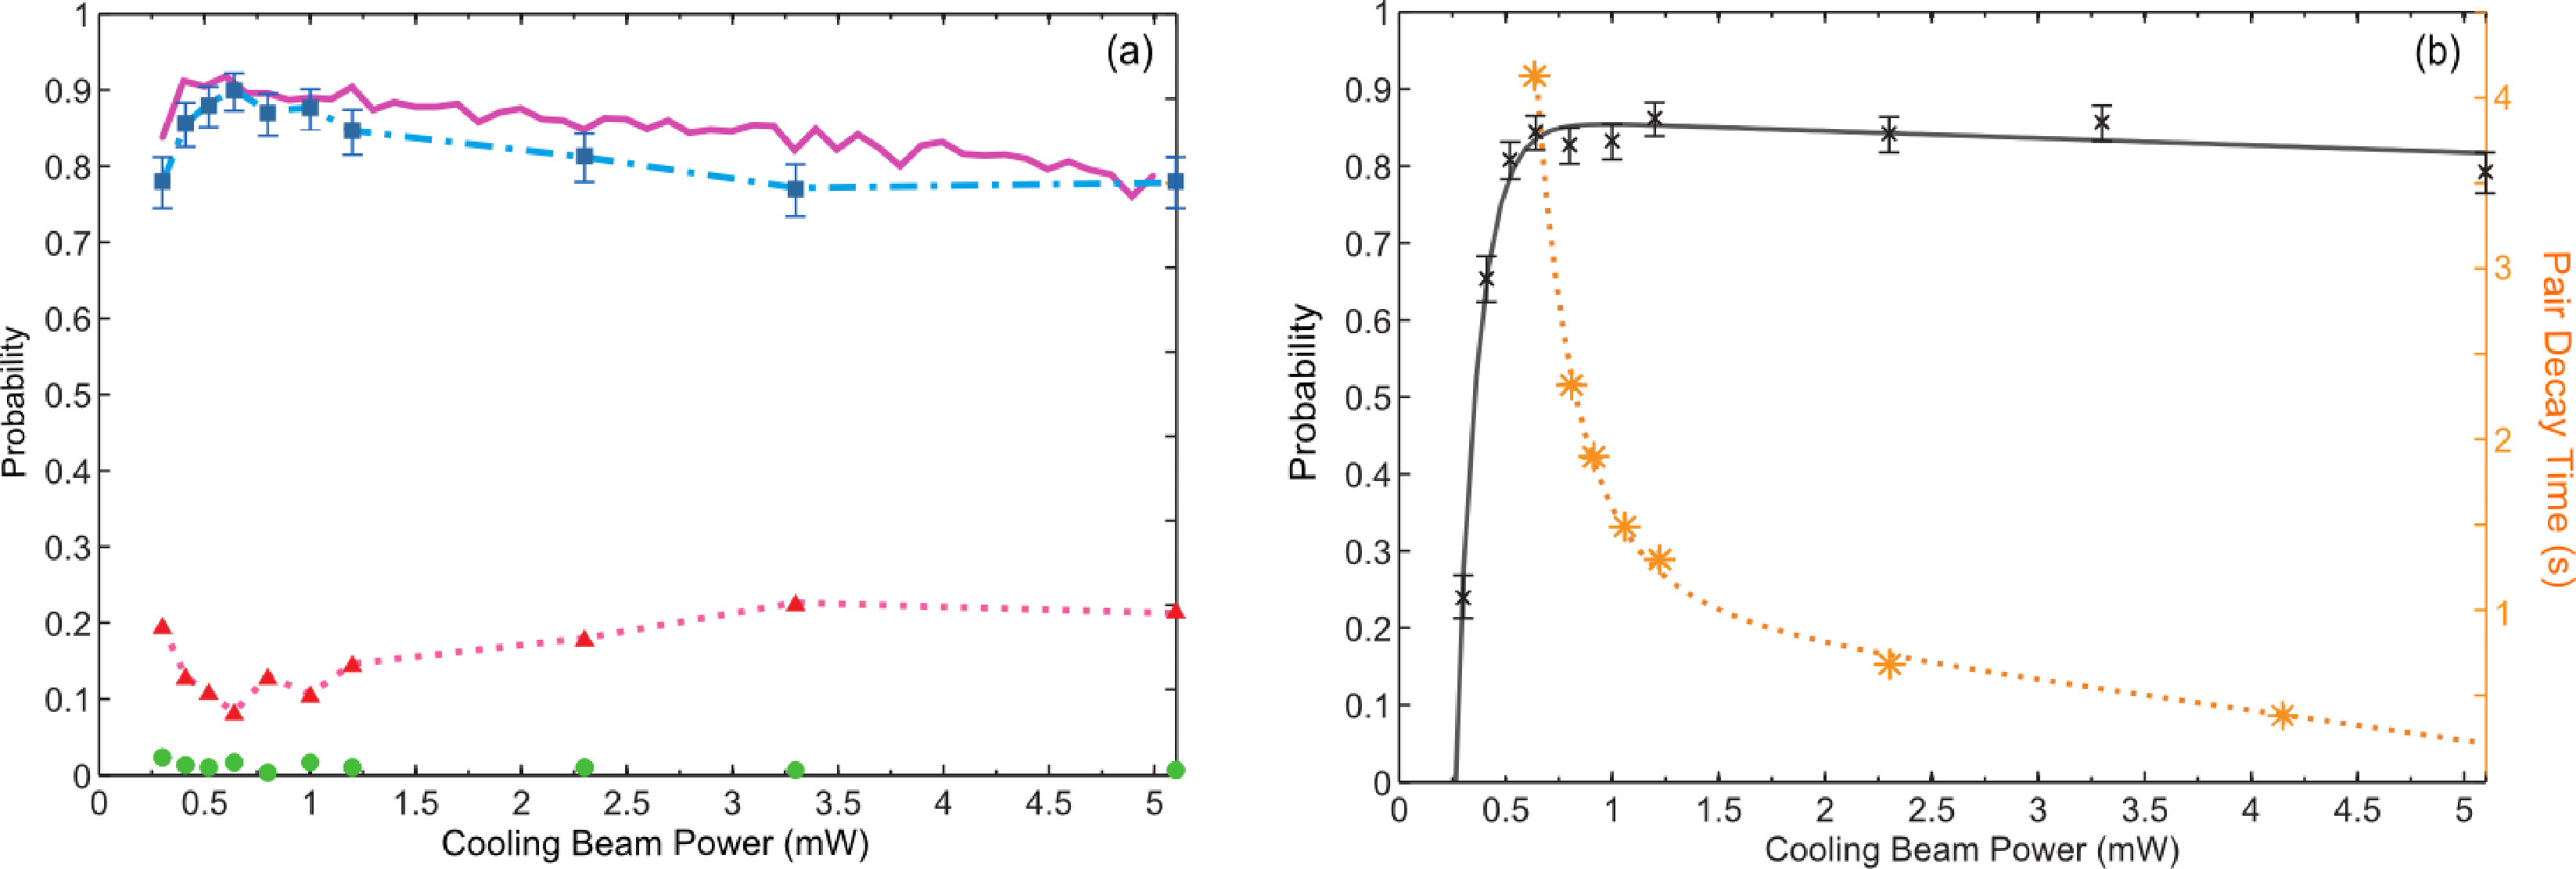
We investigate the effect of the cooling beams power on the single atom loading efficiency. We fix the collision beam power to 11 μW and the pulse duration to 385 ms. Figure 14a shows the probability of loading one atom in the trap as a function of the cooling beams power (per beam). The peak probability is found at 0.64 mW. We monitor the single atom survival probability after a pulse of a duration of 3.5 sat each power and show it on the left axis of Figure 14b. At low powers, the cooling effect provided by the cooling beams is not enough to compensate for the heating generated by the collision beam. This causes low atom survival probability and, thus, reduces the single atom loading efficiency, as a single atom may be prepared, but be lost prior to detection. At high powers, the cooling beams are responsible (by the mechanisms described in Section 5.2) for pair losses that again hinder higher single atom loading efficiency.
To verify the explanation given above, we run a simple simulation of the single atom loading experiment and show the result as the pink thick line alongside the experimental data in Figure 14a. The loading simulation is based on the rates of the different trap loss mechanisms and starts with N = 20 atoms in the trap and evolves with discrete time steps. In each time step, dt, the atom number can remain the same, decrease by one with probability αNdt, due to single-atom loss processes, or it can decrease by one or two atoms, due to collisional loss processes with a probability given by βN (N − 1) dt.To obtain α, we measure the survival probability of a single prepared atom after a 3.5-s exposure to LAC light. The data is shown in Figure 14b alongside a fitted curve from which α is determined, by assuming that the survival probability is e(−α3.5 s). Since a light assisted collision can be induced by the collision beam or the cooling light, both of these contribute to β. The low intensity of the laser beams allows us to assume that β is the sum of the contributions from the cooling light and the collision beam. To find the contribution from the cooling light, we measure pair decay curves, such as those in Figure 7, without a collision beam for different cooling beam powers. The time constant for the pair decay is plotted using the right axis of Figure 14b. Next, we assume that the contribution to the two-body loss rate from the collision beam is independent on the cooling beam power. We determine it from the pair decay time of the results in Figure 7a, by adjusting it for the finite α and the loss induced by the cooling beams. In time steps where a two-body loss event occurs, we need to determine whether one or both atoms are lost. To find the relative probabilities for these outcomes as a function of cooling beam power, we assume that collisions induced by the cooling light always lead to both atoms being lost, while the relative probabilities for an event induced by the collision beam are deduced from Figure 7a. Figure 14a shows that the simulation captures the main experimental features. We hence conclude that an optimal value of the cooling beam power of 0.64 mW occurs as a compromise between the short single atom lifetime (large α) for low cooling beam power and the increasing rate of light assisted collisions induced by the cooling beams at high powers. Recall that the single atom lifetime is dependent on the balance between the cooling provided by the cooling beams and the heating caused by the collision beam.
5.4. Loading Efficiency and Limiting Factors
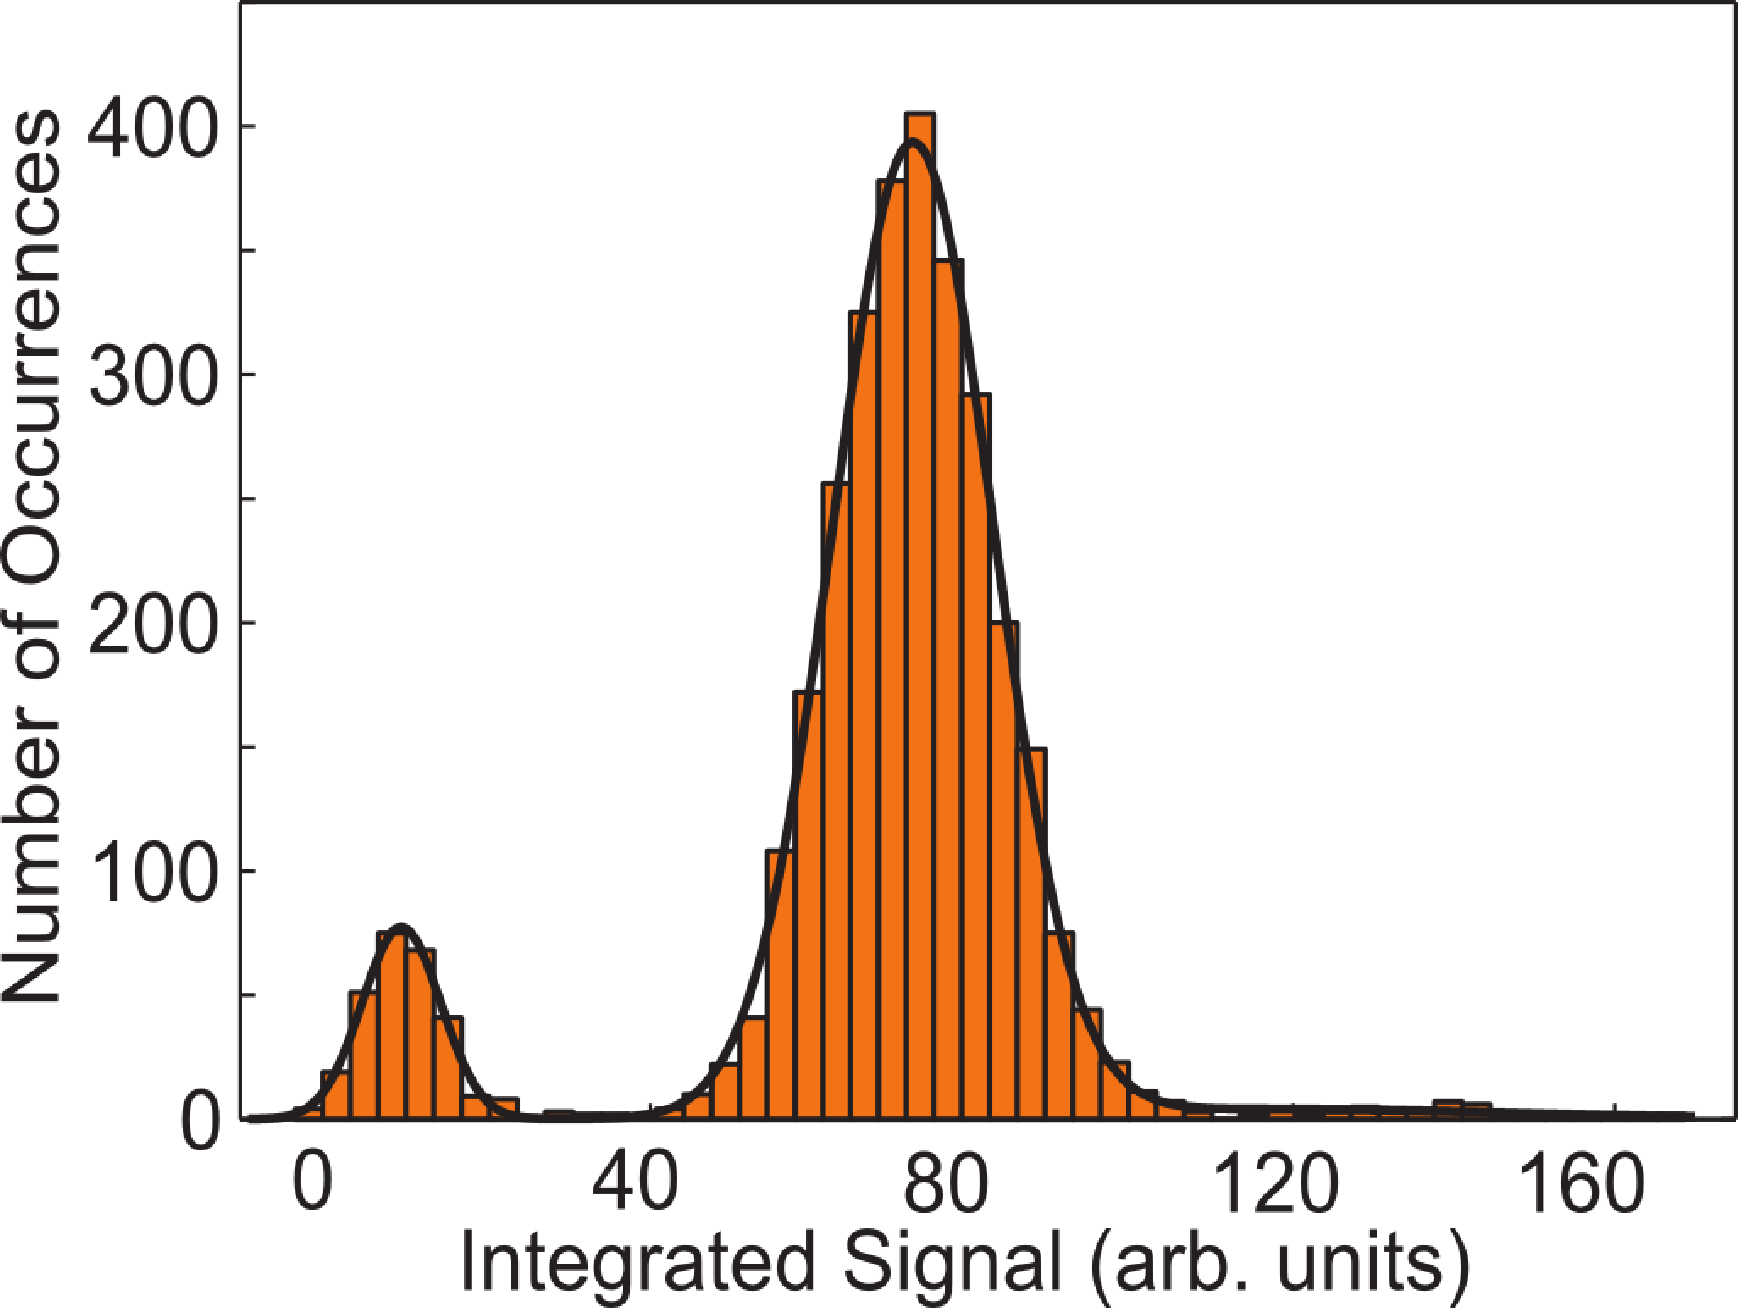
To obtain a precise measurement of the optimized loading probability, we run the single atom loading experiment illustrated in Figure 10 3, 200 times using the LAC light parameters of Figure 7a. Figure 15 is a histogram of the results. The large peak corresponds to a single trapped atom and indicates a loading efficiency of 91% (with error less than 1%) of a single atom in our FORT [65]. The total single atom preparation time is 542 ms, which includes the optimized time of 157 ms to load, on average, 19 atoms into the FORT (50 ms MOT time, 102 ms CMOT time and 5 ms polarization gradient cooling stage; see Section 3.1) and a 385-ms collision pulse duration.
In order to further improve the single atom loading efficiency, it is important to identify the factors limiting it. Nine percent of the unsuccessful realizations can be accounted for in the following way. The measured 99.5% single atom detection efficiency means that in 0.5% of the realizations, there is a single atom loaded, but it goes undetected. One point five percent are attributed to the single atom loss from the imperfect vacuum and finite single atom temperature. We determined this contribution by running the single atom loading simulation described in Section 5.3 using the measured single atom lifetime of 22 s (see Figure 16). The remaining 7% is due to pair losses. Of this, we estimate that 1.7% is due to the inelastic collisions induced by the cooling beams during the collision stage (the estimate is based on the 4-s two-atom decay time caused by the cooling beams only). The pair dynamics simulation in Figure 7a predicts that 3.6% is due to Kp before a collision is sufficiently high, such that both atoms are lost as a result of it. The remaining 1.7% could be due to inelastic collisions that cause atoms to change their hyperfine states, resulting in the release of high enough energy for two colliding atoms to escape from the trap.
6. Potential Applications and Future Directions
A high loading efficiency of a single neutral atom is an important step to realize a scalable quantum information processing device based on single atoms that can be addressed individually [10,56,71,72]. According to the DiVincenzo criteria, the physical realization of quantum information processing requires a string of qubits that are able to interact with each other, but have long relevant coherence times [73,74]. These criteria can be fulfilled by neutral atoms trapped by light [10,70,75], and a working arrangement could be atoms stored in an array of microtraps formed by laser beams [76–78]. For the limitations of classical computing to be surpassed by quantum computing, a minimum of 30 qubits needs to be prepared at once [79]. If one assumes 91% single atom loading efficiency per site, then the probability of successfully occupying all 30 sites with a single atom at the same time is 0.9130 ≈ 6%. Assuming our preparation time of 542 ms, one can expect an instance in which all 30 sites are occupied with a single atom to happen once in every 10 s. Note that the scaling of the probability for successful loading of an array predicts that it will be improved considerably by a small increase in the single atom loading efficiency.
In the future, it would be interesting to investigate the surprisingly high two-body loss rate reported in [64]. In the present experiments, we did not investigate the high two-body loss rate limit, but our different experimental parameters and the ability to do idealized two atom collision experiments may allow us to shed additional light on the issue.
Our system provides us with a platform to initialize the number of atoms from one to 200 in a near-isolated environment. The high atomic densities that we can prepare in our system yield high collision rates with only a few atoms present. This will allow for the study of dissipation processes in a near-isolated few-body system, which may facilitate an increased understanding of the onset of many-body phenomena, such as thermalization. With additional developments that will allow us to prepare few-atom systems in particular quantum states, we can envisage studying their non-equilibrium dynamics and the emergence of thermalization processes as we increase the atom number. Thermalization in a few-atom regime could give us additional insights as to how microscopic theories lead to statistical dynamics. A system with only a few atoms has the advantage that its dynamics can be modeled theoretically and compared to experimental results with minimum approximations.
7. Summary
In summary, we have presented the results of light-assisted collisions of atoms in a high-density FORT. We described both the theoretical and experimental aspects of it. We demonstrated a method to image and measure the number of atoms ranging from zero to 200 inside the FORT by using fluorescence detection. Furthermore, we showed that by doing light-assisted collision experiments with only two atoms in a shielded environment, we can model the detailed dynamics of the process using a semi-classical approach, thereby revealing information that is not accessible in experiments that use large samples. The improved understanding of the dynamics of atom loss from light-assisted collisions allowed us to address the issue of the efficient delivery of a single atom. By optimizing the duration, detuning and power of the light pulses during the loading of a single atom inside the FORT, we achieved a 91% loading efficiency with sub-second loading time. Alongside potential applications on quantum information processing, our system may be a good platform to study various dynamical phenomena at different physical regimes.
Acknowledgments
We gratefully acknowledge Thad G. Walker for discussions on light-assisted collisions and Matt McGovern, Andrew Hilliard and Tzahi Grünzweig for their previous works on this single atom loading experiment. Our work is supported by UORG. P. Sompet acknowledges support from DPSTand ThEP.
Conflicts of Interest
The authors declare no conflict of interest.
References
- Cohen-Tannoudji, C. Manipulating atoms with photons. Phys. Scr 1998, T76, 33. [Google Scholar]
- Phillips, W.D. Laser cooling and trapping of neutral atoms. Rev. Mod. Phys 1998, 70, 721–742. [Google Scholar]
- Wieman, C.E.; Pritchard, D.E.; Wineland, D.J. Atom cooling, trapping, and quantum manipulation. Rev. Mod. Phys 1999, 71, S253–S262. [Google Scholar]
- Ketterle, W. Nobel lecture: When atoms behave as waves: Bose-Einstein condensation and the atom laser. Rev. Mod. Phys 2002, 74, 1131–1151. [Google Scholar]
- Chan, J.; Alegre, T.M.; Safavi-Naeini, A.H.; Hill, J.T.; Krause, A.; Gröblacher, S.; Aspelmeyer, M.; Painter, O. Laser cooling of a nanomechanical oscillator into its quantum ground state. Nature 2011, 478, 89–92. [Google Scholar]
- Lang, K.M.; Madhavan, V.; Hoffman, J.E.; Hudson, E.W.; Eisaki, H.; Uchida, S.; Davis, J.C. Imaging the granular structure of high-Tc superconductivity in underdoped Bi2Sr2CaCu2O8+d. Nature 2002, 415, 412–416. [Google Scholar]
- Lukin, M.D.; Fleischhauer, M.; Cote, R.; Duan, L.M.; Jaksch, D.; Cirac, J.I.; Zoller, P. Dipole blockade and quantum information processing in mesoscopic atomic ensembles. Phys. Rev. Lett 2001, 87, 37901. [Google Scholar]
- Farhi, E.; Goldstone, J.; Gutmann, S.; Lapan, J.; Lundgren, A.; Preda, D. A quantum adiabatic evolution algorithm applied to random instances of an NP-complete problem. Science 2001, 292, 472–475. [Google Scholar]
- Jessen, P.S.; Deutsch, I.H.; Stock, R. Quantum information processing with trapped neutral atoms. Quant. Inf. Process 2004, 3, 91. [Google Scholar]
- Anderlini, M.; Lee, P.J.; Brown, B.L.; Sebby-Strabley, J.; Phillips, W.D.; Porto, J.V. Controlled exchange interaction between pairs of neutral atoms in an optical lattice. Nature 2007, 448, 452–456. [Google Scholar]
- Geller, M.R.; Cleland, A.N. Superconducting qubits coupled to nanoelectromechanical resonators: An architecture for solid-state quantum-information processing. Phys. Rev. A 2005, 71, 032311. [Google Scholar]
- Saffman, M.; Walker, T.G.; Mølmer, K. Quantum information with Rydberg atoms. Rev. Mod. Phys 2010, 82, 2313. [Google Scholar]
- Karski, M.; Förster, L.; Choi, J.; Steffen, A.; Alt, W.; Meschede, D.; Widera, A. Quantum walk in position space with single optically trapped atoms. Science 2009, 325, 174–177. [Google Scholar]
- Urban, E.; Johnson, T.A.; Henage, T.; Isenhower, L.; Yavuz, D.D.; Walker, T.G.; Saffman, M. Observation of Rydberg blockade between two atoms. Nat. Phys 2009, 5, 110–114. [Google Scholar]
- Blinov, B.B.; Moehring, D.L.; Duan, L.M.; Monroe, C. Observation of entanglement between a single trapped atom and a single photon. Nature 2004, 428, 153–157. [Google Scholar]
- Serwane, F.; Zürn, G.; Lompe, T.; Ottenstein, T.B.; Wenz, A.N.; Jochim, S. Deterministic preparation of a tunable few-fermion system. Science 2011, 332, 336–338. [Google Scholar]
- Maioli, P.; Meunier, T.; Gleyzes, S.; Auffeves, A.; Nogues, G.; Brune, M.; Raimond, J.M.; Haroche, S. Nondestructive rydberg atom counting with mesoscopic fields in a cavity. Phys. Rev. Lett 2005, 94, 113601. [Google Scholar]
- Kaufman, A.M.; Lester, B.J.; Regal, C.A. Cooling a single atom in an optical tweezer to its quantum ground state. Phys. Rev. X 2012, 2, 041014. [Google Scholar]
- Monz, T.; Schindler, P.; Barreiro, J.T.; Chwalla, M.; Nigg, D.; Coish, W.A.; Harlander, M.; Hänsel, W.; Hennrich, M.; Blatt, R. 14-qubit entanglement: Creation and coherence. Phys. Rev. Lett 2011, 106, 130506. [Google Scholar]
- Blatt, R.; Wineland, D. Entangled states of trapped atomic ions. Nature 2008, 453, 1008–1015. [Google Scholar]
- Riebe, M.; Häffner, H.; Roos, C.F.; Hänsel, W.; Benhelm, J.; Lancaster, G.P.T.; Körber, T.W.; Becher, C.; Schmidt-Kaler, F.; James, D.F.V.; et al. Deterministic quantum teleportation with atoms. Nature 2004, 429, 734–737. [Google Scholar]
- Polkovnikov, A.; Sengupta, K.; Silva, A.; Vengalattore, M. Colloquium: Nonequilibrium dynamics of closed interacting quantum systems. Rev. Mod. Phys 2011, 83, S863–S883. [Google Scholar]
- Lamacraft, A.; Moore, J. Potential insights into nonequilibrium behavior from atomic physics. Ultracold Boson. Fermionic Gases 2012, 5, 177. [Google Scholar]
- Berges, J.; Borsanyi, S.; Wetterich, C. Prethemalization. Phys. Rev. Lett 2004, 93, 142002. [Google Scholar]
- Rigol, M.; Dunjko, V.; Olshanii, M. Thermalization and its mechanism for generic isolated quantum systems. Nature 2008, 452, 854–858. [Google Scholar]
- Ponomarev, A.V.; Denisov, S.; Hänggi, P. Thermal equilibration between two quantum systems. Phys. Rev. Lett 2011, 106, 010405. [Google Scholar]
- Altland, A.; Haake, F. Quantum chaos and effective thermalization. Phys. Rev. Lett 2012, 108, 073601. [Google Scholar]
- Kinoshita, T.; Wenger, T.; Weiss, D.S. A quantum Newton’s cradle. Nature 2006, 440, 900–903. [Google Scholar]
- Gring, M.; Kuhnert, M.; Langen, T.; Kitagawa, T.; Rauer, B.; Schreitl, M.; Mazets, I.; Adu Smith, D.; Demler, E.; Schmiedmayer, J. Relaxation and prethermalization in an isolated quantum system. Science 2012, 337, 1318–1322. [Google Scholar]
- Strohmaier, N.; Greif, D.; Jördens, R.; Tarruell, L.; Moritz, H.; Esslinger, T.; Sensarma, R.; Pekker, D.; Altman, E.; Demler, E. Observation of elastic doublon decay in the Fermi-Hubbard model. Phys. Rev. Lett 2010, 8, 080401. [Google Scholar]
- Deutsch, J.M. Quantum statistical mechanics in a closed system. Phys. Rev. A 1991, 43, 2046. [Google Scholar]
- Flambaum, V.V.; Izrailev, F.M. Distribution of occupation numbers in finite Fermi systems and role of interaction in chaos and thermalization. Phys. Rev. E 1997, 55, R13–R16. [Google Scholar]
- Zurek, W.H. Decoherence, einselection, and the quantum origins of the classical. Rev. Mod. Phys 2003, 75, 715–775. [Google Scholar]
- Hari Dass, N.D.; Kalyana Rama, S.; Sathiapalan, B. On the emergence of the microcanonical description from a pure state. Int. J. Mod. Phys. A 2003, 18, 2947–2993. [Google Scholar]
- Reimann, P. Foundation of statistical mechanics under experimentally realistic conditions. Phys. Rev. Lett 2008, 101, 190403. [Google Scholar]
- Deutsch, J.M.; Li, H.; Sharma, A. The microscopic origin of thermodynamic entropy in isolated systems. Phys. Rev. E 2013, 87, 042135. [Google Scholar]
- Blatt, R.; Zoller, P. Quantum jumps in atomic systems. Eur. J. Phys 1988, 9, 250–256. [Google Scholar]
- Basche, Th.; Kummer, S.; Bräuchle, C. Direct spectroscopic observation of quantum jumps of a single molecule. Nature 1995, 373, 132–134. [Google Scholar]
- Zhuang, X.; Bartley, L.E.; Babcock, H.P.; Russell, R.; Ha, T.; Herschlag, D.; Chu, S. A single-molecule study of RNA catalysis and folding. Science 2000, 288, 2048–2051. [Google Scholar]
- Bakr, W.S.; Peng, A.; Tai, M.E.; Ma, R.; Simon, J.; Gillen, J.I.; Fölling, S.; Pollet, L.; Greiner, M. Probing the superfluid-to-mott insulator transition at the single-atom level. Science 2010, 329, 547–550. [Google Scholar]
- Ritort, F. Nonequilibrium fluctuations in small systems: From physics to biology. Adv. Chem. Phys 2008, 137, 31. [Google Scholar]
- Yukalov, V.I. Equilibration and thermalization in finite quantum systems. Laser Phys. Lett 2011, 8, 485. [Google Scholar]
- Isenhower, L.; Urban, E.; Zhang, X.L.; Gill, A.T.; Henage, T.; Johnson, T.A.; Walker, T.G.; Saffman, M. Demonstration of a neutral atom controlled-NOT quantum gate. Phys. Rev. Lett 2010, 104, 010503. [Google Scholar]
- Hijlkema, M.; Weber, B.; Specht, H.P.; Webster, S.C.; Kuhn, A.; Rempe, G. A single-photon server with just one atom. Nat. Phys 2007, 3, 253–255. [Google Scholar]
- Schrader, D.; Dotsenko, I.; Khudaverdyan, M.; Miroshnychenko, Y.; Rauschenbeutel, A.; Meschede, D. Neutral atom quantum register. Phys. Rev. Lett 2004, 93, 150501. [Google Scholar]
- Gallagher, A.; Pritchard, D.E. Exoergic collisions of cold Na*-Na. Phys. Rev. Lett 1989, 63, 957–960. [Google Scholar]
- Wiener, J. General introduction. In Cold and Ultracold Collisions in Quantum Microscopic and Mesoscopic Systems; Cambridge University Press: Cambridge, UK, 2003; p. 3. [Google Scholar]
- Julienne, P.S.; Vigue, J. Cold collisions of ground-and excited-state alkali-metal atoms. Phys. Rev. A 1991, 44, 4464. [Google Scholar]
- Fontana, P.R. Theory of long-range interatomic forces. I. dispersion energies between unexcited atoms. Phys. Rev 1961, 123, 1865. [Google Scholar]
- Bussery, B.; Aubert-Frecon, M. Multipolar long-range electrostatic, dispersion, and induction energy terms for the interactions between two identical alkali atoms Li, Na, K, Rb, and Cs in various electronic states. J. Chem. Phys 1985, 82, 3224. [Google Scholar]
- Wiener, J. Optical Shielding and Suppression. In Cold and Ultracold Collisions in Quantum Microscopic and Mesoscopic Systems; Cambridge University Press: Cambridge, UK, 2003; p. 138. [Google Scholar]
- Grünzweig, T.; Hilliard, A.; McGovern, M.; Andersen, M.F. Near-deterministic preparation of a single atom in an optical microtrap. Nat. Phys 2010, 6, 951–954. [Google Scholar]
- Walker, T.; Sesko, D.; Wieman, C. Collective behavior of optically trapped neutral atoms. Phys. Rev. Lett 1990, 64, 408–411. [Google Scholar]
- Schlosser, N.; Reymond, G.; Grangier, P. Collisional blockade in microscopic optical dipole traps. Phys. Rev. Lett 2002, 89, 023005. [Google Scholar]
- Grimm, R.; Weidemüller, M. Optical dipole traps for neutral atoms. Adv. Atom. Mol. Opt. Phys 2000, 42, 95–170. [Google Scholar]
- Schlosser, N.; Reymond, G.; Protsenko, I.; Grangier, P. Sub-poissonian loading of single atoms in a microscopic dipole trap. Nature 2001, 411, 1024. [Google Scholar]
- Sherson, J.F.; Weitenberg, C.; Endres, M.; Cheneau, M.; Bloch, I.; Kuhr, S. Single-atom-resolved fluorescence imaging of an atomic Mott insulator. Nature 2010, 467, 68–72. [Google Scholar]
- Dalibard, J.; Cohen-Tannoudji, C. Laser cooling below the Doppler limit by polarization gradients: simple theoretical models. J. Opt. Soc. Am. B 1989, 6, 2023–2045. [Google Scholar]
- McGovern, M.; Hilliard, A.; Grünzweig, T.; Andersen, M.F. Counting atoms in a deep optical microtrap. Opt. Lett 2011, 36, 1041–1043. [Google Scholar]
- Ratschbacher, L.; Zipkes, C.; Sias, C.; Köhl, M. Controlling chemical reactions of a single particle. Nat. Phys 649.
- Staanum, P.F.; Højbjerre, K.; Wester, R.; Drewsen, M. Probing isotope effects in chemical reactions using single ions. Phys. Rev. Lett 2008, 100, 243003. [Google Scholar]
- Ueberholz, B.; Kuhr, S.; Frese, D.; Meschede, D.; Gomer, V. Counting cold collisions. J. Phys. B Atom Mol. Opt. Phys 2000, 33, L135. [Google Scholar]
- Willems, P.A.; Boyd, R.A.; Bliss, J.L.; Libbrecht, K.G. Stability of magneto-optical traps with large field gradients: Limits on the tight confinement of single atoms. Phys. Rev. Lett 1997, 78, 1660–1663. [Google Scholar]
- Fuhrmanek, A.; Bourgain, R.; Sortais, Y.R.P.; Browaeys, A. Light-assisted collisions between a few cold atoms in a microscopic dipole trap. Phys. Rev. A 2012, 85, 062708. [Google Scholar]
- Carpentier, A.V.; Fung, Y.H.; Sompet, P.; Hilliard, A.J.; Walker, T.G.; Andersen, M.F. Preparation of single atom in an optical microtrap. Laser Phys. Let 2013, 10, 125501. [Google Scholar]
- Lett, P.D.; Watts, R.N.; Westbrook, C.I.; Phillips, W.D.; Gould, P.L.; Metcalf, H.J. Observation of atoms laser cooled below the Doppler limit. Phys. Rev. Lett 1988, 61, 169–172. [Google Scholar]
- Metcalf, H.J.; van der Straten, P. Optical Molasses. In Laser Cooling and Trapping; Springer Verlag: Berlin, Germany, 1999; pp. 88–97. [Google Scholar]
- Förster, L.; Alt, W.; Dotsenko, I.; Khudaverdyan, M.; Meschede, D.; Miroshnychenko, Y.; Reick, S.; Rauschenbeutel, A. Number-triggered loading and collisional redistribution of neutral atoms in a standing wave dipole trap. New J. Phys 2006, 8, 259. [Google Scholar]
- DePue, M.T.; McCormick, C.; Winoto, S.L.; Oliver, S.; Weiss, D.S. Unity occupation of sites in a 3D optical lattice. Phys. Rev. Lett 1999, 82, 2262–2265. [Google Scholar]
- Nelson, K.D.; Li, X.; Weiss, D.S. Imaging single atoms in a three-dimensional array. Nat. Phys 2007, 3, 556–560. [Google Scholar]
- Itah, A.; Veksler, H.; Lahav, O.; Blumkin, A.; Moreno, C.; Gordon, C.; Steinhauer, J. Direct observation of a sub-poissonian number distribution of atoms in an optical lattice. Phys. Rev. Lett 2010, 104, 113001. [Google Scholar]
- Greiner, M.; Mandel, O.; Esslinger, T.; Hänsch, T.W.; Bloch, I. Quantum phase transition from a superfluid to a Mott insulator in a gas of ultracold atoms. Nature 2002, 415, 39. [Google Scholar]
- Bennett, C.H. Quantum information and computation. Phys. Today 1995, 48, 24–30. [Google Scholar]
- Divincenzo, D.P. The physical implementation of quantum computation. Fortschr. Phys 2000, 48, 771–783. [Google Scholar]
- Beterov, I.I.; Tretyakov, D.B.; Entin, V.M.; Yakshina, E.A.; Ryabtsev, I.I.; Chapovsky, P.L.; Yudin, V.I.; Goncharov, A.N.; Taychenachev, A.V.; Prants, S.V. Quantum informatics with single atoms. Russ. Microelectron 2011, 309, 237–244. [Google Scholar]
- Monroe, C. Quantum information processing with atoms and photons. Nature 2002, 416, 238–246. [Google Scholar]
- Brennen, G.K.; Caves, C.M.; Jessen, P.S.; Deutsch, I.H. Quantum logic gates in optical lattices. Phys. Rev. Lett 1999, 82, 1060–1063. [Google Scholar]
- Zhang, C.; Rolston, S.L.; Sarma, S.D. Manipulation of single neutral atoms in optical lattices. Phys. Rev. A 2006, 74, 042316. [Google Scholar]
- Aspuru-Guzik, A.; Dutoi, A.D.; Love, P.J.; Head-Gordon, M. Simulated quantum computation of molecular energies. Science 2005, 309, 1704–1707. [Google Scholar]


© 2014 by the authors; licensee MDPI, Basel, Switzerland This article is an open access article distributed under the terms and conditions of the Creative Commons Attribution license (http://creativecommons.org/licenses/by/3.0/).
Share and Cite
Fung, Y.H.; Carpentier, A.V.; Sompet, P.; Andersen, M. Two-Atom Collisions and the Loading of Atoms in Microtraps. Entropy 2014, 16, 582-606. https://doi.org/10.3390/e16010582
Fung YH, Carpentier AV, Sompet P, Andersen M. Two-Atom Collisions and the Loading of Atoms in Microtraps. Entropy. 2014; 16(1):582-606. https://doi.org/10.3390/e16010582
Chicago/Turabian StyleFung, Yin H., Alicia V. Carpentier, Pimonpan Sompet, and Mikkel Andersen. 2014. "Two-Atom Collisions and the Loading of Atoms in Microtraps" Entropy 16, no. 1: 582-606. https://doi.org/10.3390/e16010582