1. Introduction
Compressing data, of necessity, involves understanding the way information is structured and, if possible, the mechanism by which the information was generated or is destined to be used. Thus, in order to compress speech it helps to know that the speech production process can be modeled by an autoregressive moving average filter excited by a signal with a periodic and a noise-like component. In order to compress images it helps to know that the sensing apparatus cannot discriminate high spatial frequencies. Where it is not possible to explicitly model the information source or sink, the best compression algorithms attempt to extract the way information is organized in the data in an adaptive fashion—in a sense learning the structure which allows for compression. The conceptual tools developed in the field of source coding that have guided the development of data compression algorithms are thus useful instruments for the analysis of how information is organized in general, and in biological systems in particular.
Life is strongly associated with organization and structure [
1]. Living organisms can be viewed as agents communicating with their environment and storing information necessary for adaptation to the environment. This information storage, both in content and form, is shaped by the process of evolution and transmitted from one generation to the next via the DNA molecule. The complexity of life means that the amount of information contained in the DNA molecule for even simple unicellular organisms is very large and requires efficient storage. Efficient storage would dictate the removal of all redundancy from the data being stored. However, the complexity of life also means that the information transmission has to be accurate as errors would have a disastrous effect on the survival of the organism. This would argue against a decrease in redundancy to allow for some level of robustness in the preservation of information. Another twist, not encountered by most other sources of information, is that the organization of the information in the DNA molecule affects the level of production of the protein molecules that are the machinery of the cell, and can often affect the order in which they are produced. To accommodate all these requirements (and more) the level of organization of information in biological molecules has to be highly complex.
In this work we look at how the tools and theoretical constructs, which have been so useful in the development of data compression algorithms, can be used to understand biologically important molecules which can be represented as sequences, such as DNA, RNA, and proteins. We briefly review compression algorithms developed for compressing biological sequences, however, our main focus is on how conceptual tools in the data compression repertoire have been used in the field of bioinformatics. In the process we hope to convey to the reader the idea that bioinformatics is not simply one more area of application for concepts from data compression—though it is a fertile area for application of these concepts. Rather, it is an area in which the concepts used for the development of data compression have a natural home. If we think of DNA as the original quine and evolution as a process of programming where the fitness functions are specified by natural selection, bioinformatics becomes unlike most biomedical applications where the biomedical data is mined for information. The biological sequences themselves become the messages and information theory and the data compression concepts become natural concepts for understanding the structures in these messages.
There has been a recent publication by Giancarlo
et al. [
2] which also examines much of the literature reviewed here. However, the two papers take somewhat different approaches to the literature. Giancarlo
et al. [
2] examine the various problems of bioinformatics and describe compression tools that have been used to address these problems. In this work we examine the different concepts in compression and look at how these concepts can be used to understand and resolve issues in computational biology and bioinformatics. The two papers are complementary views of the same problem. Giancarlo
et al. [
2] would be most beneficial to individuals aware of the problems in bioinformatics and interested in compression tools that can be used to address these problems. The current paper would be most useful to researchers in the compression community who are interested in seeing how concepts familiar to them have been used to study the burgeoning field of bioinformatics.
Given that the audience for this paper may not be very familiar with some of the biological concepts we begin with a very brief review of relevant information. We will then look at how the concepts of Shannon Entropy, average mutual information, Kolmogorov complexity and grammar-based modeling have been used in bioinformatics. There is an excellent review of compression algorithms for biological sequences in [
2]. Therefore, we provide only a brief survey of compression algorithms for biological sequences and focus more on their use as a measure of distance between biological sequences. We conclude with a section on grammar based techniques and their application in bioinformatics.
2. A bit of Biology
The major focus of bioinformatics is on three kinds of molecules, DNA, RNA, and proteins, all of which can be represented as sequences. The DNA molecule is made up of a concatenation of four different kinds of nucleotides. A nucleotide consists of a five-carbon sugar called deoxyribose in which the carbons are numbered from 1’ to 5’. Attached to the 1’ carbon is one of four different nucleobases, Thymine, Adenine, Cytosine, and Guanine. The various nucleotides are identical except for the nucleobases attached to the 1’ carbon. The nucleobases are themselves made up of carbon rings in which the carbon atoms are numbered as 1, 2, etc. (which is why the numbering of the carbons in the deoxyribose uses primes). In each nucleotide there is a hydroxyl group connected to the 3’ carbon of the deoxyribose sugar and a triphosphate group connected to the 5’ carbon. The DNA grows via phosphate linkage between the 3’ carbon of one nucleotide and the 5’ carbon of another. A growing chain is always constructed by the enzymes in the organism in the 3’ direction thus giving a directionality to each strand of the DNA molecule. The DNA molecule can be represented as a sequence by representing each nucleotide by the first letter of the corresponding nucleobase (T, A, C, and G) and writing the representation from the 5’ to the 3’ direction. DNA is a double stranded molecule with neighboring strands connected through hydrogen bonding between the nucleobases. This hydrogen bonding is quite specific with Thymine on one strand pairing with Adenine on the other strand and Guanine on one strand pairing with Cytosine on the other. Thus, the DNA molecule is redundant; each strand contains all the information necessary to construct the other strand. This double stranded nature of the DNA molecule makes it more robust to errors than the single stranded RNA molecule and provides a mechanism for accurate reproduction of the information.
The regions of the DNA molecule that act as blueprints for proteins are called genes. An entire gene is transcribed by the RNA polymerase enzyme into an RNA molecule. The ribose sugar in the RNA molecule differs from the deoxyribose sugar in the DNA molecule in that a hydroxyl (OH) group connected to the 2’ carbon in ribose is replaced by a Hydrogen in deoxyribose. Furthermore, the nucleobases that are part of the ribose nucleotides that make up the RNA molecule are Uracil (U), Adenine (A), Cytosine (C), and Guanine (G), with Uracil replacing Thymine. The transcription from DNA to RNA is through base-pairing—every C is transcribed as a G, a G is transcribed as a C, a T is transcribed as an A and an A is transcribed as a U. The RNA molecule created through the action of RNA polymerase is processed and portions excised resulting in a messenger RNA (mRNA). This messenger RNA is translated through the action of cellular machinery called ribosomes into proteins. The translation is from the sequence of ribose-nucleotides to amino acids. Each group of three ribose nucleotides is translated into one of twenty different amino acids through the use of intermediary RNA molecules called transfer RNA or tRNA. The translation code is a fixed length redundant code with multiple triplets being translated to the same amino acid. Three of the triplets, UAG, UAA, and UGA translate to stop codons which indicate the stop of translation (UGA has recently also been shown to code for the amino acid Selenocysteine). Translation begins with a start codon which is generally AUG, though in some cases, especially in bacteria, it can also be GUG or UUG.
Each gene can be transcribed multiple times and the transcript can be translated multiple times before it is subjected to degradation. The level of transcription and translation is controlled through a complex set of regulation mechanisms which involve, among other things, the binding of regulatory proteins to sites on the DNA close to the gene. The sites where these regulatory factors bind are called regulatory sites.
3. Entropy and Biology
Given that DNA is a means of transmitting information between generations it was natural that the concepts of entropy and information be applied to understanding DNA. One of the first contributions to the use of the concept of information in bioinformatics was the work of Lila Gatlin [
3,
4,
5,
6] in the 1960’s. Gatlin proposed a definition for the information content of DNA which was essentially a measure of the divergence of the DNA sequence from an
iid sequence. Given an alphabet of size
N, where
N is four for DNA sequences and 20 for amino acid sequences, Gatlin defined two quantities
and
which measured divergence from the equiprobable state and divergence from independence, respectively,
where
is the first order entropy of the sequence and
is the conditional entropy where
X and
Y are neighboring elements in the sequence. The information content of a DNA sequence is then defined as the sum of these two measures of divergence which can be shown to be the difference between the maximal entropy
and the conditional entropy
. Gatlin connects this definition of information to redundancy by noting that defining redundancy as [
7]
results in
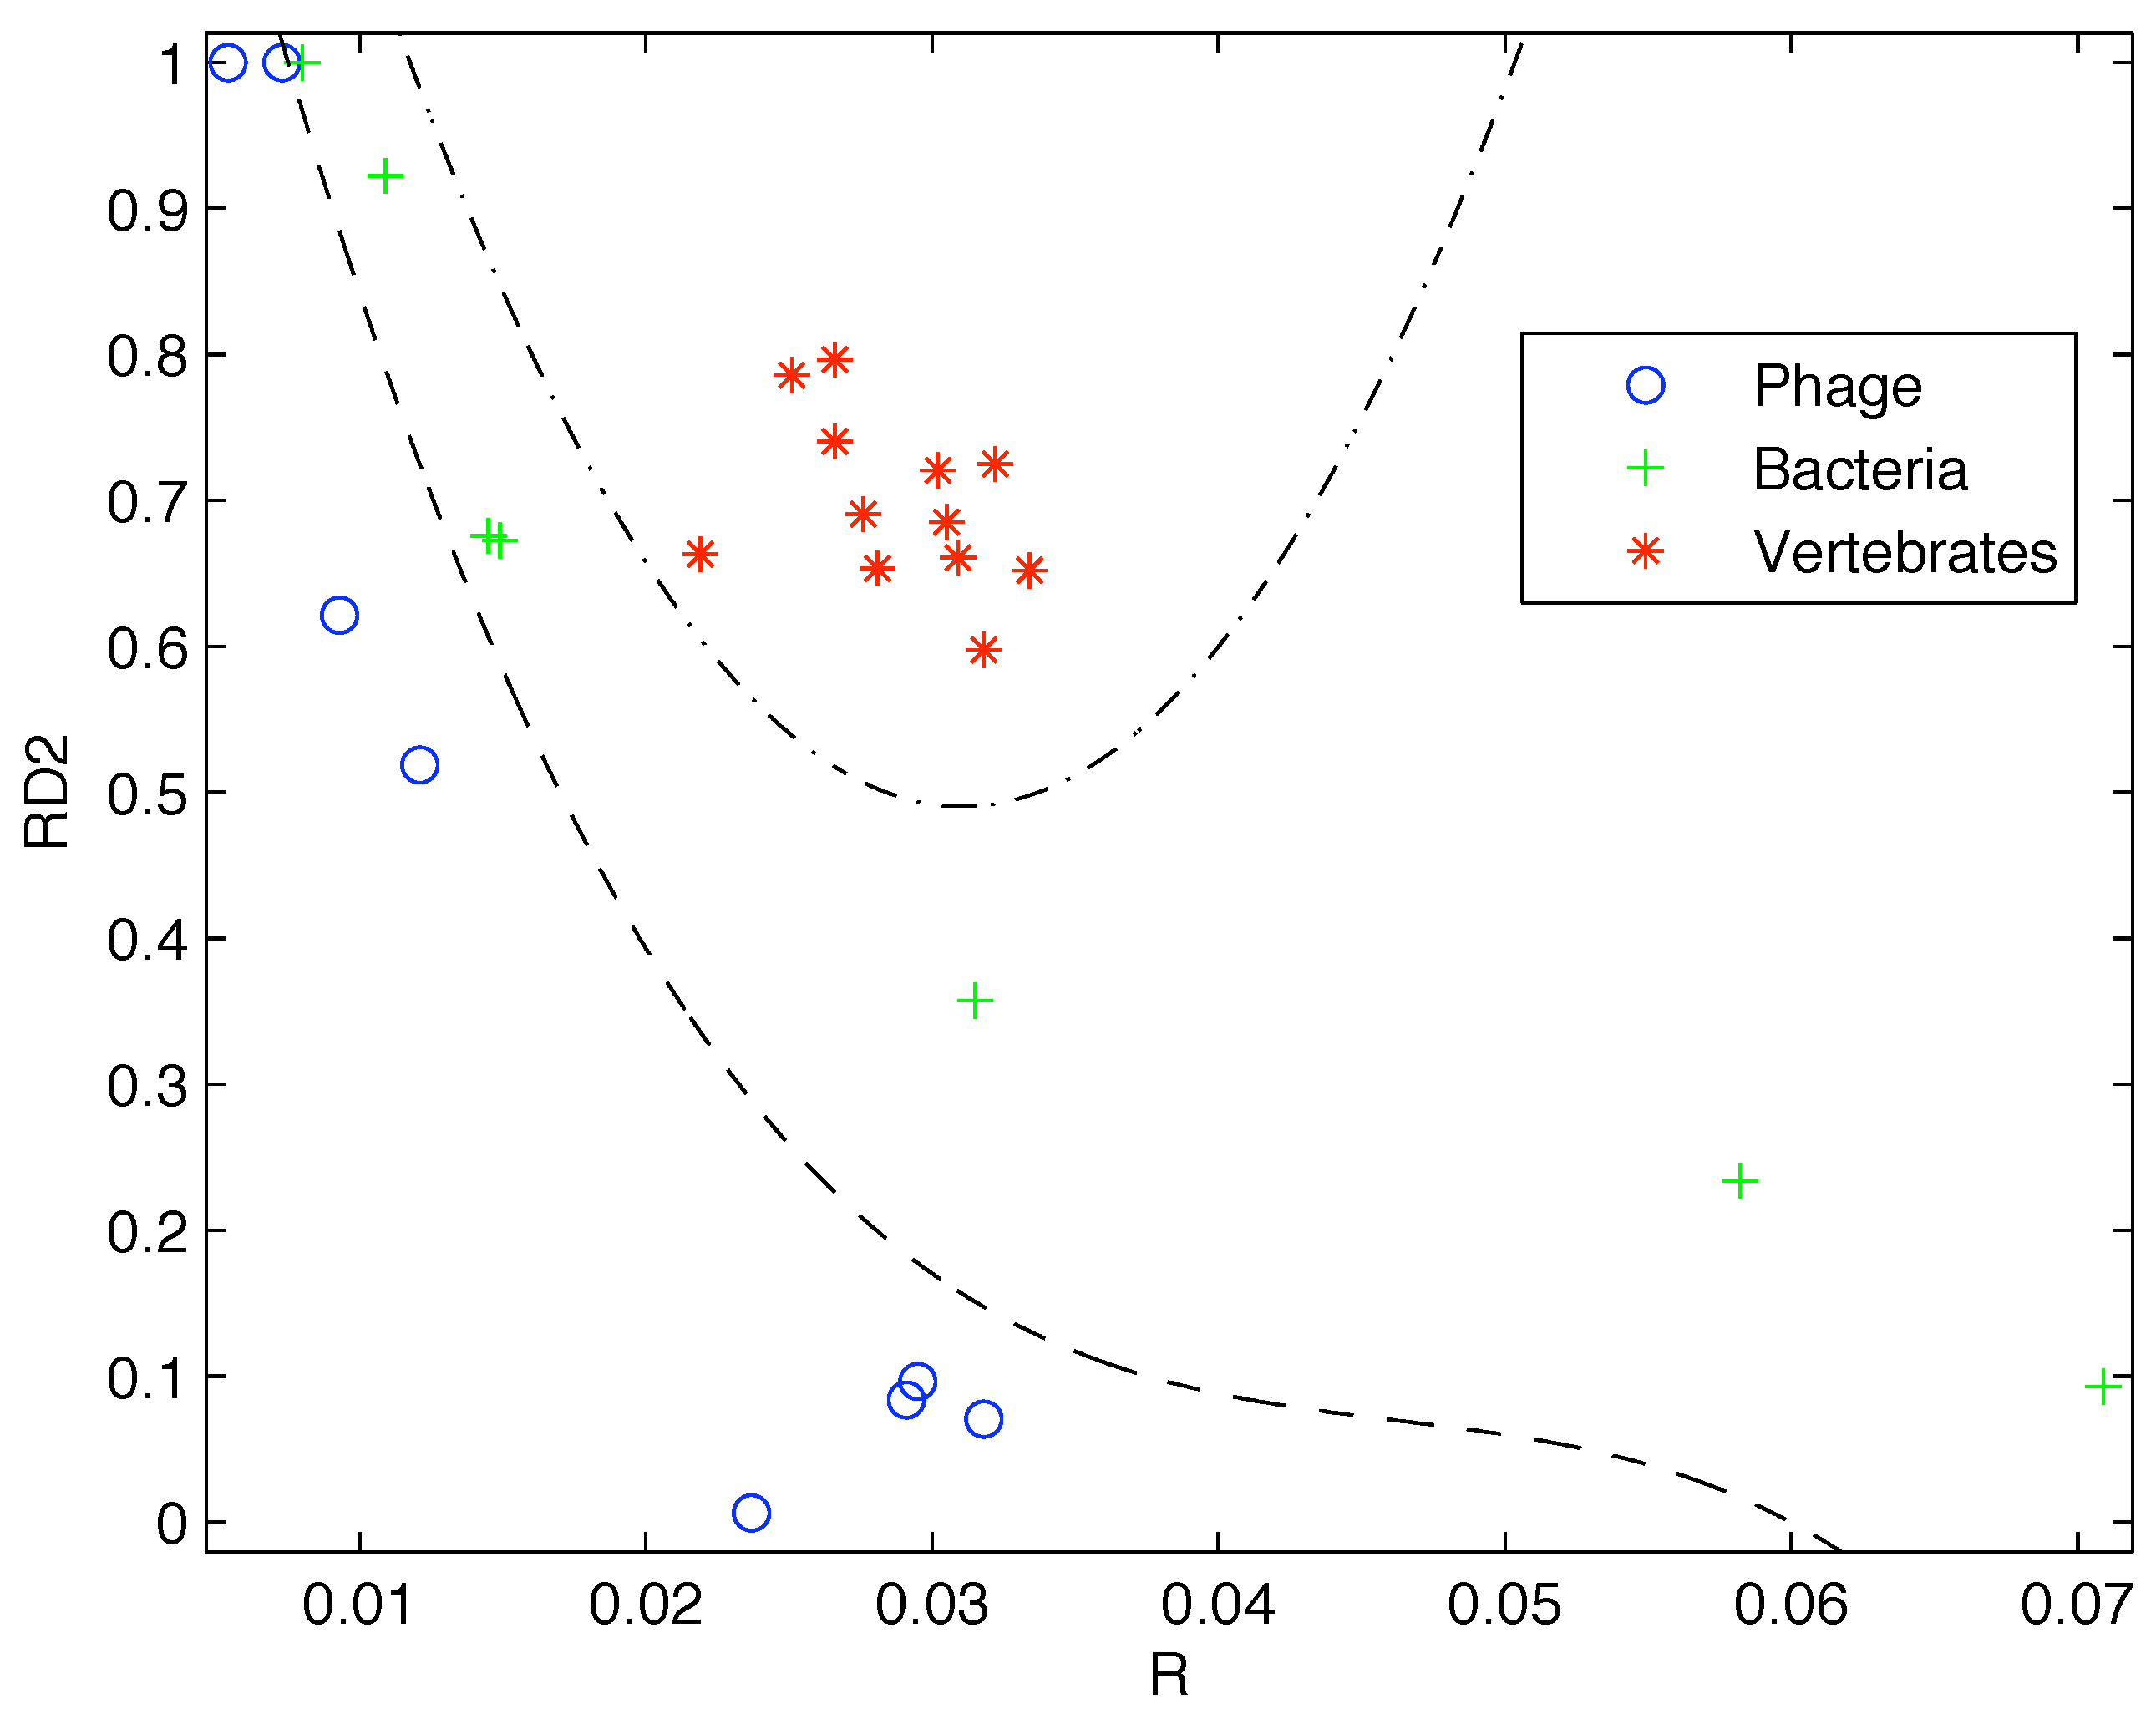
Based on the limited data available at that time, Gatlin showed empirically that DNA from vertebrates, bacteria, and phage (viruses that prey on bacteria) can be distinguished by looking at their information content and that there is increasing redundancy in the DNA of organisms as we move from lower complexity organisms like bacteria to higher complexity organisms such as vertebrates. Plotting the data available to her as shown in
Figure 1 it is easy to see why she would come to that conclusion.
Figure 1.
Plot of the redundancy rate versus using the genes available at the time shows a clear segregation of Phage, Bacteria, and Vertebrate sequences.
Figure 1.
Plot of the redundancy rate versus using the genes available at the time shows a clear segregation of Phage, Bacteria, and Vertebrate sequences.
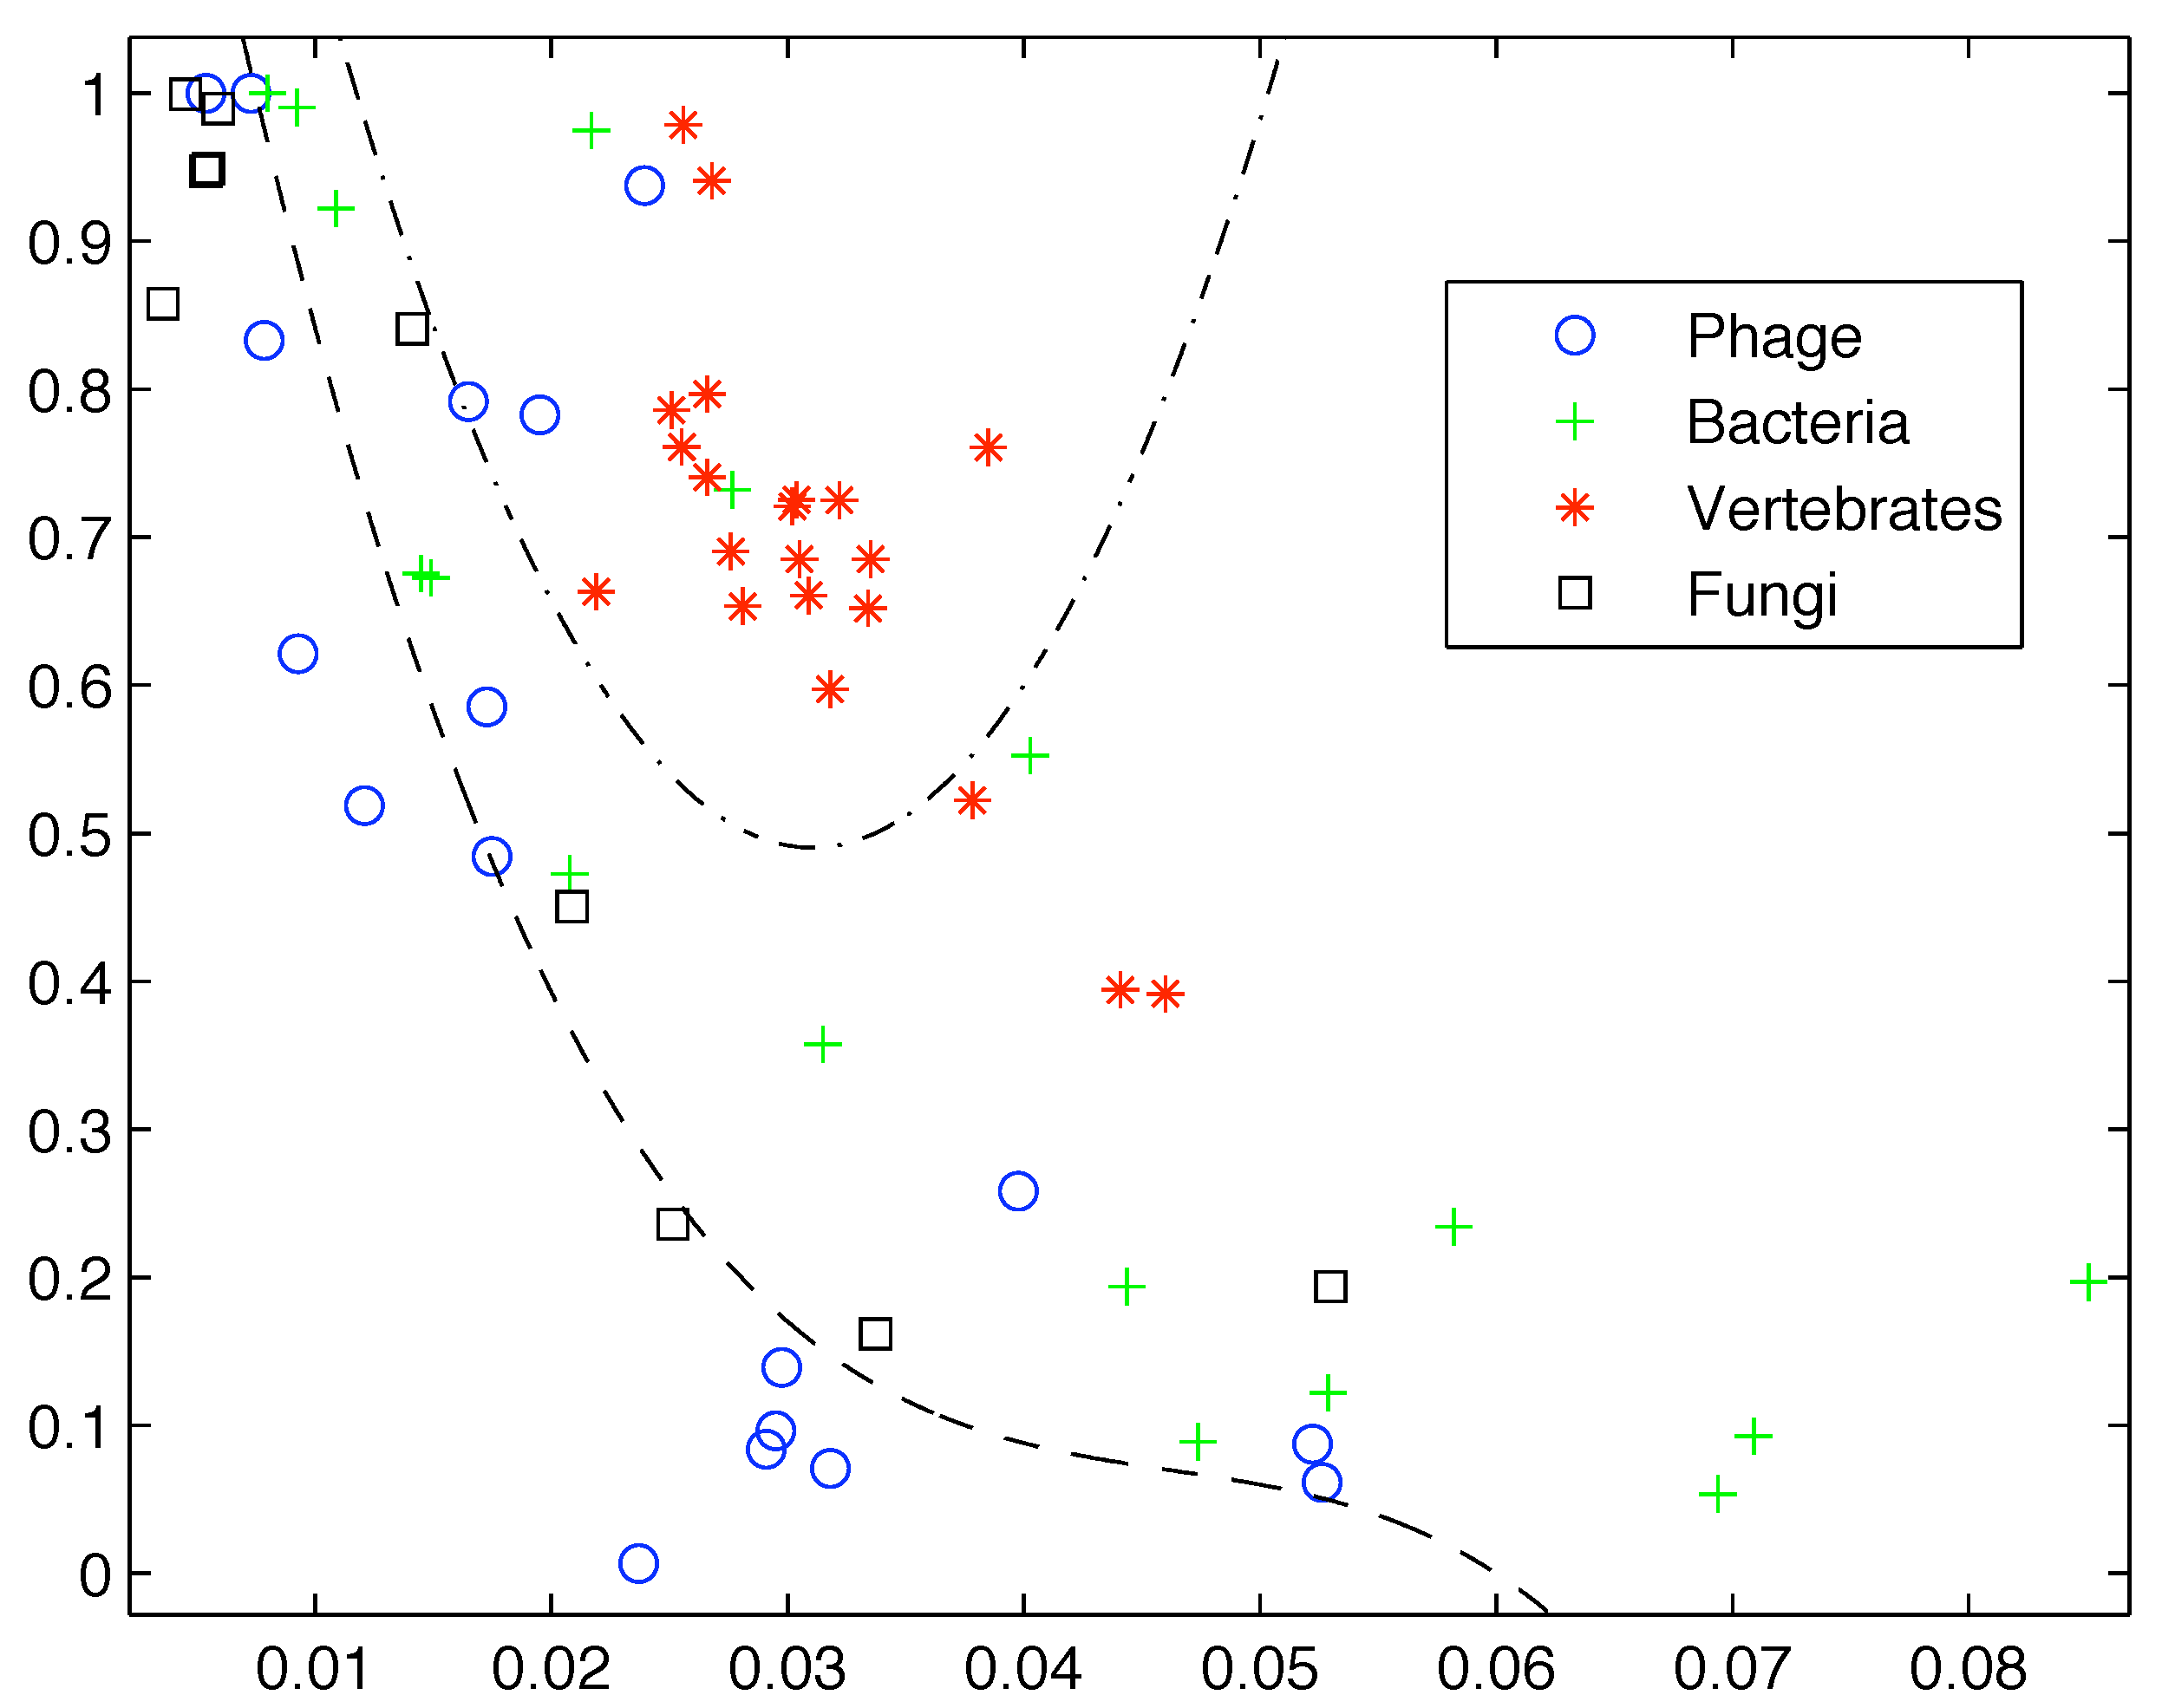
However, if we add more sequences from these groups the clear segregation breaks down as shown in
Figure 2. Clearly first order entropy is not sufficient to capture the complexity of DNA and provide a differentiation between simpler and more highly complex life forms.
While Gatlin’s work seems to have had more impact in the philosophical realm [
8] the work of Stormo and colleagues [
9] and Schneider and colleagues [
10,
11,
12] has had more direct impact on the practice of bioinformatics. Gatlin assumed that the DNA sequence was a realization of an ergodic process and estimated probabilities along a sequence. Schneider
et al. [
10] align multiple DNA sequences and treat them as realizations of a random process. They then compute the information content per base (or residue for amino acid sequences). The definition of information content by Schneider and Stephens [
11] is only slightly different from that of Gatlin’s
parameter. Schneider and Stephens define the information at a location
l by:
where
is the estimate of the first order entropy given by
is a correction term employed to account for the small number of sequences used to estimate the entropy, and
is the frequency of occurrence of base (or residue)
x at location
l. Based on this value Schneider and Stephens create a
logo for the sequences. At each position the elements of the aligned sequences that appear at that location are represented by a letter the height of which is proportional to its frequency of occurrence at that location multiplied by the information at that location
. The various letters are stacked with the order of the stacking dictated by the frequency of occurrence. The total height of the stack at each position
l is given by
.
Figure 2.
Inclusion of additional sequences breaks down the segregation observed by Gatlin.
Figure 2.
Inclusion of additional sequences breaks down the segregation observed by Gatlin.
The
logo as created by Schneider and Stephens is widely used in various bioinformatic applications [
13,
14,
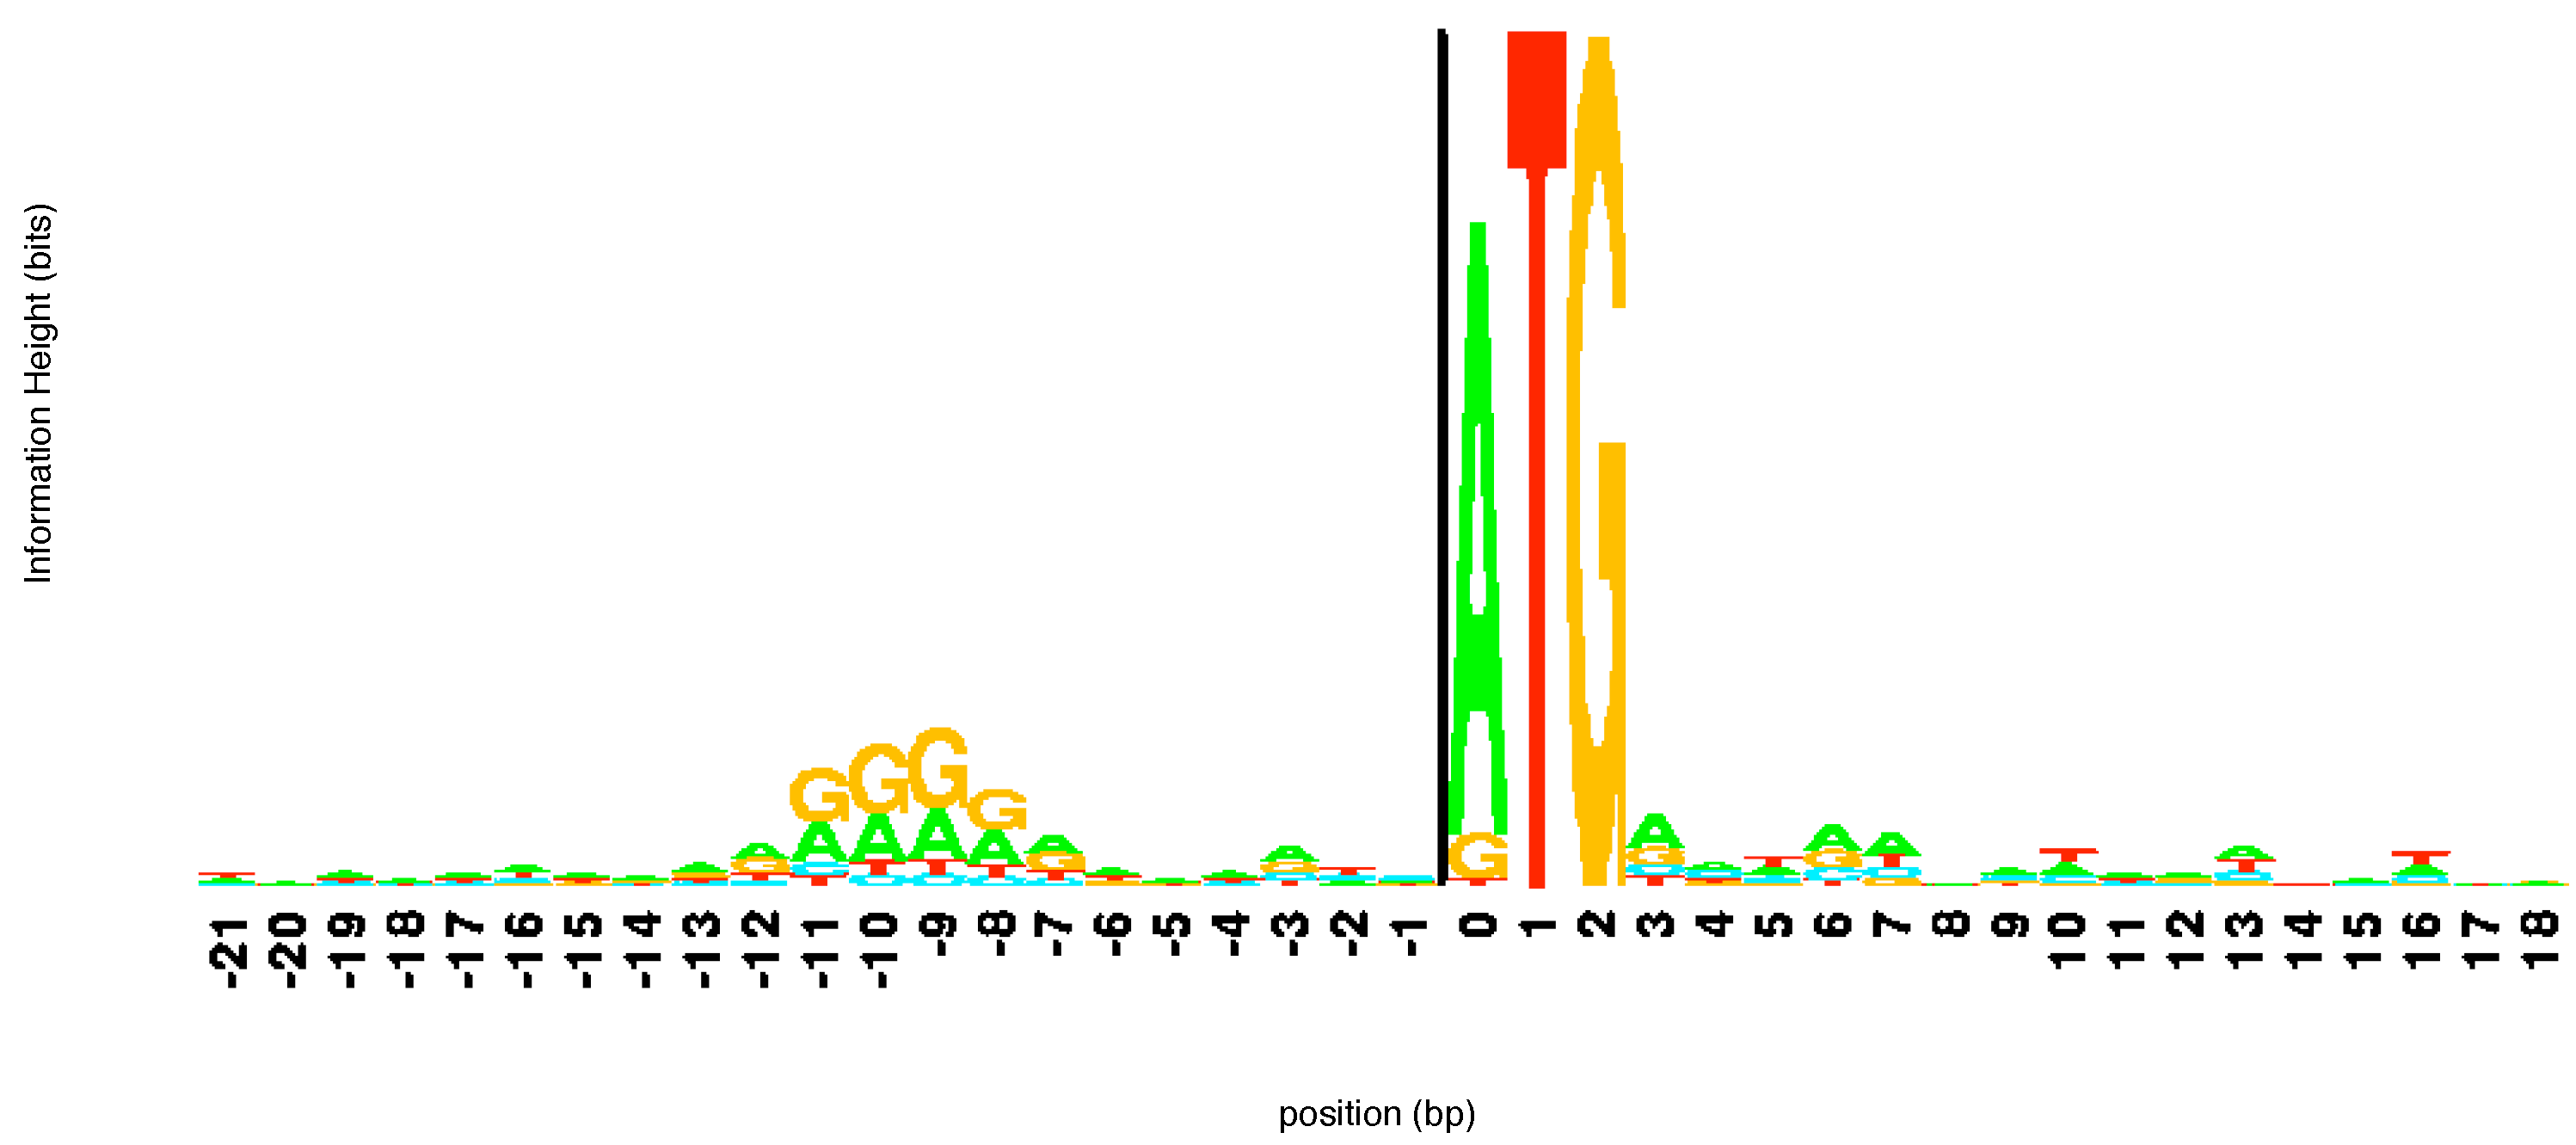
15] as they provide information useful to biologists. A tall stack of letters at a particular location implies that the corresponding site is important for some reason. Typically, the location is a binding site for proteins involved in the regulation of expression of genes. These sites are thus connection points of gene regulation networks. The height of individual letters in the stack shows the frequency of occurrence of the letter and so can inform a biologist of the level of mutation at this particular site of the DNA molecule. An example of a
logo created by aligning a number of different sequences from
E. coli at the beginning of a gene is shown in
Figure 3. The sequence ATG pops out immediately in the
logo alerting the user to its importance. Notice that while T and G are present in all sequences, in some of the sequences aligned here the first element of the start codon is a G or, more rarely, T rather than an A. Looking upstream (left) from the start codon we can see another region of consensus. This corresponds to the regulatory site known as the -10 promoter region. This region helps direct the RNA polymerase enzyme which makes RNA copies of the gene.
Schneider and colleagues in other work have used logos for studying DNA protein interaction [
16], to investigate variants [
17] and look for novel genes [
18]. The utility of the entropy concept in such a wide range of application suggests that perhaps these concepts are natural to biological sequences and a more wide-ranging and deeper analysis would be a fruitful endeavor.
Figure 3.
The
logo of a number of sequences at the beginning of a gene. The start codon ATG is immediately apparent. The
logo was constructed using the software at
http://weblogo.threeplusone.com/.
Figure 3.
The
logo of a number of sequences at the beginning of a gene. The start codon ATG is immediately apparent. The
logo was constructed using the software at
http://weblogo.threeplusone.com/.
4. Application of Average Mutual Information
What entropy is to lossless compression, the rate distortion function is to lossy compression. Both provide a bound on the efficacy of compression. The rate distortion function depends on two things, the distortion measure and average mutual information between the source coder input and the source coder output. The average mutual information between random variables
X and
Y is given by
It is a measure of the information contained in the random variable
X about the random variable
Y and vice versa, and is a powerful tool for exploring the relationship between random processes. In some ways it can be thought of as a measure of correlation. This ability of the average mutual information to expose relatedness has been used in a number of ways in bioinformatics.
When dealing with viruses we often end up with populations that differ in small ways from one another. We can treat each individual clone from the population as the realization of a random process. If we do so we can treat each position in an aligned collection of these clones as a random variable. The average mutual information can then be used to identify bases in DNA sequences, or residues in amino acid sequences that in some way depend upon each other. This dependence can help us understand something about the two and three dimensional structure of the virus, or protein. Korber
et al. [
19] in a groundbreaking study identified correlated mutations in the envelope protein of the HIV-1 virus. The envelope protein of a virus is the face the virus presents to the host and the target for which the host fashions its assault. By mutating the envelope protein the virus tries to keep the host’s defense off-balance. This effect is clearly seen in
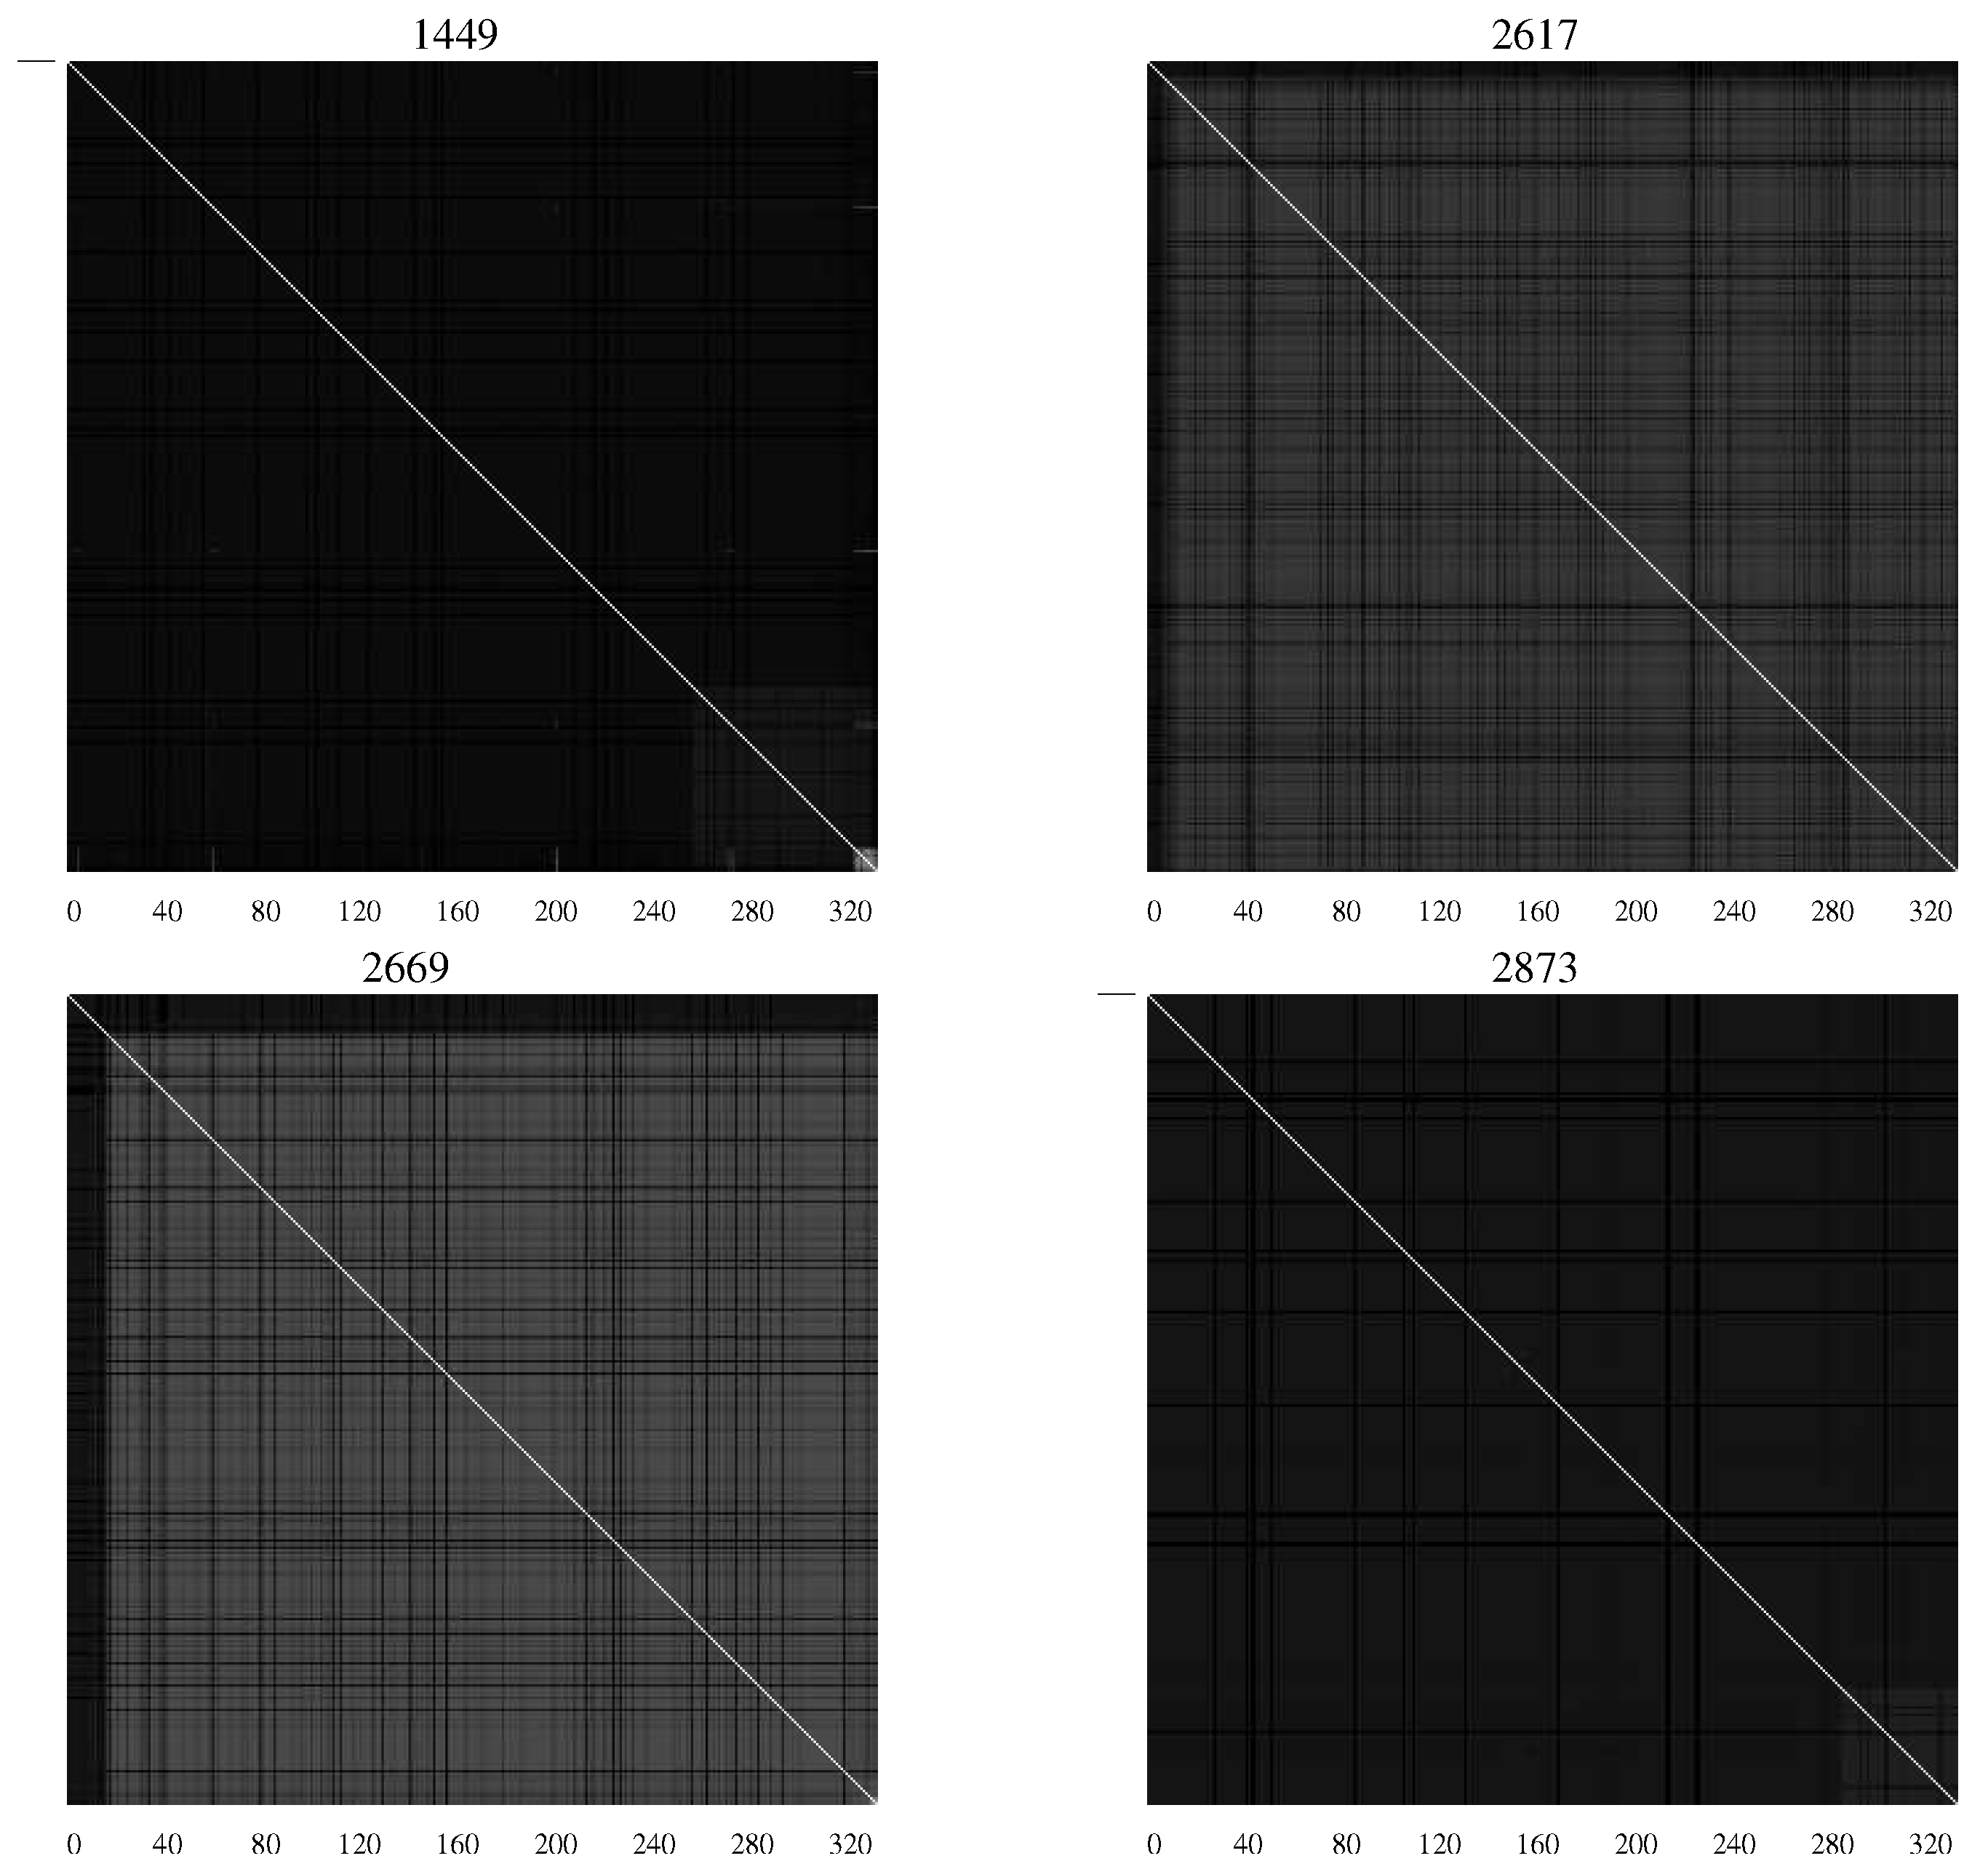
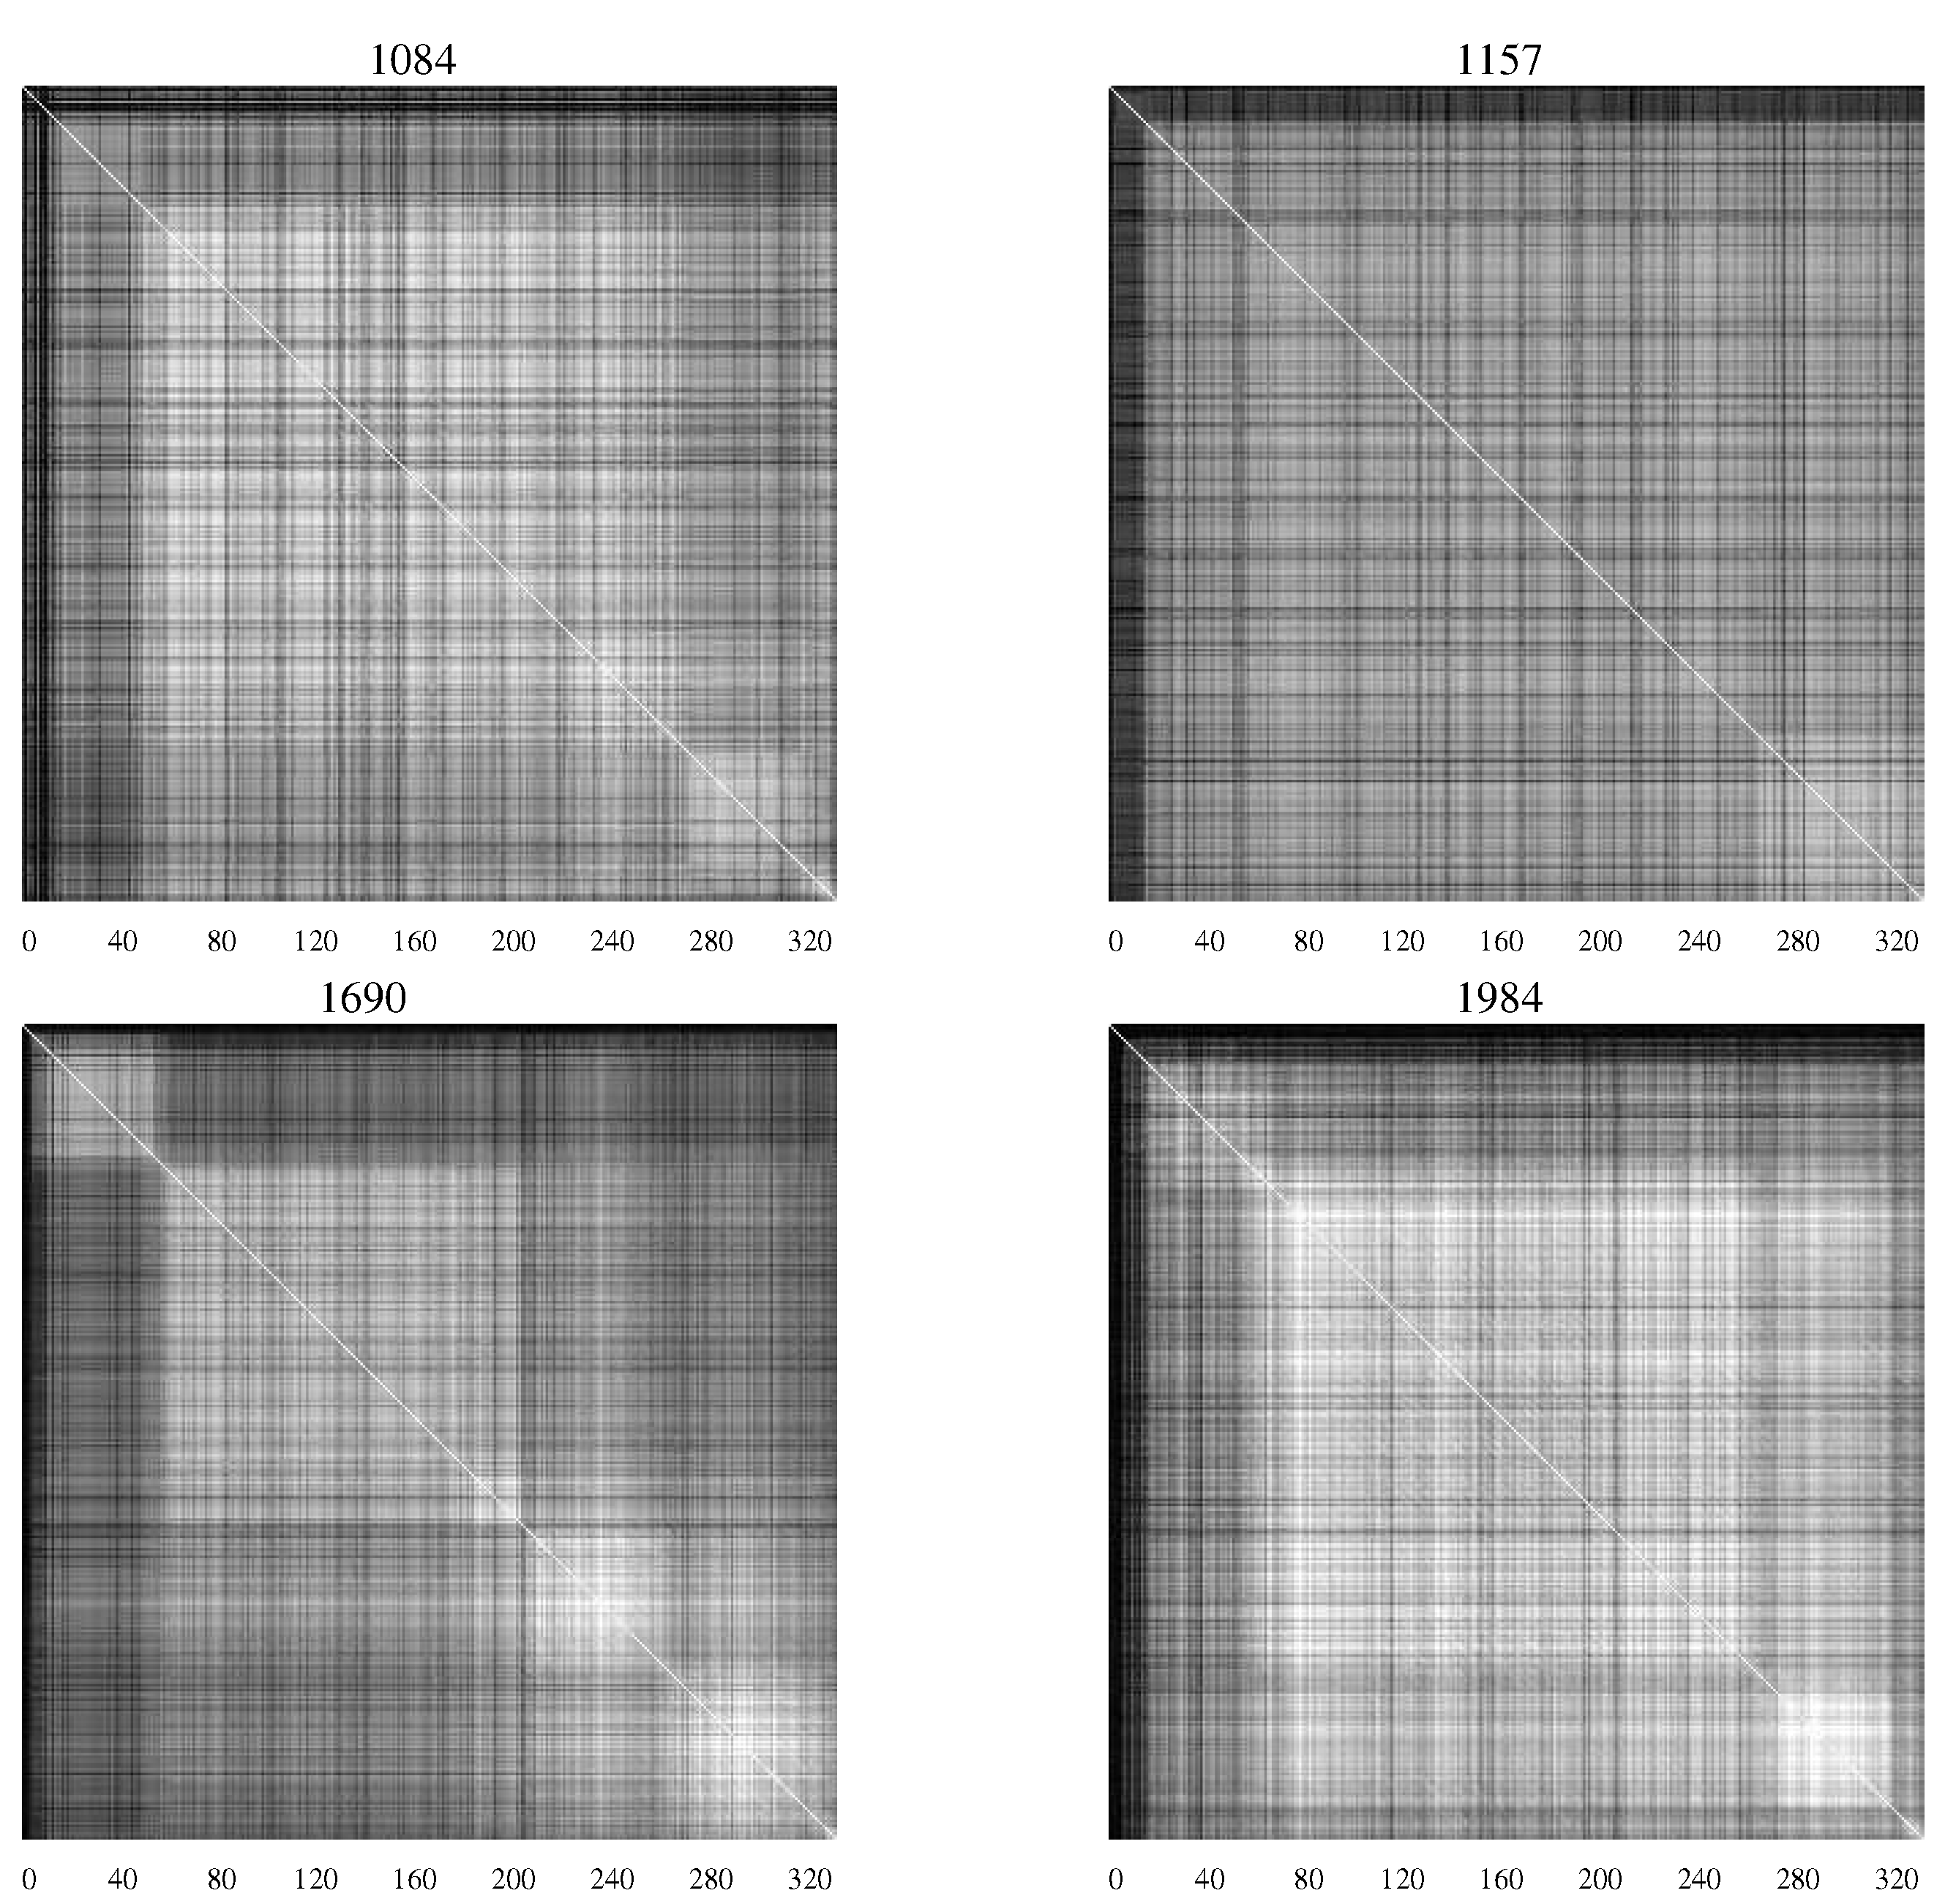
AMI charts developed by Sayood
et al. [
20] when studying the differences between infected infants who succumbed to HIV and those who did not [
21,
22]. The AMI chart is simply a representation of the average mutual information values in the form of a matrix where the
pixel in the chart represents the average mutual information between the
residue and the
residue of the envelope protein.
Figure 4 contains
AMI charts representing the HIV population from infants who remained asymptomatic, while
Figure 5 shows
AMI charts representing viral populations for infants who succumbed to the disease.
Figure 4.
AMI charts for HIV-1 populations isolated from patients who remained asymptomatic. The large number of white pixels indicate generally a high degree of covariation while “checkerboard" regions indicate specific segments of the envelope protein with correlated mutations [
20].
Figure 4.
AMI charts for HIV-1 populations isolated from patients who remained asymptomatic. The large number of white pixels indicate generally a high degree of covariation while “checkerboard" regions indicate specific segments of the envelope protein with correlated mutations [
20].
The difference in the charts shows the differing characteristics of the populations with substantial levels of mutation continuing in those patients who remained asymptomatic—an indication perhaps of continuing efforts of the viral population to overcome the host defenses.
There is great uniformity as well as divergence in life. Many organisms use the same proteins to perform the same functions. These proteins have very similar primary sequences though there might be slight variations. The study of these variations in the context of which organism the protein came from can help us understand something about the role of the proteins. These studies have used the average mutual information in order to study correlated mutations in proteins [
23,
24,
25,
26]. Correlations among residues can be evidence of secondary structure. Adami [
27] has used this fact to explore secondary structure in RNA and proteins.
The DNA of organisms contains regions which code for proteins and regions which do not. In eukaryotes these regions are interspersed in genes. Because the protein coding regions are interpreted in terms of triplets, one would expect a periodicity of three in the dependence between bases in coding regions, and no such periodicity in non-coding regions. This is indeed the case and the existence or non-existence of such periodicity in the average mutual information can be used to distinguish between coding and non-coding regions [
28].
Figure 5.
AMI charts for HIV-1 populations isolated from patients who succumbed to AIDS. The preponderance of black pixels indicates a relatively homogeneous population [
20].
Figure 5.
AMI charts for HIV-1 populations isolated from patients who succumbed to AIDS. The preponderance of black pixels indicates a relatively homogeneous population [
20].
Instead of treating a large number of sequences as multiple realizations of a random process, we can also analyze long single sequences assuming ergodicity. By computing the average mutual information between bases that are
k apart,
under the ergodic assumption, we can create an average mutual information profile for a given genomic sequence. Bauer and colleagues [
29,
30] have shown that these profiles can be used as a signature for the species from which the DNA was obtained. Thus, a mouse will have a different average mutual information profile than a human. Even for closely related organisms the average mutual information profile can be used to detect evolutionary relationships. Bauer and colleagues show that the average mutual information profile can be used to cluster subtypes of the HIV-1 virus. The fact that average mutual information profiles reflect evolutionary relationships has been demonstrated by Berryman
et al. [
31] who show how the average mutual information profile for a chromosome reflects events in the organisms evolutionary history. Holste
et al. [
32] demonstrate the effect of evolutionary history on the average mutual information profile by showing the effect of evolutionary events on particular characteristics of the profile for various human chromosomes.
Much of the work cited above used relatively long sequences of DNA on the order of many thousands of bases. The average mutual information profile has also been shown to be useful when used with relatively short fragments of DNA. When obtaining the sequences of DNA one is faced with a conundrum. The DNA molecules we wish to sequence are quite long, consisting of millions of bases. The technology for obtaining sequences works only for fragments whose length is measured in the hundreds. The solution for this conundrum is often a method, called shotgun sequencing, in which multiple copies of the target DNA molecule are broken into random fragments that are small enough to be sequenced. Because multiple copies of the DNA molecule have been fragmented randomly many of these fragments will tend to overlap. The sequences of overlapping fragments can be put together to form much longer sequences called
contigs. The process of finding overlapping fragments is a computationally expensive one. However, it can be simplified if we note that the average mutual information profiles of neighboring fragments are more similar than those of fragments further away. Otu
et al. [
33] have used this fact to divide the fragments into clusters based on their average mutual information profile, using the Linde-Buzo-Gray [
34] algorithm for clustering, thus considerably reducing the complexity, and increasing the accuracy of reassembly.
The concept of average mutual information has also been used to understand relationships between expression patterns of genes. A popular method for observing a cell in action is through the use of microarrays. By measuring the amount of messenger RNA present under different conditions these arrays indicate which genes are active in each condition and the level of activity. A gene seldom acts alone and in order to understand the causal relationships between genes it is important to find which genes behave similarly. A number of studies use average mutual information to obtain this clustering [
35,
36,
37].
5. Compression and Phylogeny
General purpose compression algorithms do not perform well with biological sequences, resulting quite often in expansion rather than compression. Giancarlo
et al. [
2] have provided a detailed review of compression algorithms designed specifically for biological sequences. For the sake of completeness, we briefly describe some of the more popular algorithms here. Our main focus, however, is on the relationship of compression concepts with evolutionary distance metrics.
Probably one of the most well-known DNA compressors is Gencompress [
38]. Gencompress uses the fact that DNA sequences contain tandem repeats, multiple copies of genes and palindromic sequences. It involves a modified Lempel-Ziv (LZ) algorithm [
39] which searches for reverse complements and approximate repeats. Approximate repeats are subsequences which can be transformed into a copy of the original subsequences using a small number of edit operations (substitution, insertion, deletion). Copying an approximate repeat and modifying it with edit operations is shown to be cheaper in terms of bits than describing the sequence under construction in some other manner. Gencompress performs better on average when compared to previous well-known programs Biocompress and Biocompress-2 [
40] which only consider exact repeats and exploit short range correlations by employing a second order arithmetic coder in non-repeat regions. Gencompress was later improved upon by DNAcompress [
41] which has better approximate search modules.
Matsumoto
et al. [
42] used a context tree weighting model with an additional LZ component to capture approximate repeats. Additionally, it is shown that the algorithm works on protein sequences.
Cfact is another popular method which compresses the biological data using a two-pass strategy: in the first pass a suffix tree is trained which is used to compress the biological data in the second pass. Behzadi and Fessant [
43] find repeats to the cost of a dynamic programming search and select from a second order Markov model, a context tree and two-bit coding for the non-repeated parts.
To date, the best compression ratios have been reported by Cao
et al. [
44]. They use an expert model with Bayesian averaging over a second order Markov model, a first order Markov model estimated on short term data (last 512 symbols) and a repeat model. Weighting of probabilities for each model is based on the minimum description length of the corresponding model in short time history (previous 20 symbols). One advantage of this method is that it assigns probabilities to each symbol to be encoded, therefore we can evaluate the information content of each region spatially. Expressed per element complexity can provide information about the structure of the regions and local properties of a genome, or proteome.
Perhaps more than their use in compressing biological sequences, compression algorithms, in particular variants of the Ziv-Lempel algorithms [
39,
45], have been useful as measures of evolutionary distance. The basic idea behind this application of compression algorithms is that a sequence compressed in the context of another sequence will result in higher compression when the two sequences are related. Benedetto
et al. [
46] showed that the manner in which the Ziv-Lempel algorithms develop their dictionary can be used to develop a measure of the relative distance between sequences from different sources. The measure relies on the fact that the level of compression is based on the ability to find longer and longer patterns that have existed in the “past" of the sequence. Benedetto
et al. examine the case where a Ziv- Lempel compressor (or zipper in the terminology of Benedetto
et al.) is used to compress concatenated sequences from two different sources. As long as the compressor is parsing the sequence from one source it will become more and more efficient as it has a longer and longer history to draw upon in order to find longer and longer matching patterns. However, as soon as the compressor encounters the sequence from a different source the compression efficiency will decline as the compressor will attempt to find patterns from the second source in the history of the first source. The amount of decrease in efficiency will depend on the dissimilarity between the two sources. In order for the dissimilarity to be evident the second sequence has to be relatively short in order to prevent the compressor from accumulating a long history of the second sequence or, as Pugliosi
et al. [
47] characterize it, learning the second sequence. Benedetto
et al. [
46] use this measure of similarity to determine authorship, and for determining the phylogeny of languages. This latter application is what interests us as there is a great deal of literature [
48,
49] which suggests that languages evolved through a process of natural selection similar to biological evolution. Therefore, a measure of distance which seems to reflect evolutionary distance between languages would also be useful in understanding phylogenetic relationships between organisms. Li
et al. [
50] used Gencompress as the distance estimator in hierarchical clustering of biological sequences as a solution to the phylogeny construction problem. The trees they suggested are in accordance with the current knowledge of taxonomy. Apostolico [
51] constructs approximate dictionaries using extensible patterns generated by a constructive algorithm and yields plausible trees of phylogeny.
Otu and colleagues [
52,
53] took the approach of Benedetto
et al. [
46] and Pugliosi
et al. [
47] one step back. Instead of using the compression algorithms themselves they used the principles behind the compression algorithms to come up with a measure of distance between sequences. The Ziv-Lempel compression algorithms [
39,
45] are based on an idea of complexity presented by Lempel and Ziv in [
54]. This Lempel-Ziv complexity, as in the case of the compressor, involves parsing a given sequence using a set of grammar rules. Each individual parsed element is obtained as a copy of previously occurring subsequence followed by a unique character. The number of parsed elements obtained for a sequence
Q represents the complexity of the sequence
. Given two sequences
Q and
R, the complexity of the concatenated sequence
minus the complexity of the sequence
Q,
, is an indicator of the similarity between the sequences
Q and
R. Otu and colleagues show that this similarity can be used to construct a highly robust distance metric for DNA sequences. They use this distance metric to construct phylogenies for a variety of organisms. This distance measure has also been used for studying evolutionary processes in regulatory regions [
55] and for generating rapid multiple alignments [
56].
That the basic principle behind the Lempel-Ziv compression algorithms have been so successful in identifying evolutionary relationships may mean that the differences uncovered through the use of compression are somehow natural to the evolutionary process. This speculation is further supported by the exploitation of distance metrics based on compression for protein classification [
57,
58,
59,
60] and genome segmentation [
61]. Kocsor
et al. [
58] showed that using compression based approaches can be more accurate for protein classification than the commonly used Smith-Waterman alignment algorithm or Hidden Markov Models. Pelta [
59] showed that the compression of protein contact maps can be used for protein classification and [
62] showed that the UNIX
compress algorithm can be used for protein domain identification.
6. Grammar and Biology
The Lempel-Ziv algorithms, though usually not thought of that way, are examples of the use of a grammar for compression. The original concept behind abstract grammars is that a grammar G is meant to completely describe the underlying structure of a corpus of sequences. Because most naturally occurring sequences contain repetition and redundancy, grammars are often able to describe sequences efficiently. Hence, the usage of grammars can be thought of as a means to provide compression.
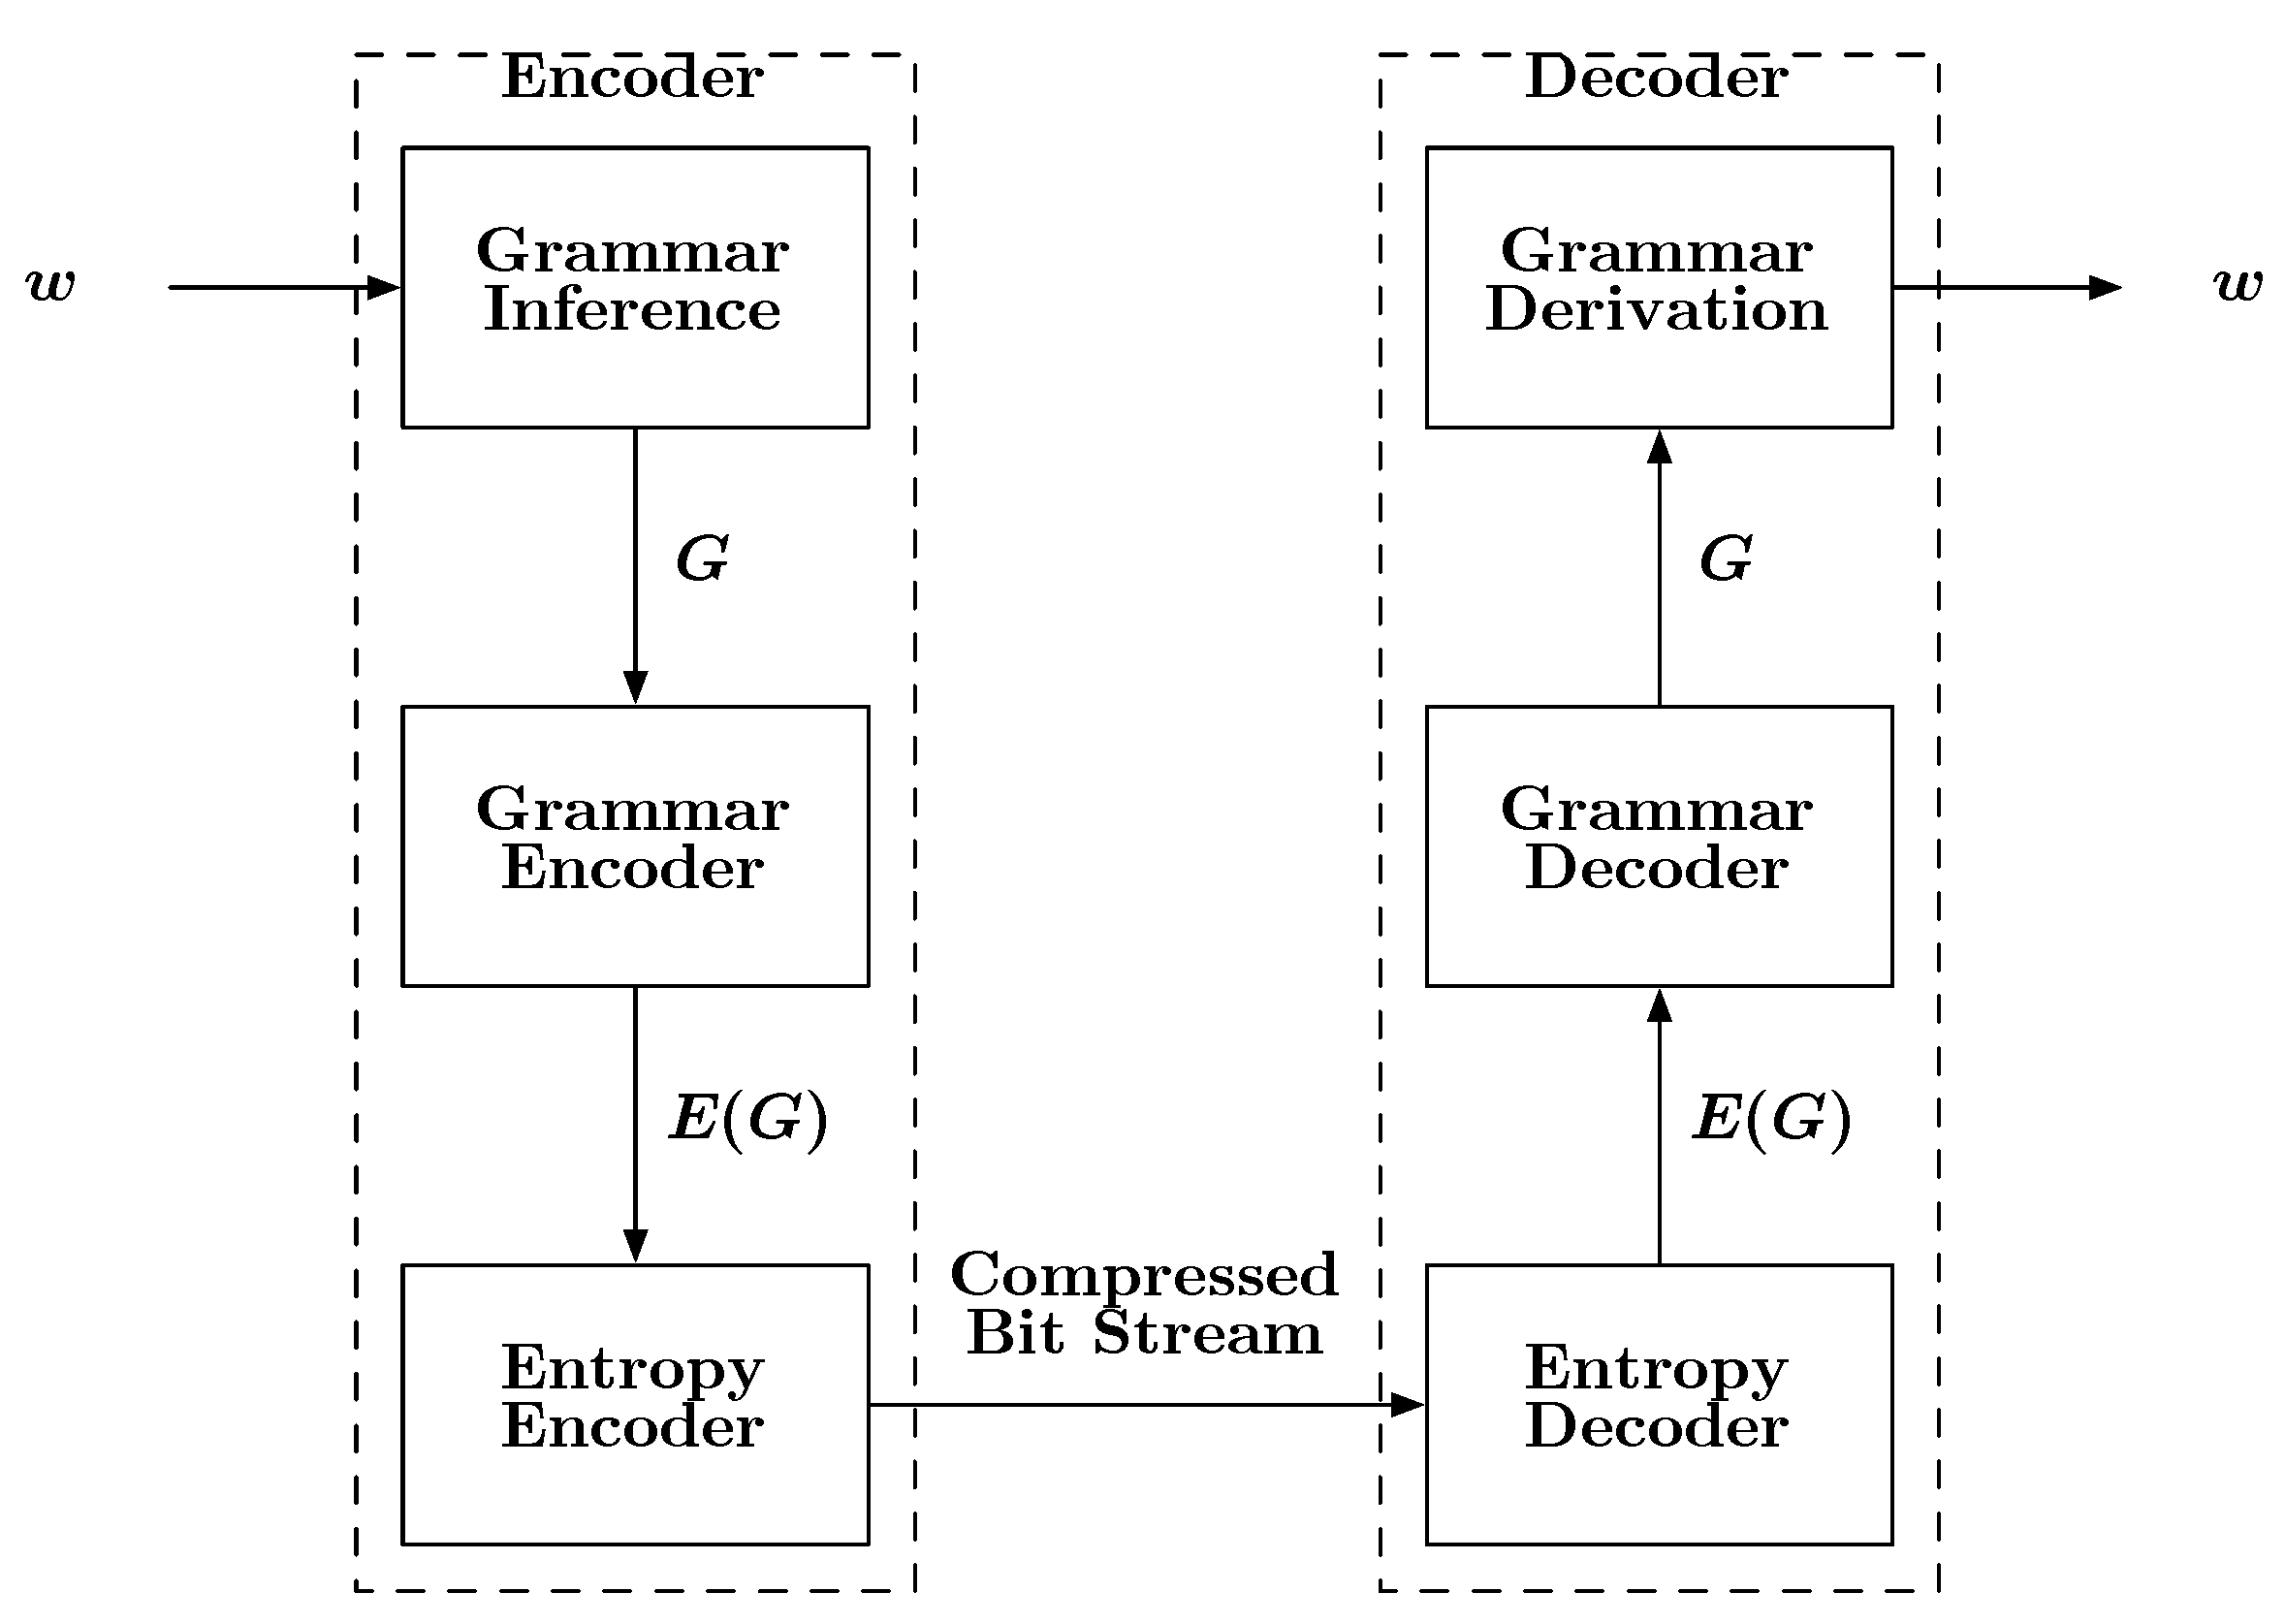
A block diagram describing how grammars can be used for compression is shown in
Figure 6. The input to the encoder is a sequence
w. The encoder first infers a grammar
G specific to
w. It should be noted that an orthodox linguist may not approve of the term “grammar” in the sense provided here, as
G will derive the single string
w and nothing else. However, time and engineering often find ways of modifying and applying existing ideas to new applications. Once the grammar is estimated, it is encoded, first into symbols then into bits, followed by storage or transmission. Upon reception, the bits are decoded into symbols and then into the inferred grammar
G. Given this kind of grammar, it is a simple matter to recover
w from
G by beginning with the special “start symbol”
S, which is part of
G. In a seminal paper Kieffer and Yang [
63] showed that a grammar based source code is a universal code with respect to finite state sources over a finite alphabet.
Among many other linguistic innovations, Noam Chomsky defined four categories for types of grammars in [
64] and elaborated upon in [
65]. The language levels are contained in terms of complexity as
, where type-3 or regular grammars generate regular languages, type-2 or context-free grammars (CFGs) generate context-free languages, type-1 or context-sensitive grammars (CSGs) generate context-sensitive languages, and type-0 or unrestricted grammars generate recursively enumerable languages. All other languages can be classified between type-3 and type-0. Knowing the type-containment of a certain grammar is important in understanding the computational complexity necessary in solving linguistic problems.
Figure 6.
A block diagram depicting the basic steps involved with a grammar-based compression scheme.
Figure 6.
A block diagram depicting the basic steps involved with a grammar-based compression scheme.
Identification of function and/or meaning of segments of biological sequences remains an ongoing and active area of research. This means studying primary structure, or the sequential ordering, of sequences and the secondary structure, or the three-dimensional shapes that form due to attractions that occur among separated segments within the sequences. A somewhat uncommon method for predicting RNA secondary structure focuses only on the information contained within the sequences. For example, [
66] reviews many ways in which linguistics, specifically abstract grammars, may be used to model and analyze secondary structures found in RNA and protein sequences. Another example [
67] includes RNA secondary structure prediction using stochastic context-free grammars (SCFGs).
Abstract grammars have been shown to be useful models of biological sequences at various levels of detail. Surveys presented in [
68] and [
69] describe correlations between linguistic structures and biological function. In particular, linguistic models of macromolecules [
70,
71], have been used to model nucleic acid structure [
72,
73,
74], protein linguistics [
75,
76], and gene regulation [
77,
78,
79]. Much of the work available in the literature assumes the underlying grammar is known
a priori. Hence, there is a need for general methods to infer grammars efficiently from biological structures.
In [
80] and [
81] a general algorithm is presented for inferring sequential structure in the form of CFGs for generic inputs including biological data. Two other algorithms in which sets of arbitrary sequential data are categorized to generate a CFG are presented in [
82] and [
83]. One drawback with these algorithms, is the inability to make use of domain knowledge, although [
80] discusses the improvement available when domain knowledge is applied. In fact, the algorithm was modified in [
84] to operate specifically on DNA and makes use of the Chargaff base pairing rules to generate a more compact model.
The most commonly known and recognized application of grammars to computational biology are in the form of SCFGs used to search for the most likely secondary structures in RNA leading to the identification of mechanistic elements that control various aspects of regulation [
67,
85,
86,
87,
88]. Another application has found use in multiple sequence alignment [
56], where a simple regular grammar was inferred and used as an information-theoretic metric in determining distance between organisms. The remaining primary usage of grammars are in a data-mining paradigm, where grammars are used to efficiently scan databases full of experimental data from the literature (e.g., RegulonDB).
More interestingly, some work has briefly been done in regards to modeling Genetic Regulation Networks (GRNs) using a subclass of context-sensitive grammars [
68,
73,
74,
77,
89] called definite clause grammars (DCGs) developed in the efficient language, Prolog. This was further developed into Basic Gene Grammars in [
79]. The end result is a very high-level model description with a database approach to determining the classification of sequences of data
in silico.
