Entropic Behavior of Binary Carbonaceous Mesophases


Department of Chemical Engineering, McGill University, Montreal, Quebec H3A 2B2, Canada
*
Author to whom correspondence should be addressed.
Entropy 2008, 10(3), 183-199; https://doi.org/10.3390/entropy-e10030183
Submission received: 28 July 2008
/
Revised: 19 August 2008
/
Accepted: 19 August 2008
/
Published: 23 August 2008
(This article belongs to the Special Issue Configurational Entropy)
Abstract
:The Maier-Saupe model for binary mixtures of uniaxial discotic nematogens, formulated in a previous study [1], is used to compute and characterize orientational entropy [2] and orientational specific heat. These thermodynamic quantities are used to determine mixture type (ideal or non-ideal) which arise due to their different intrinsic properties, determined by the molecular weight asymmetry ΔMw and the molecular interaction parameter β. These molecular properties are also used to characterize the critical concentration where the mixture behaves like a single component system and exhibits the minimum nematic to isotropic (NI) transition temperature (pseudo-pure mixture). A transition within the nematic phase takes place at this specific concentration. According to the Maier-Saupe model, in a single mesogen, entropy at NI transition is a universal value; in this work we quantify the mixing effect on this universal property. The results and analysis provide a new tool to characterize molecular interaction and molecular weight differences in mesogenic mixtures using standard calorimetric measurements.
1. Introduction
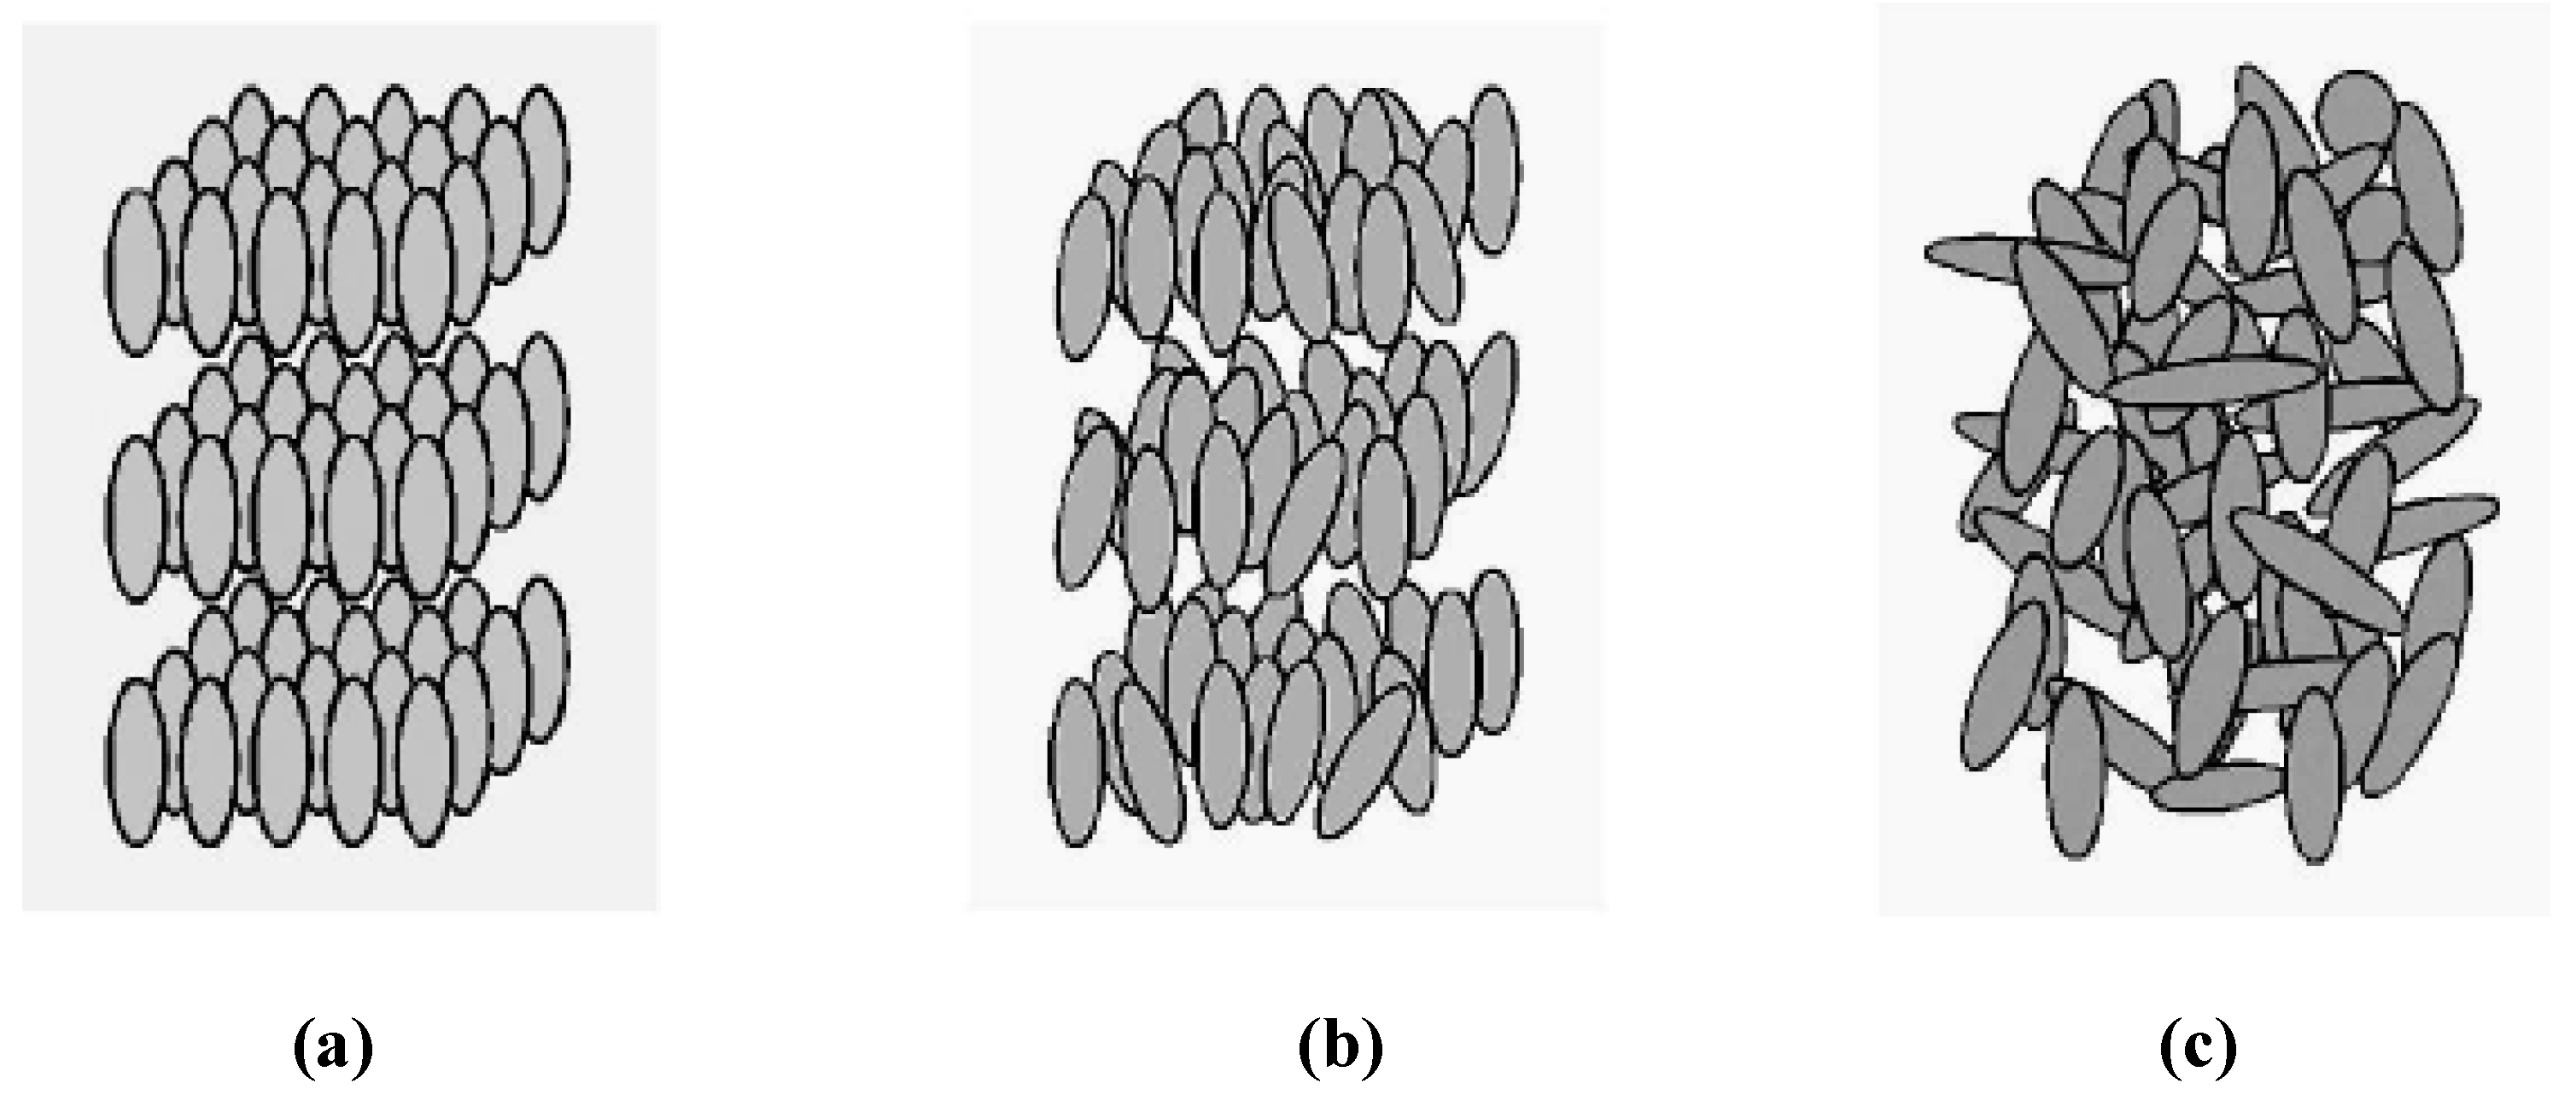
An ideal crystalline solid (Figure 1a) has: (i) perfect orientational order as well as (ii), perfect positional order. On the other hand, an isotropic liquid (Figure 1c) lacks any kind of ordering, either orientational or positional. Between these two extremes lies a nematic liquid crystal that has a partially orientational order without any positional order (Figure 1b) [3].
Figure 1.
The comparison of three states of the material: a perfect crystalline solid with positional and orientational order (a), a liquid crystal with positional disorder and partial orientational order (b) and an isotropic liquid with positional and orientational disorder (c).
Figure 1.
The comparison of three states of the material: a perfect crystalline solid with positional and orientational order (a), a liquid crystal with positional disorder and partial orientational order (b) and an isotropic liquid with positional and orientational disorder (c).
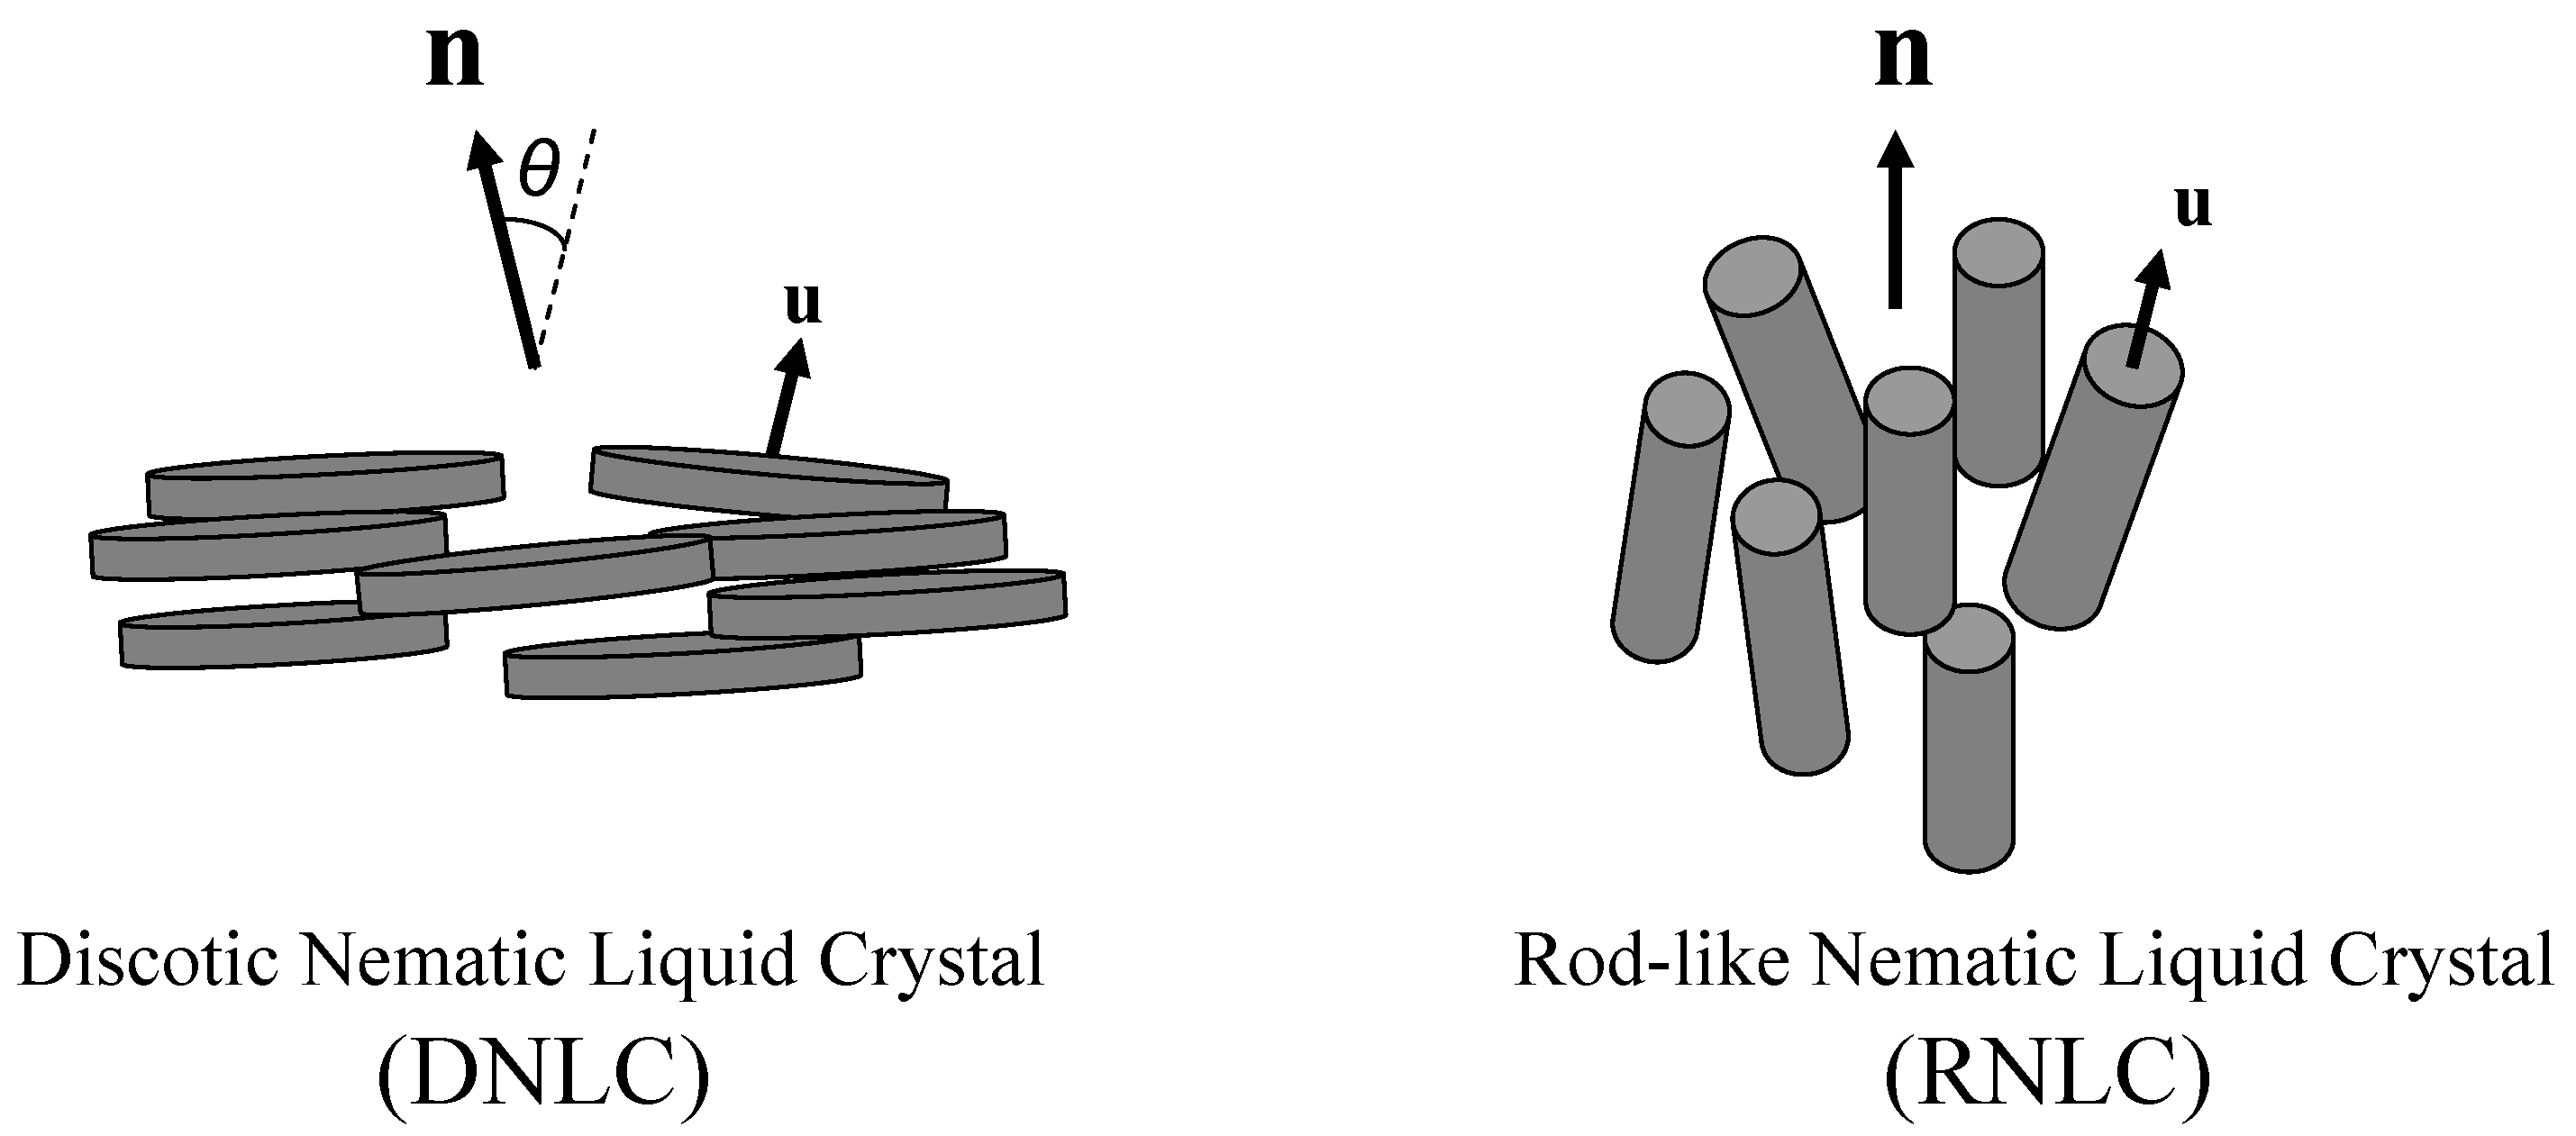
In nematic liquid crystals [4] (NLCs), the long molecular axes (u direction in Figure 2) are preferably oriented along a particular direction called the director n (Figure 2). In discotic nematic liquid crystals (DNLCs) the director n is perpendicular to the long axis of discotic molecules (Figure 2). In rod-like nematic liquid crystals (RNLCs) n is parallel to the long axis of the molecules (Figure 2). Carbonaceous mesophases (CMs), first reported by Brooks and Taylor [5], are DNLC mixtures obtained from petroleum pitches and synthetic naphthalene precursors [6]. The composition, polydispersity, and molecular orientation of CMs play a significant role on the final properties of cokes [7], carbon foams, carbon/carbon composites [8], and carbon fibers [9,10,11,12].
Figure 2.
Schematic of nematic liquid crystals (NLCs), the director n is the average of the molecular orientation u, and its classification into discotic and rod-like molecules. In discotic nematic liquid crystals the director n (average orientation) is perpendicular to the long axis of the molecules; however, in rod-like nematic liquid crystals the director n is parallel to the long axis of the molecules.
The type and extent of NLC applications [13] are mainly determined by their thermal properties. For instance, it is known that the final structure of the fibers based on the pure liquid crystalline materials is influenced by the temperature [14,15,16,17]. The results of our previous study [1] shows that the structure of the fibers based on the real CMs which are composed of DNLC species with different molecular weights and concentrations are also influenced by the thermal effect.
By the use of thermodynamics, microscopic structure as well as macroscopic energetic and/or entropic aspects is revealed, so that comprehensive understanding of materials can be achieved [18]. One of the methods mostly used for this purpose is calorimetry. Calorimetric measurements are best suited for the recognition of phase transitions and the determination of their transition temperature. Specific heat, which can be measured by calorimetry, is one of the most useful quantities to investigate the thermal properties of LCs [18]. By use of this quantity three fundamental thermodynamic values viz. enthalpy, entropy, and free energy can be obtained; as a result, it can give an insight into the microscopic and macroscopic aspects of the system.
Theoretically, the entropic behavior and specific heat of pure NLCs are well understood by the Maier-Saupe theory [2]. For instance, this theory predicts a universal entropy value at nematic to isotropic (NI) transition for single component nematics [19]. But there is no systematic study to investigate how the composition changes the entropic value of NLC mixtures at NI transition. Experimental measurements of the entropic behavior are limited to specific nematic mixtures such as the mixtures of EPPV, PBPA and PBPA, EBBA [12,20,21,22]. However, a systematic study which includes a broad range of materials and their intrinsic properties such as polydispersity and molecular interaction between the components has not been performed. Moreover, these studies are not directed to CMs which are a mixture of discotic nematogens formed by the species at a certain range of molecular weight. In this paper, we study the general thermodynamic behavior, the entropic behavior, and the characteristic features of specific heat of a mixture of two thermotropic uniaxial discotic nematogens which represents a CM that only differs in molecular weight, thus precluding phase separation. Based on our previous study [1], depending on the intrinsic properties of the system, two types of mixtures arise: ideal and non-ideal (Figure 3). The ultimate objective of the current study is to use thermal properties and to determine the type of the mixture as well as its concentration that corresponds to the minimum transition temperature, critical concentration [1].
Maier-Saupe (MS) theory is widely used to describe the thermodynamics of nematic liquid crystals [25,26]. This mean field theory gives the temperature-dependence of the molecular orientation as well as macroscopic entropic aspects in mesogenic materials. It predicts the values of the experimentally measured scalar order parameters very well [25], and hence has been applied to different nematic liquid crystalline systems and can be adjusted to their mixtures [26,27,28,29]. In this paper, we use the Maier-Saupe (MS) theory generalized to binary uniaxial discotic nematogens. For binary mixtures of uniaxial mesogens the mixture quadrupolar order parameter is related to that of the individual components [1]:
where mi is the mole fraction of ith component. For uniaxial phase Q is given in terms of a temperature-dependent scalar order parameter s(T) and the average molecular orientation or director n:
, where I is the unit tensor. For binary discotic nematogens at equilibrium we find collinear directors
and the mixture uniaxial scalar order parameter then is:
Figure 3.
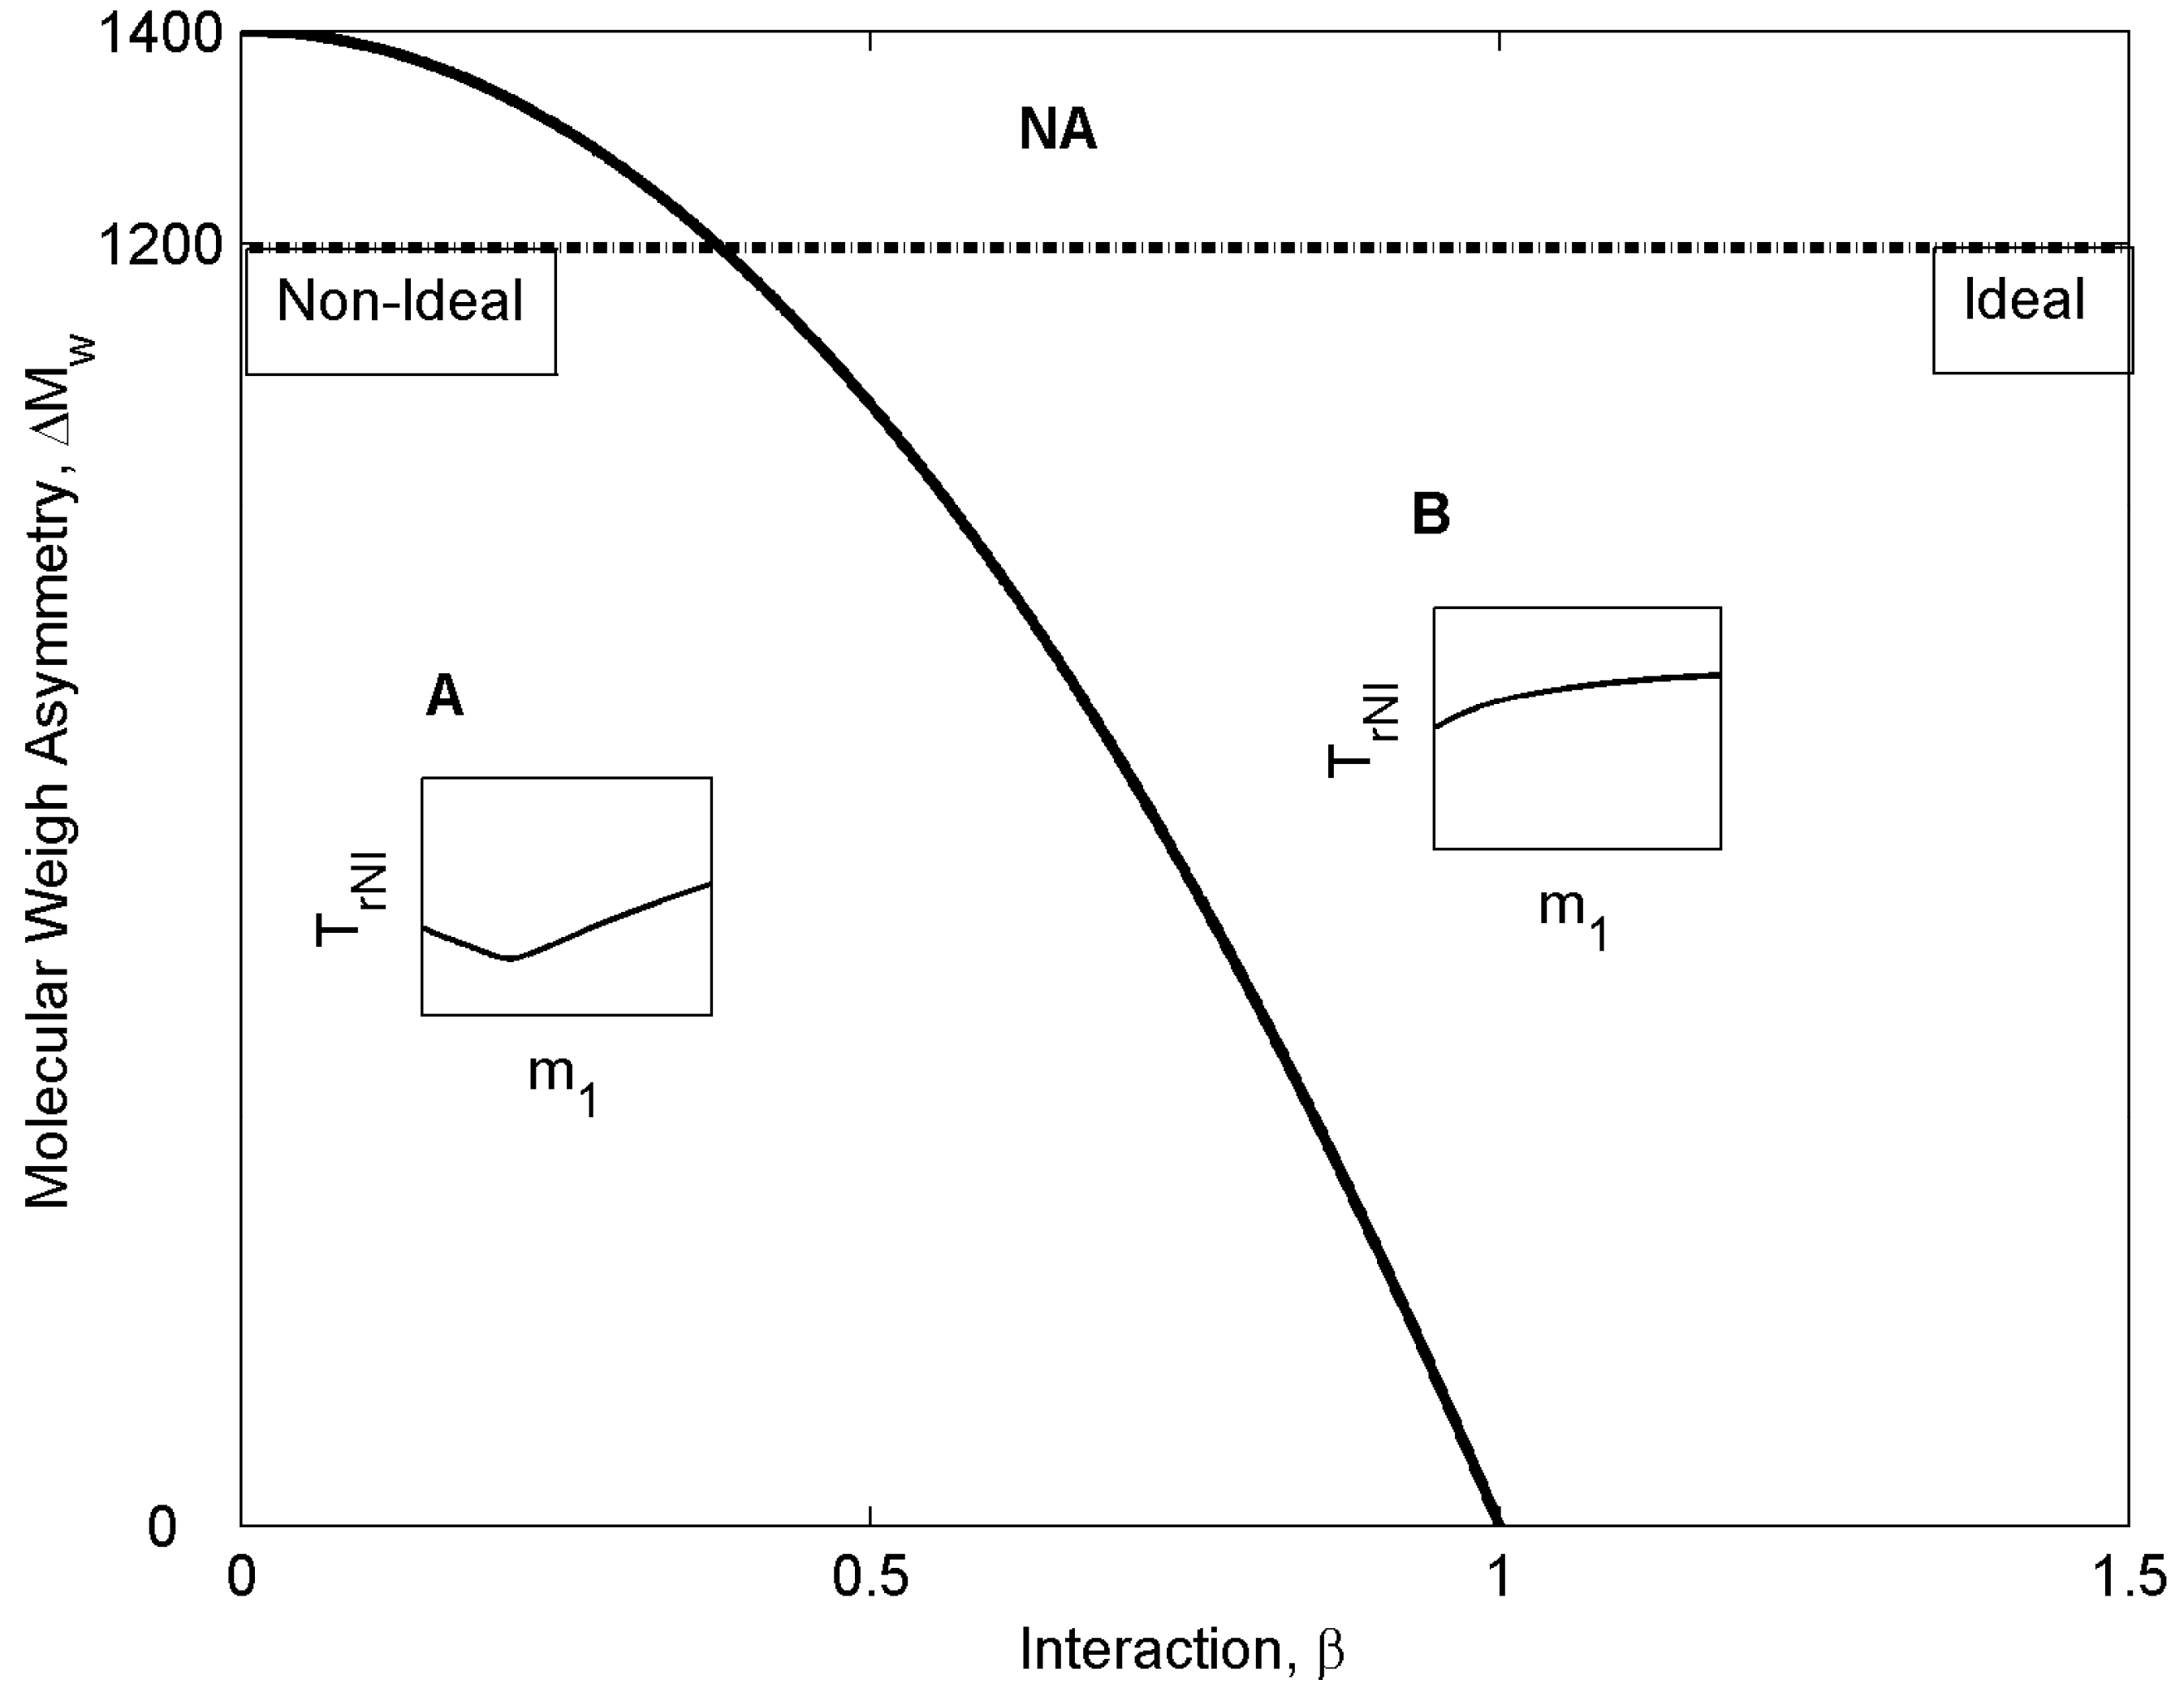
Classification of the mixtures into two types; type A with the non-ideal behavior and type B with ideal behavior, based on their intrinsic properties: molecular weight asymmetry ΔMw and molecular interaction parameter β. For weakly interacting mixtures and /or small molecular weight asymmetry the NI transition line exhibits a minimum by increasing the concentration (region A); however, for sufficiently strongly interacting mixtures and /or sufficiently large molecular weight asymmetry the NI transition line is monotonic (region B) [1].
Figure 3.
Classification of the mixtures into two types; type A with the non-ideal behavior and type B with ideal behavior, based on their intrinsic properties: molecular weight asymmetry ΔMw and molecular interaction parameter β. For weakly interacting mixtures and /or small molecular weight asymmetry the NI transition line exhibits a minimum by increasing the concentration (region A); however, for sufficiently strongly interacting mixtures and /or sufficiently large molecular weight asymmetry the NI transition line is monotonic (region B) [1].

Nevertheless since the ordering states of each species are coupled and are also dependent on temperature and dilution, we expect, based on the above observations, that a binary mixture displays three states:
- (i)
- isotropic (I) : s1 = 0, s2 = 0.
- (ii)
- nematic (N12) with s1 ≥ s2.
- (iii)
- nematic (N21) with s1 ≤ s2.
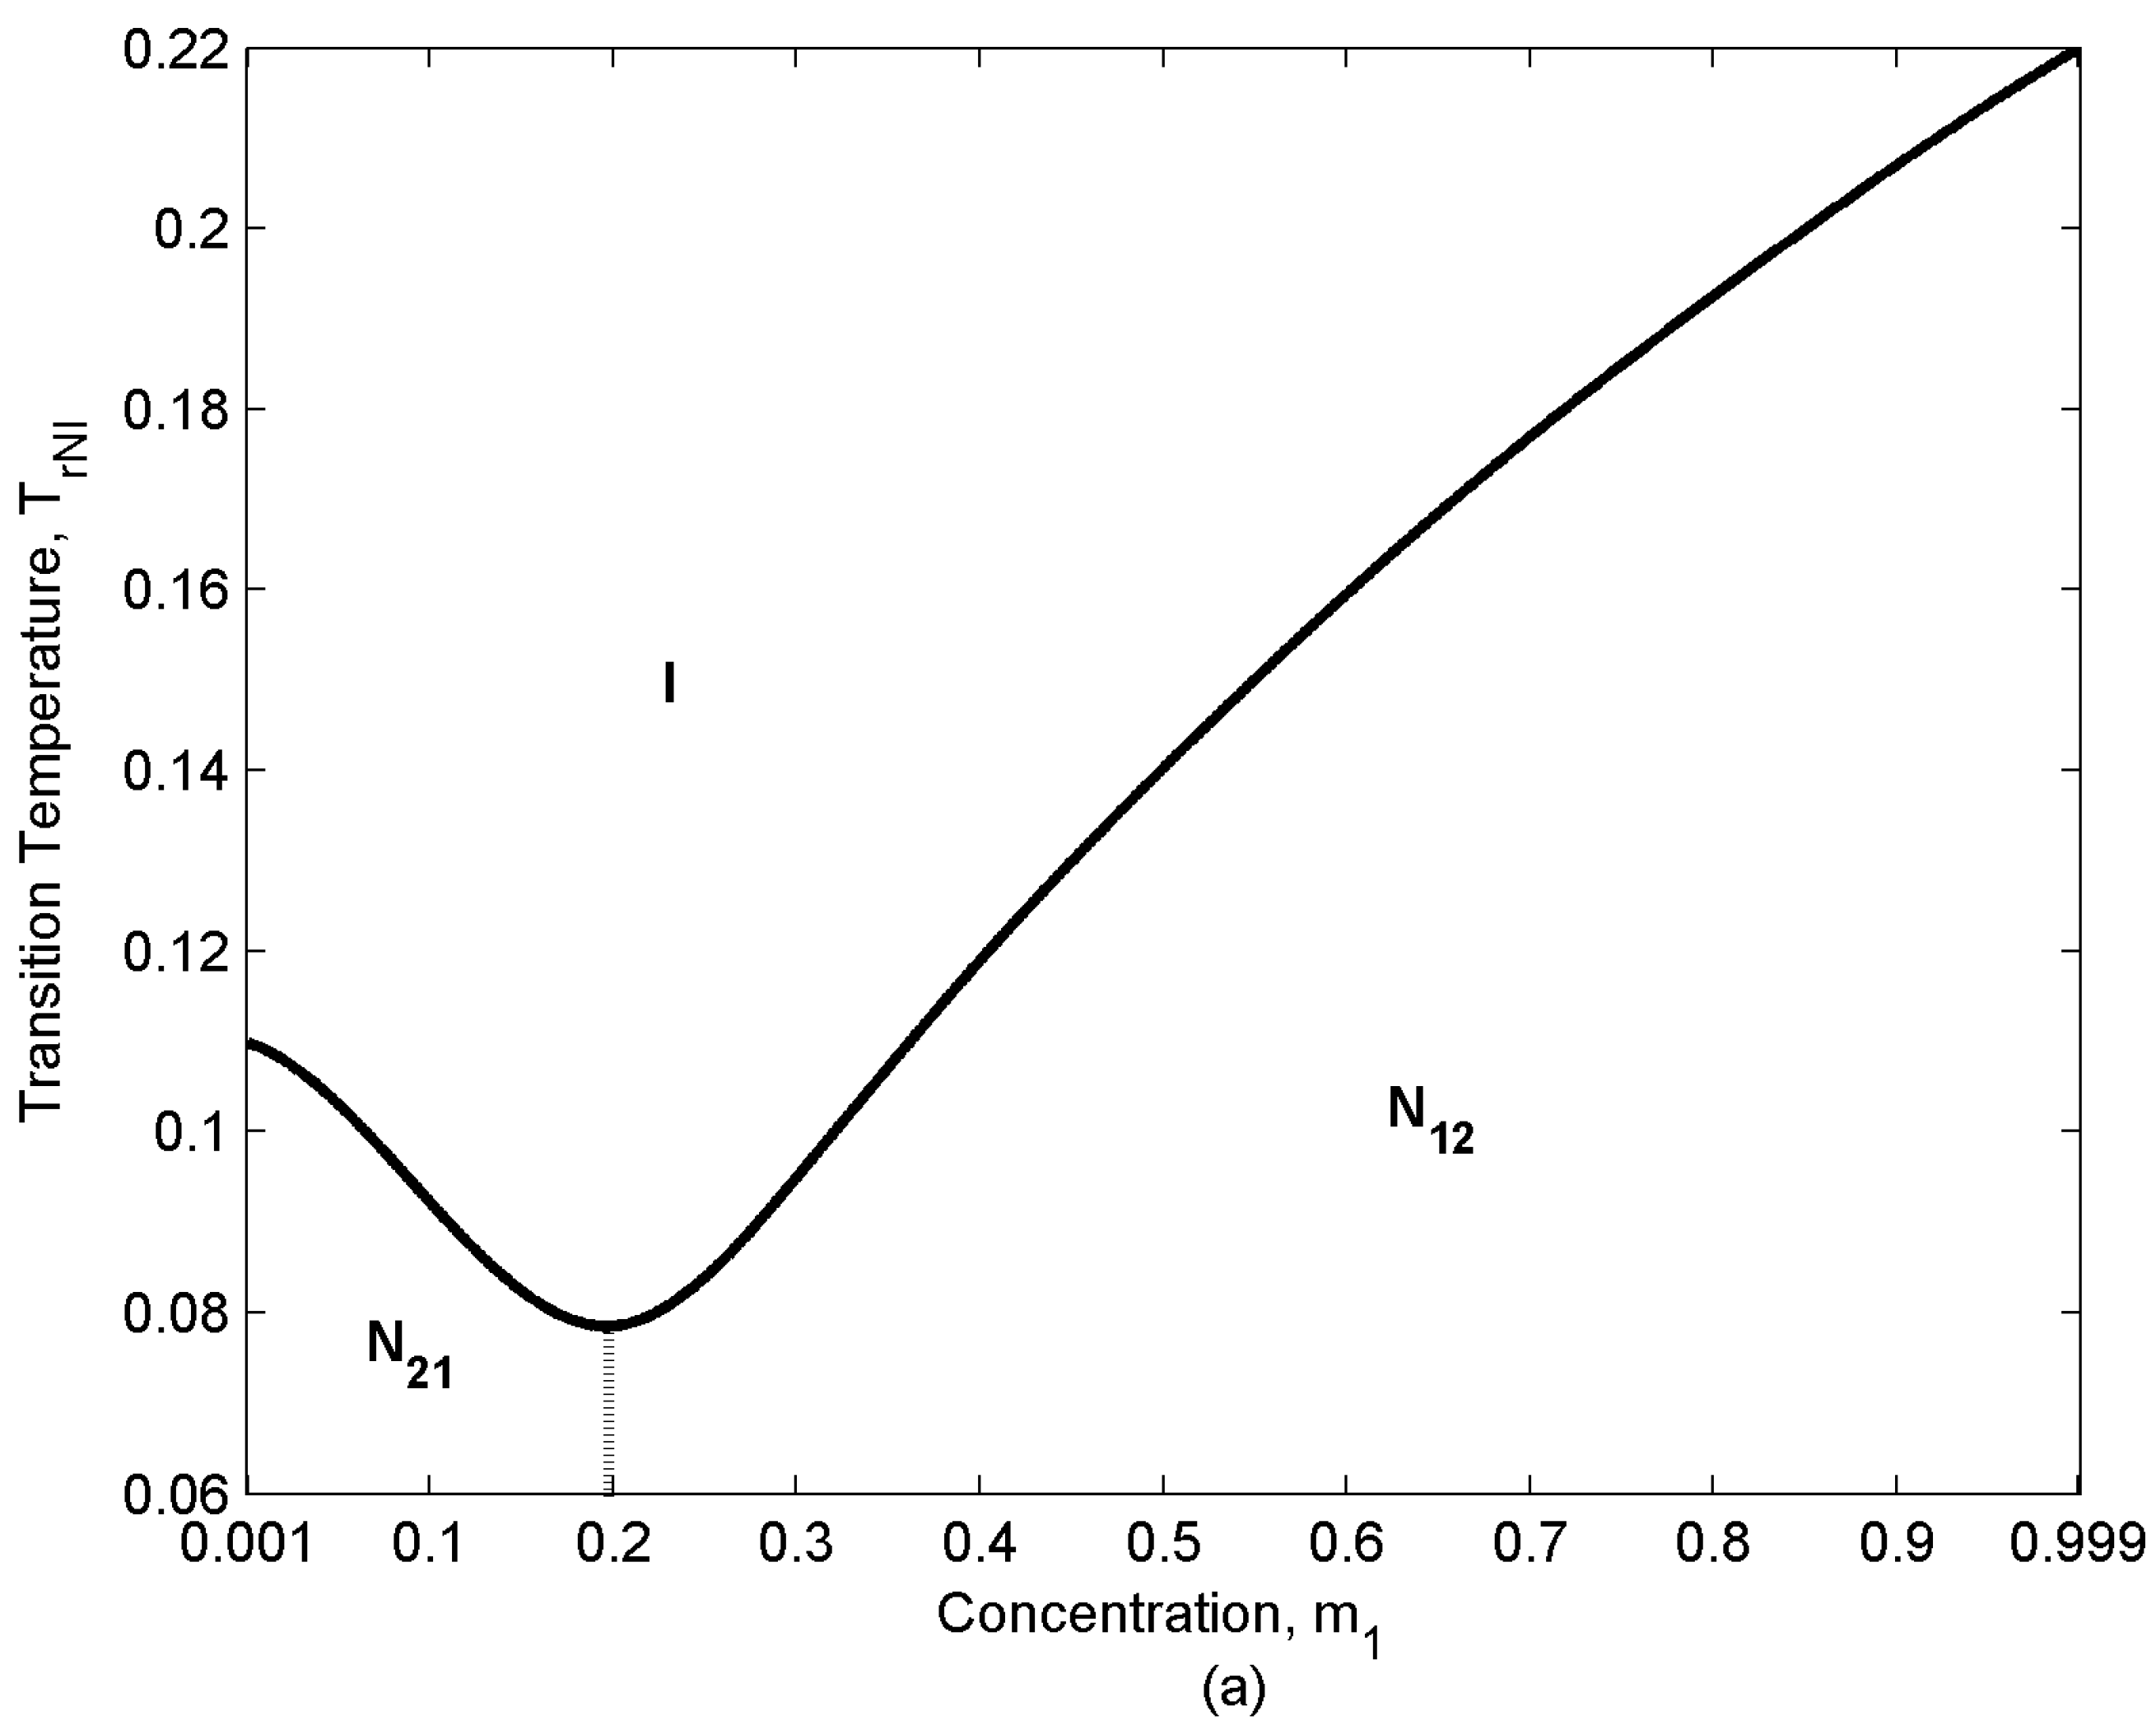
Figure 4 shows the typical phase diagram of these mixtures. Two kinds of transition take place within mixtures: (i) Nematic to Isotropic (NI) transition due to the thermal effect, and (ii) N12 to N21 transition within the nematic phase due to the concentration effect. For the later case s1 = s2 where N21 converts to N12; at this point nematic mixture behaves like a single component system, and the concentration corresponding to this transition is the critical concentration m1c at which the NI transition temperature is a minimum. The results of our previous study [1] show that depending on the molecular weight difference and the molecular interaction, two types of uniaxial nematic mixtures arise (Figure 3): (i) non-ideal mixtures; both kinds of transitions are observed within non-ideal mixtures, and (ii) ideal mixtures; only the NI transition takes place within this type of mixtures; N12 exists for all range of concentration; as a result, N21 and the critical concentration do not appear in the ideal mixture. Ideal binary mixtures arise under sufficiently strong interaction and sufficiently high molecular weight differences, while non-ideal mixtures arise under weak interaction and small molecular weight differences (asymmetries). As each carbonaceous mesophase mixture leads to different carbon fiber structure, it is of a great importance to be able to determine the type of the mixture.
Figure 4.
Schematic of the phase diagram of the binary mixture which includes three states: (i) isotropic (I), (ii) nematic (N12) and, (iii) nematic (N21). In N12 (N21) the higher (lower) molecular weight species has a higher molecular order parameter than the lower (higher) molecular weight component: s1 > s2 (s2 > s1). Depending on the type of the mixture N21 can appear and the transition within the nematic phase between N21 and N12 takes place (for non-ideal mixtures) or it can disappear (for ideal mixtures). The concentration which corresponds to the transition within the nematic phase is the critical concentration [1].
In previous work [1] we used the values of the X-ray diffraction intensity and the average ordering to characterize the type of the mixture and its critical concentration. In this paper we use specific heat and entropy, to characterize the binary mixtures. Figure 5 summarizes our objective schematically. It shows the schematic of the entropic values versus ordering for different concentration. Sr1(2) is the value of the entropy for a single component system. This value is universal at the NI transition. Our objective is to find out the effect of concentration, molecular weight asymmetry and the interaction between the components on the (i) entropic values and the entropic jump at transition and (ii) the rate of entropy change which is needed to calculate the values of the specific heat.
The specific objectives of this paper are:
- (i)
- To determine the entropic behavior of ideal and non-ideal mixtures.
- (ii)
- To calculate heat capacities of the two types of mixtures.
- (iii)
- To determine their entropic variation at transition.
The organization of this paper is as follows:
Section 2 presents the essential aspects of the MS binary mixture model. Orientational entropy of the binary mixture is also introduced in this section. The main parameters influencing the thermodynamics of the system are identified and the numerical solution scheme is defined. Section 3 presents the derivation of the orientational specific heat. This quantity is used to characterize the type of the mixture, ideal or non-ideal, as well as the critical concentration at which a non-ideal mixture behaves as a pure mesogen. Section 4 presents the numerical results and discussion: Section 4.1 presents entropic behavior of different types of mixtures for different concentrations. Section 4.2 discusses the specific heat of different ideal and non-ideal mixtures as a tool to characterize the type of mixture and its critical concentration. It also shows the effect of molecular weight asymmetry on specific heat values. Section 4.3 presents the effect of concentration on the entropy jump at NI transition for two types of mixtures: ideal and non-ideal. Finally, the conclusions are presented in section 5.
2. Maier-Saupe Binary Mixture Model
Details of the extension of Maier-Saupe model to a binary mixture of NLCs is given in our pervious study [1]. Here we briefly present the main features of the model which are necessary to obtain the entropic behavior and equilibrium phase diagram. The Helmholtz free energy per unit mole of the homogeneous mixture A is:
where NA, kB, T are the Avogadro’s number, Boltzmann’s constant and temperature respectively, and Emix, Smix, and Z are the internal energy , the orientational entropy, and the partition function of the mixture per molecule respectively. Emix is given by the summation of three contributions:
where
are the composition and molecular weight-dependent parameters [1]. Smix as the entropy of mixing per molecule and is given by:
and Z as the mixture partition function is factorized as:
where Zi,
and mi are the partition function, the partial internal potentials, and the mole fraction (concentration) of the ith species respectively.
The two equations of equilibrium are obtained by minimizing the free energy A [eqn.(3)] with respect to the species order parameters
. Scaling the Helmholtz energy A with the bare interaction parameter
, minimizing the resulting dimensionless free energy with respect to s1, s2 we find:
where
and
are effective mole fraction and the energetic parameter of the component “i” respectively. α is the angle between the directors of two components. The asymptotic limits of eqn. (6) (m1 = 0,1) correspond to the pure NLC. As discussed in our pervious work [1] for the present CM case, the mixture is uniaxial and hence the relative director aperture is α = 0. The thermodynamics of the mixture is defined by the dimensionless temperature Tr and two effective mole fractions
:
The two material parameters of the model are:
which are functions of the molecular weights Mwi of the two components:
where the parameters (a, b), based on the data of [30] are taken to be: a = -150 and b = 0.75. Since the molecular weight dependence of
is not suggested by actual data, we use:
where β is a constant whose sign depends on the geometrical nature of the species. For similar components, such disk/disk or rods/rod mixtures, it is positive; however, for dissimilar ones it is negative [31]. As CMs are mixtures of discotic molecules the interaction parameter is positive (β > 0).
We choose component “1” as a representative higher molecular weight component of a CM with Mw1 = 1,400 [32] and vary the lower molecular weight of the second component, Mw2, so that the molecular weight asymmetry ΔMw = Mw1-Mw2 > 0 changes.
The present thermodynamic model is given by the two nonlinear integral equations [eqns. (7)]; the solution vector consists of the two scalar order parameters (s1,s2); the two material parameters are β and ΔMw; the thermodynamic phase diagram is obtained by sweeping over temperature Tr and concentration m1. Equations (7a&b) are solved by the Newton-Raphson method, using an eighth order Simpson integration method. Stability, accuracy, and convergence were ensured using standard methods [33]. In the discussion of results we use the following nomenclature for dimensionless (reduced) entropy:
3. Specific Heat
The difference between dimensionless heat capacity of the nematic phase and that of the isotropic phase, ΔCpr, can be obtained by the orientational entropy which results from the ordering of the mixture [34]:
As the isotropic entropy is assumed to be zero, the value given by eqn.13 is the orientational part of the specific heat. Therefore,
shows the difference between Cpr of the nematic phase and Cpr of the isotropic phase. According to this equation two terms have direct contributions in the value of the specific heat: temperature,
, and the rate of entropy,
. Depending on the trend of
, the trend of
as a function of temperature changes. Once it increases monotonically, ΔCpr increases; however, once it decreases ΔCpr can either increases or decreases, depending the magnitude of each term,
and
. In this case, ΔCpr does not behave monotonically and exhibits a local extremum.
4. Results and Discussion
The Maier-Saupe for pure mesogens, whose interaction parameter is W, predicts the following universal values:
- (i)
- NI transition temperature:
- (ii)
- scalar order parameter in the N phase at transition: sNI = 0.4289
- (iii)
- Latent heat at the NI transition:
Hence, deviations form these values will provide information on the mixture, as shown below.
4.1. Entropic Behavior
Figure 5 shows the dimensionless entropy Sr as a function of ordering s, for a pure mesogen and an schematic for a generic mixture. As expected, entropy decreases with increase in ordering. At the NI transition the pure component displays the universal values (sNI = 0.4289,
), but for the generic mixture, the Figure shows a characteristic deviation for the universal transition values, which are discussed and quantified in detail in the rest of the paper.
Figure 5.
Schematic of the effect of concentration m1, molecular weight asymmetry ΔMw and the interaction parameter β on the type, entropy and ordering of the mixture. It shows the general trend of the dimensionless entropy Sr as a function of scalar order parameter smix. As ordering increases the entropy decreases. It also shows that diluting the pure system changes the ordering and the entropy at NI transition.
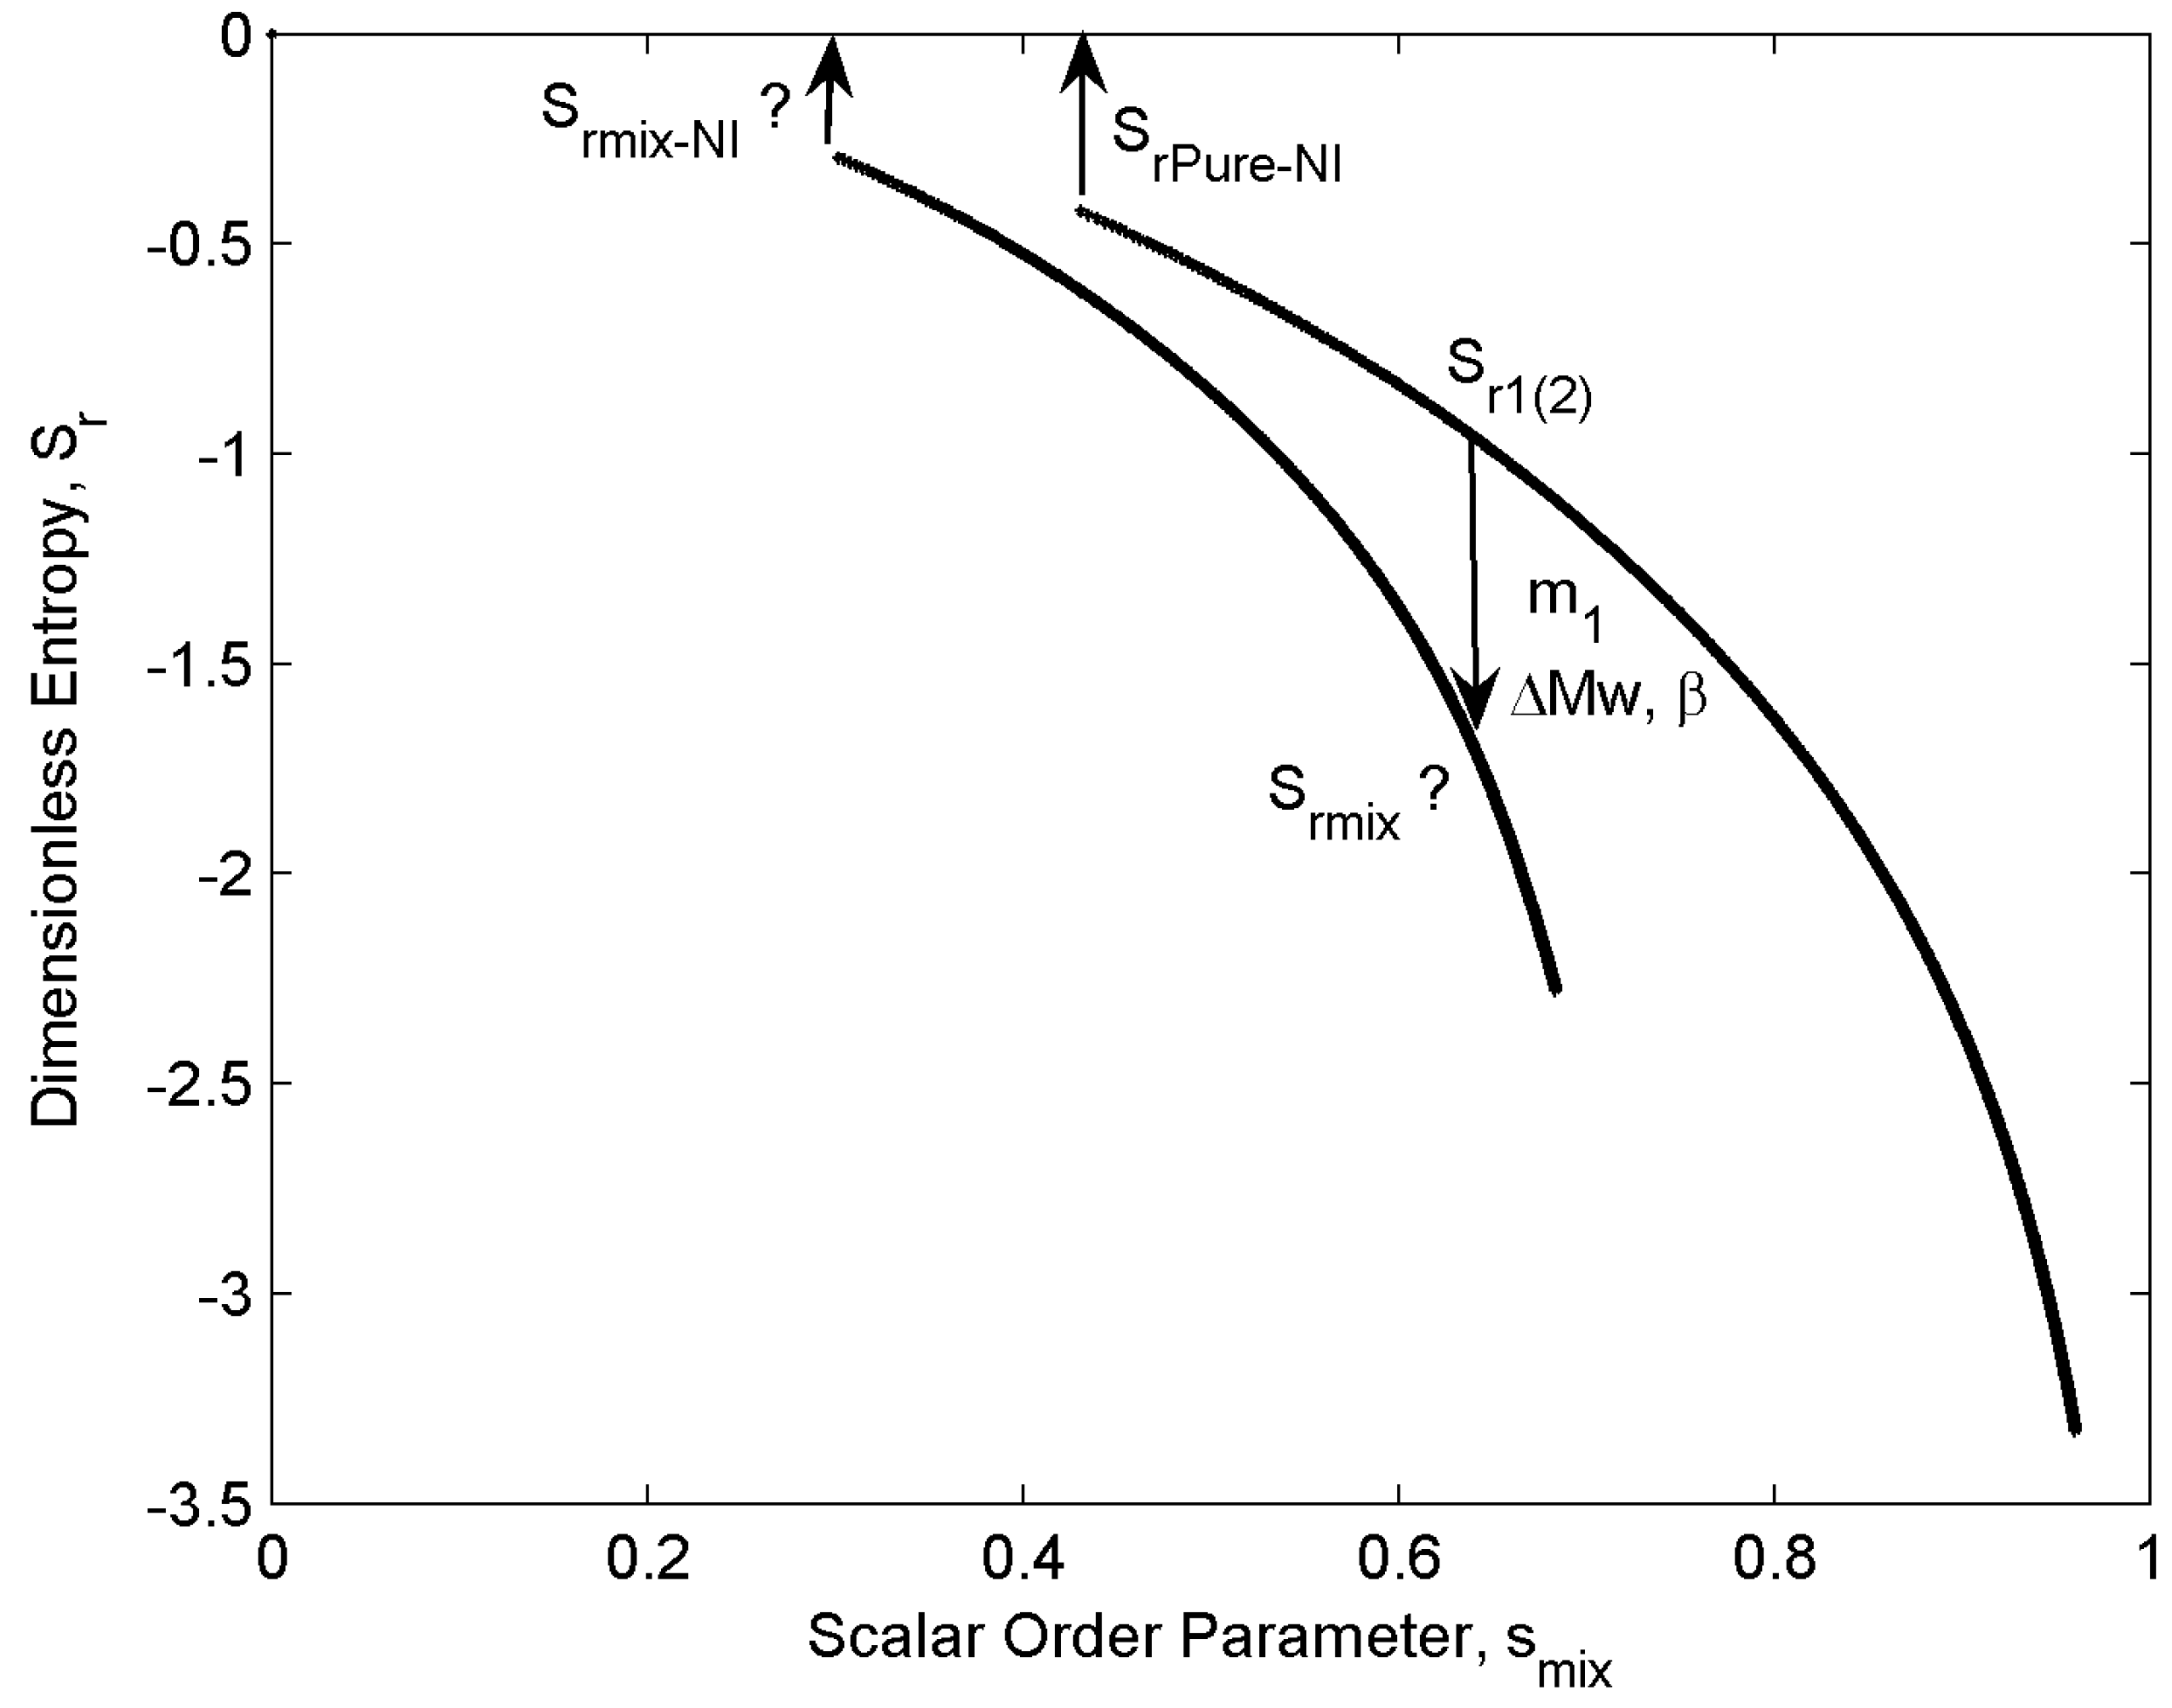
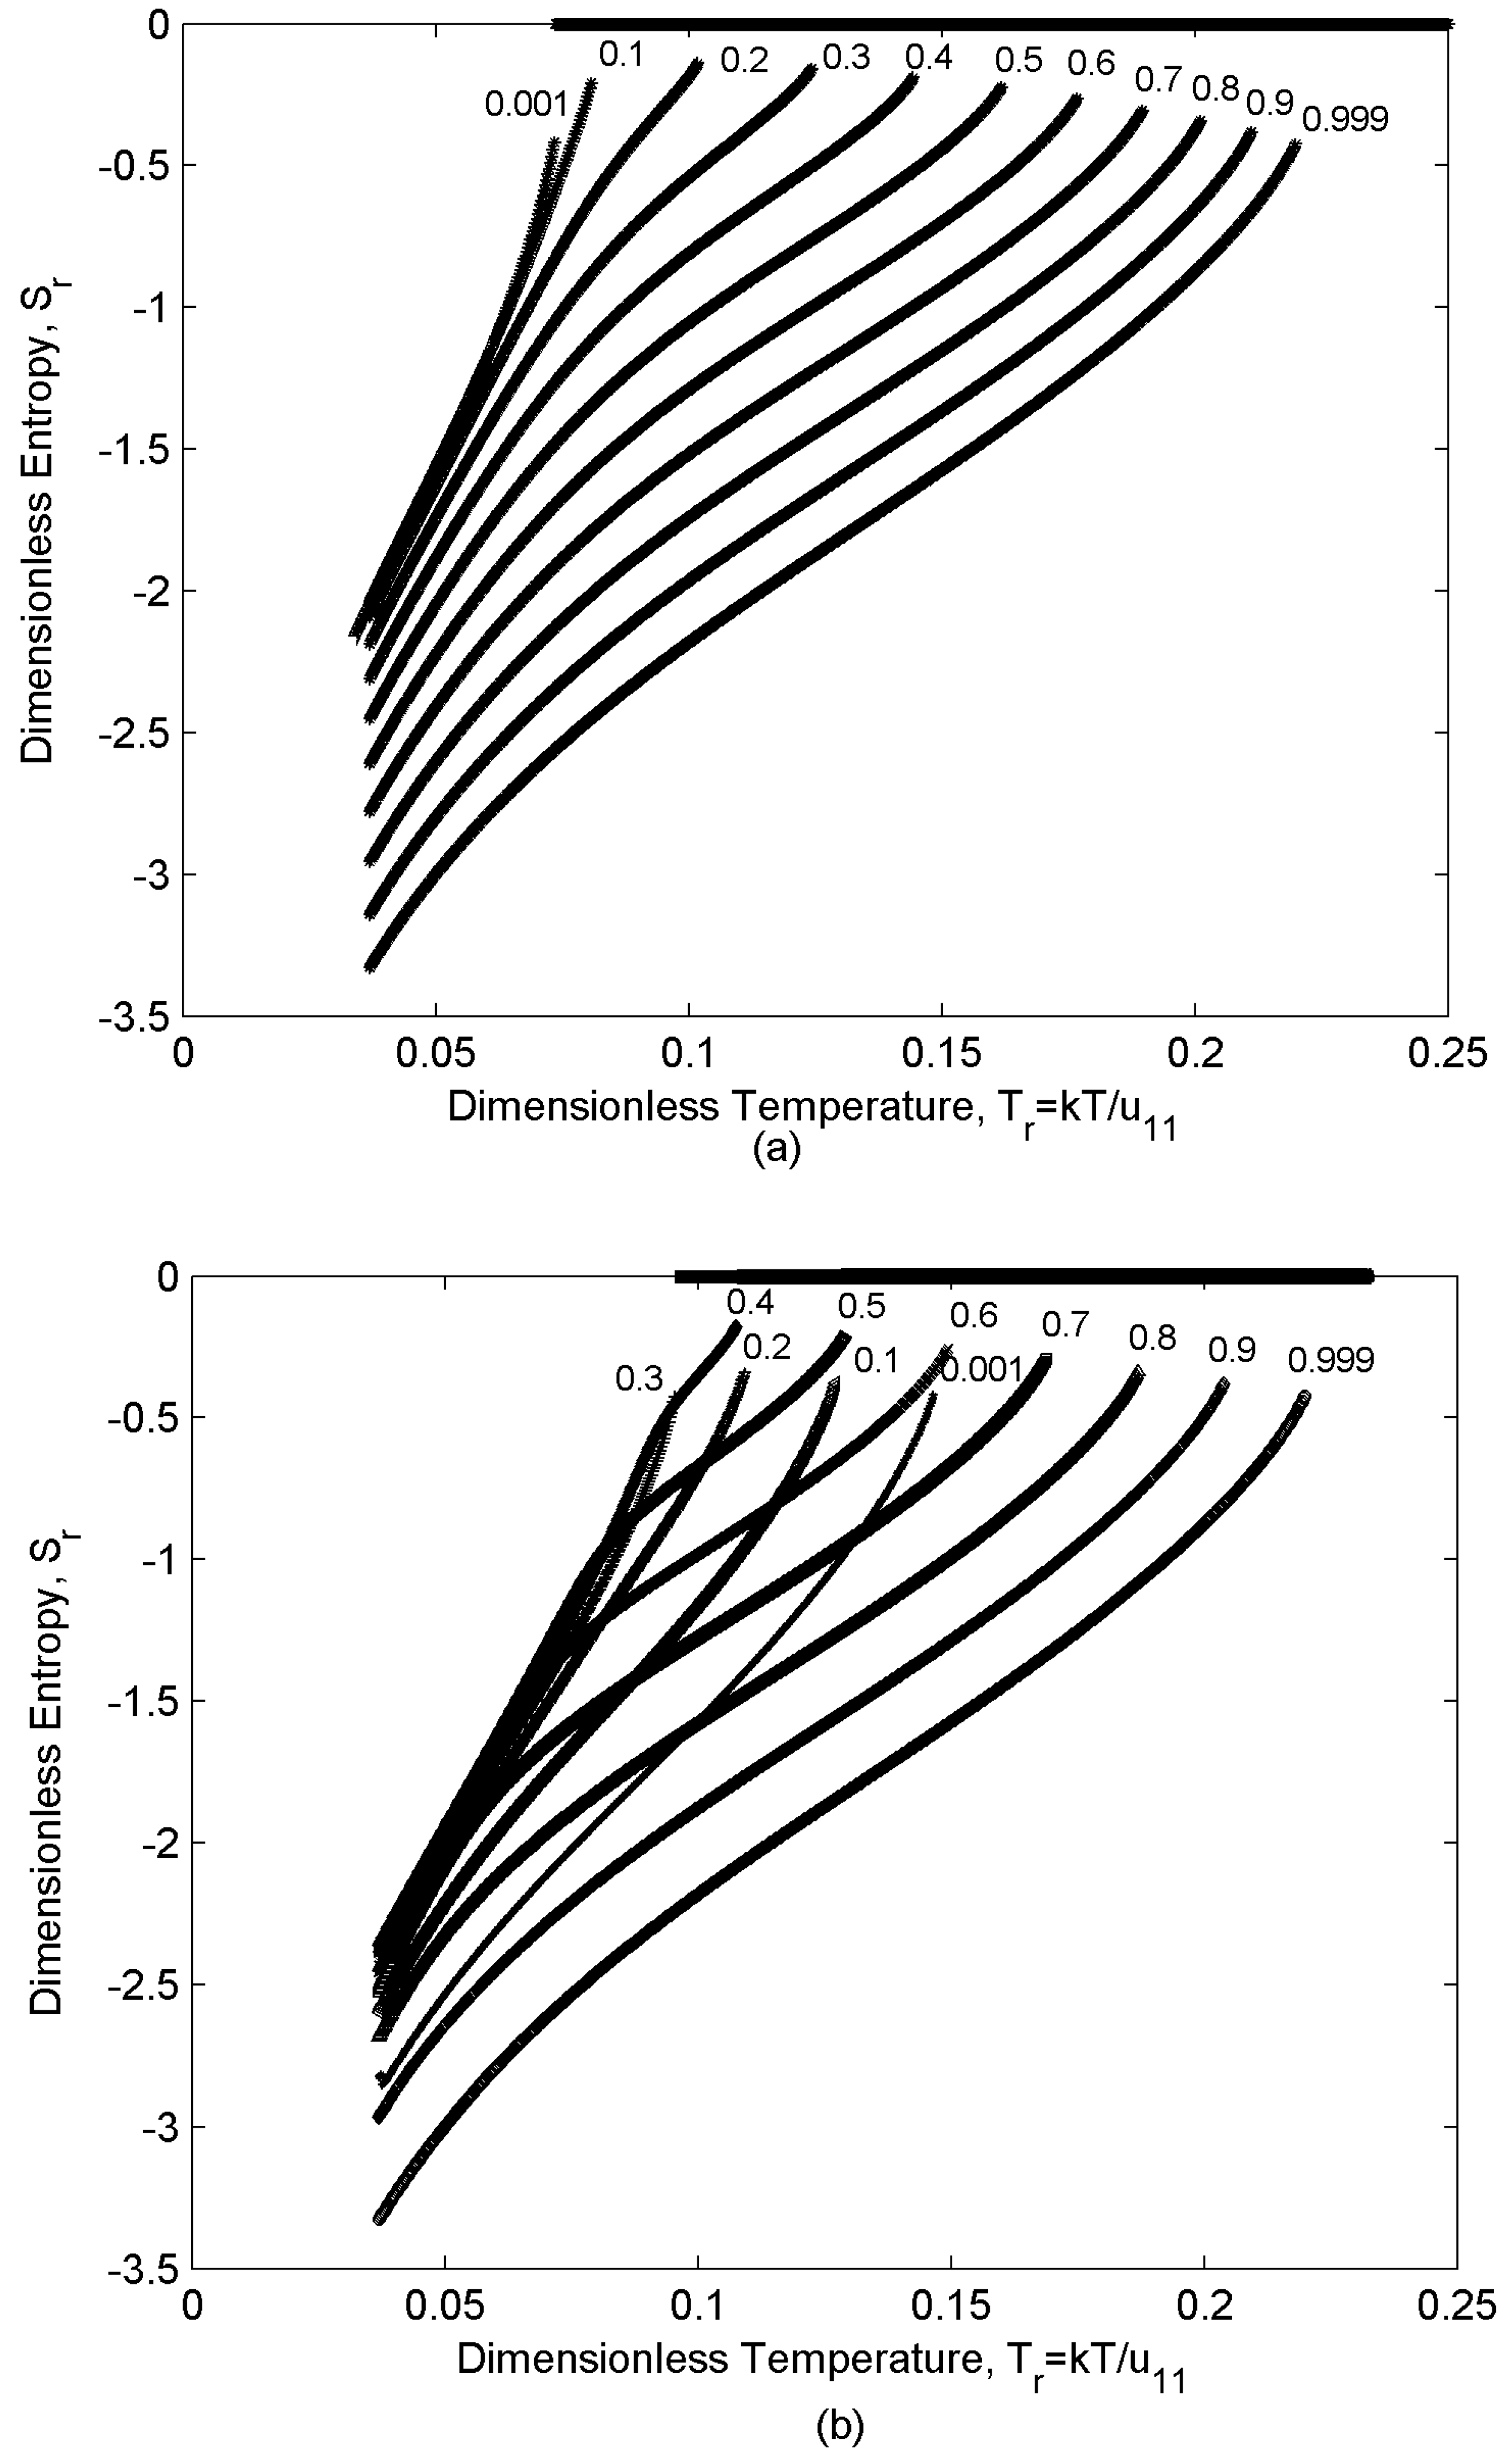
Figure 6a shows the dimensionless entropy, Sr, as a function of temperature, for an ideal mixture with ΔMw = 800 and interaction β = 1 (Figure 3); each curve shows the entropic trend for a specific concentration m1. The following features are observed in this figure:
- (i)
- For any given concentration, entropy increases monotonically with increasing temperature (Figure 5).
- (ii)
- For any given temperature, entropy increases with decreasing concentration: component “1” has higher Mw, so it is more ordered in the nematic range. Therefore, as the concentration m1 increases the mixture ordering increases and entropy decreases.
- (iii)
- Entropy jumps at the nematic-isotropic first order phase transition that sets in at temperature TNI (the entropy of the isotropic phase is assumed to be zero; as a result, this entropy represents the orientational entropy); the entropy jump value which is defined as (entropy of the isotropic phase) – (entropy of the nematic phase) at NI transition temperature for the almost pure mixtures (m1 = 0.001,0.999) are essentially the universal value , and mixing just decreases the magnitude of jump.
- (iv)
- Depending on the relative population of two components there are three distinct concentration regions: (i) m1 [0-0.1], (ii) m1 [0.2-0.3], (iii) m1 [0.4-1]. The rate of entropy change (δSr/δTr) which corresponds to the rate of ordering change in the mixture shows a rapid decrease in region (ii). Component “2” has lower Mw; as a result, it has a lower TNI (eqn.10). Therefore, while component “1” tends to remain nematic (N12 state), component “2” tends to transform to the isotropic (I) state and lose the ordering, though due to the interaction between the components it retains a low nematic ordering. As a result, when approaching the NI transition temperature of “2” the rate of ordering change in this component decreases and because of eqn.(2) the overall rate of change in the mixture decreases. The appearance of the inflection point in the graphs corresponds to this change in the rate of entropy trend. This phenomenon becomes enhanced when the relative concentrations of both components are significant (region (ii) m1 [0.2-0.3]).
Figure 6b shows the entropic behavior for ΔMw = 400 and interaction β = 0.1 which represents a non-ideal mixture (Figure 3); the concentration m1 is shown for each curve. The following features are observed in this Figure :
- (i)
- Like the ideal case increasing the temperature decreases the ordering and increases the entropy (Figure 3) of all the mixtures.
- (ii)
- Unlike the ideal case, the effect of concentration on the ordering and entropy is different at different temperatures, increasing concentration does not necessarily decreases the entropy. The following three distinctive dilution regions arise: (i) m1 [0-0.3], (ii) m1 [0.4-0.6], (iii) m1 [0.7-1]. Region (i) is located in N21 state (s2 > s1) of the phase diagram (lower left region in Figure 3); in this region the lower molecular weight species “2” is the majority component. Therefore, increasing m1, dilutes the mixture, decreases the ordering and increases the entropy (Figure 5). The second and the third regions, both are located in N12 state (s1 > s2); therefore, the trend is opposite. As component “1” is dominant in this region, increasing its concentration makes the mixture more ordered and decreases the entropy.
- (iii)
- there is a difference between region (ii) and region (iii). Like the ideal case, the rate of entropy change (δSr/δTr) in the mixture shows a rapid decrease in region (ii). When approaching the NI transition temperature of “2” the rate of ordering change in this component decreases; as a result, the overall rate of change in the mixture decreases [eqn. (2)]. This phenomenon becomes enhanced in the region (ii), where m1 = [0.4-0.6] and the concentration of both components is significant.
Figure 6.
Dimensionless entropy Sr as a function of dimensionless temperature Tr of ideal (with ∆Mw = 800 and β = 1) (a) and a non-ideal (with ∆Mw = 400 and β = 0.1) (b) mixtures for different concentrations, computed using eqns. (5, 12). Ideal mixtures show monotonic behavior with respect to dilution, while non-ideal mixtures show non-monotonicity due to the transition between N12 and N21. The entropy behavior reflects the scalar order parameters of the species and their relative concentration.
4.2. Specific Heat
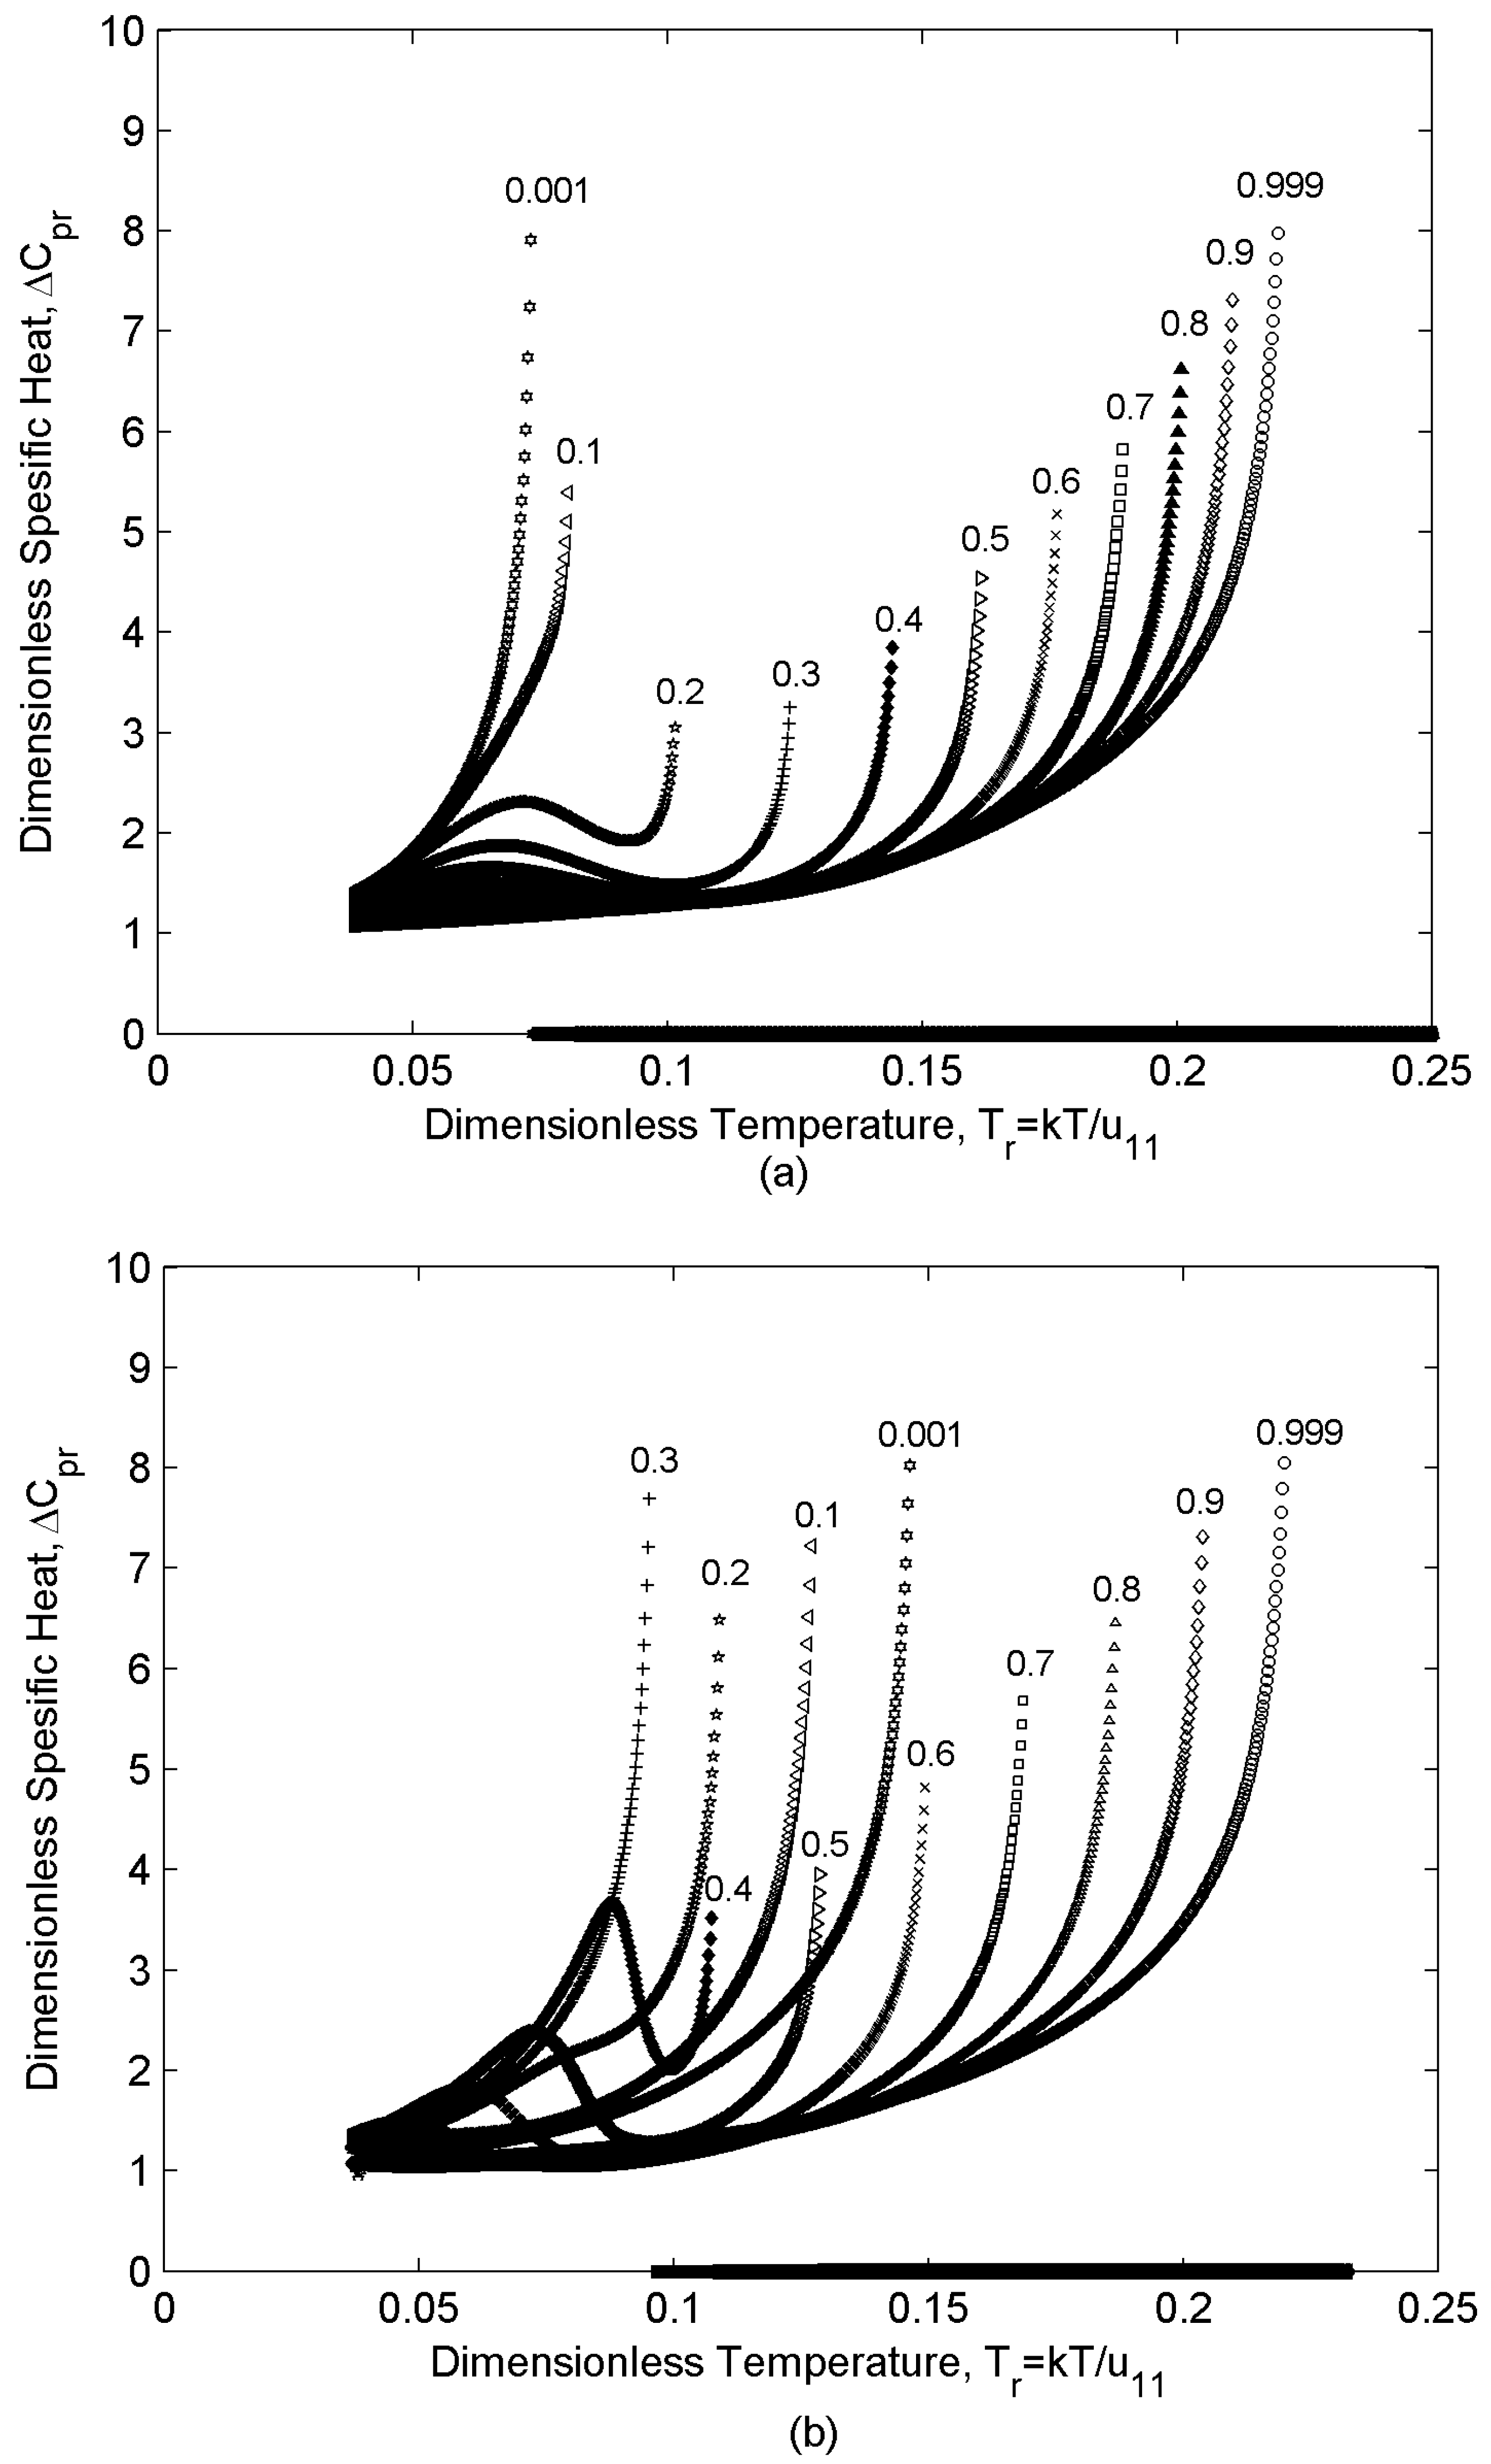
Figure 7a shows the value of the specific heat versus temperature for different concentration for the ideal case with ΔMw = 800 and β = 1. The following significant features are observed:
- (i)
- At any given temperature, increasing the concentration decreases the ordering and increases the specific heat.
- (ii)
- By sweeping over temperature, specific heat behaves differently for different concentrations. Depending on the concentration region ((i) m1 [0-0.1], (ii) m1 [0.2-0.3], (iii) m1 [0.4-1] , (see Section 4.1) two different trends are observed in the specific heat values versus temperature: in region (i) and (iii), when the population of one of the components is insignificant, and (δSr/δTr) changes monotonically, specific heat increases monotonically with temperature; however, in region (ii), where m1 = [0.2-0.3], specific heat increases by increasing temperature and then it shows a decrease which is followed by another increase. As mentioned in section 3, the non-monotonicity of the specific heat is due to the direct contributions of the Tr and (δSr/δTr) to its value. According to section 4.1 (δSr/δTr) in region (ii) shows a rapid decrease in the vicinity of TNI of component “2”; as a result, ΔCpr decreases in this range. On the other hand, increasing temperature increases ΔCpr; as a result, a minimum appears in the ΔCpr as a function of temperature.
Figure 7b shows the value of the specific heat versus temperature for different concentrations for the non-ideal case with ΔMw = 400 and β = 0.1 (Figure 3). The significant features observed are:
- (i)
- A transition is observed in ΔCpr trend vs. concentration. This transition takes place at the critical concentration where N21→ N12. Region (i) is located in N21 where increasing m1 decreases the ordering and increases ΔCpr; however, regions (ii) and (iii) are both located in N12 where increasing m1 increases the ordering and decreases ΔCpr.
- (iii)
- Depending on the concentration region ((i) m1 [0-0.3], (ii) m1 [0.4-0.6], (iii) m1 [0.7-1], (see Section 4.1) two different trends are observed in the specific heat values versus temperature: in region (i) and (iii), when the effect of one of the components is weak, (δSr/δTr) changes monotonically and specific heat increases monotonically with temperature; however, in region (ii), where m1 = [0.4-0.6] and hence essentially no majority component, (δSr/δTr) changes non-monotonically (section 4.2). As (δSr/δTr) has a contribution to the specific heat values, ΔCpr exhibits a minimum vs. temperature in this region (see section 3).
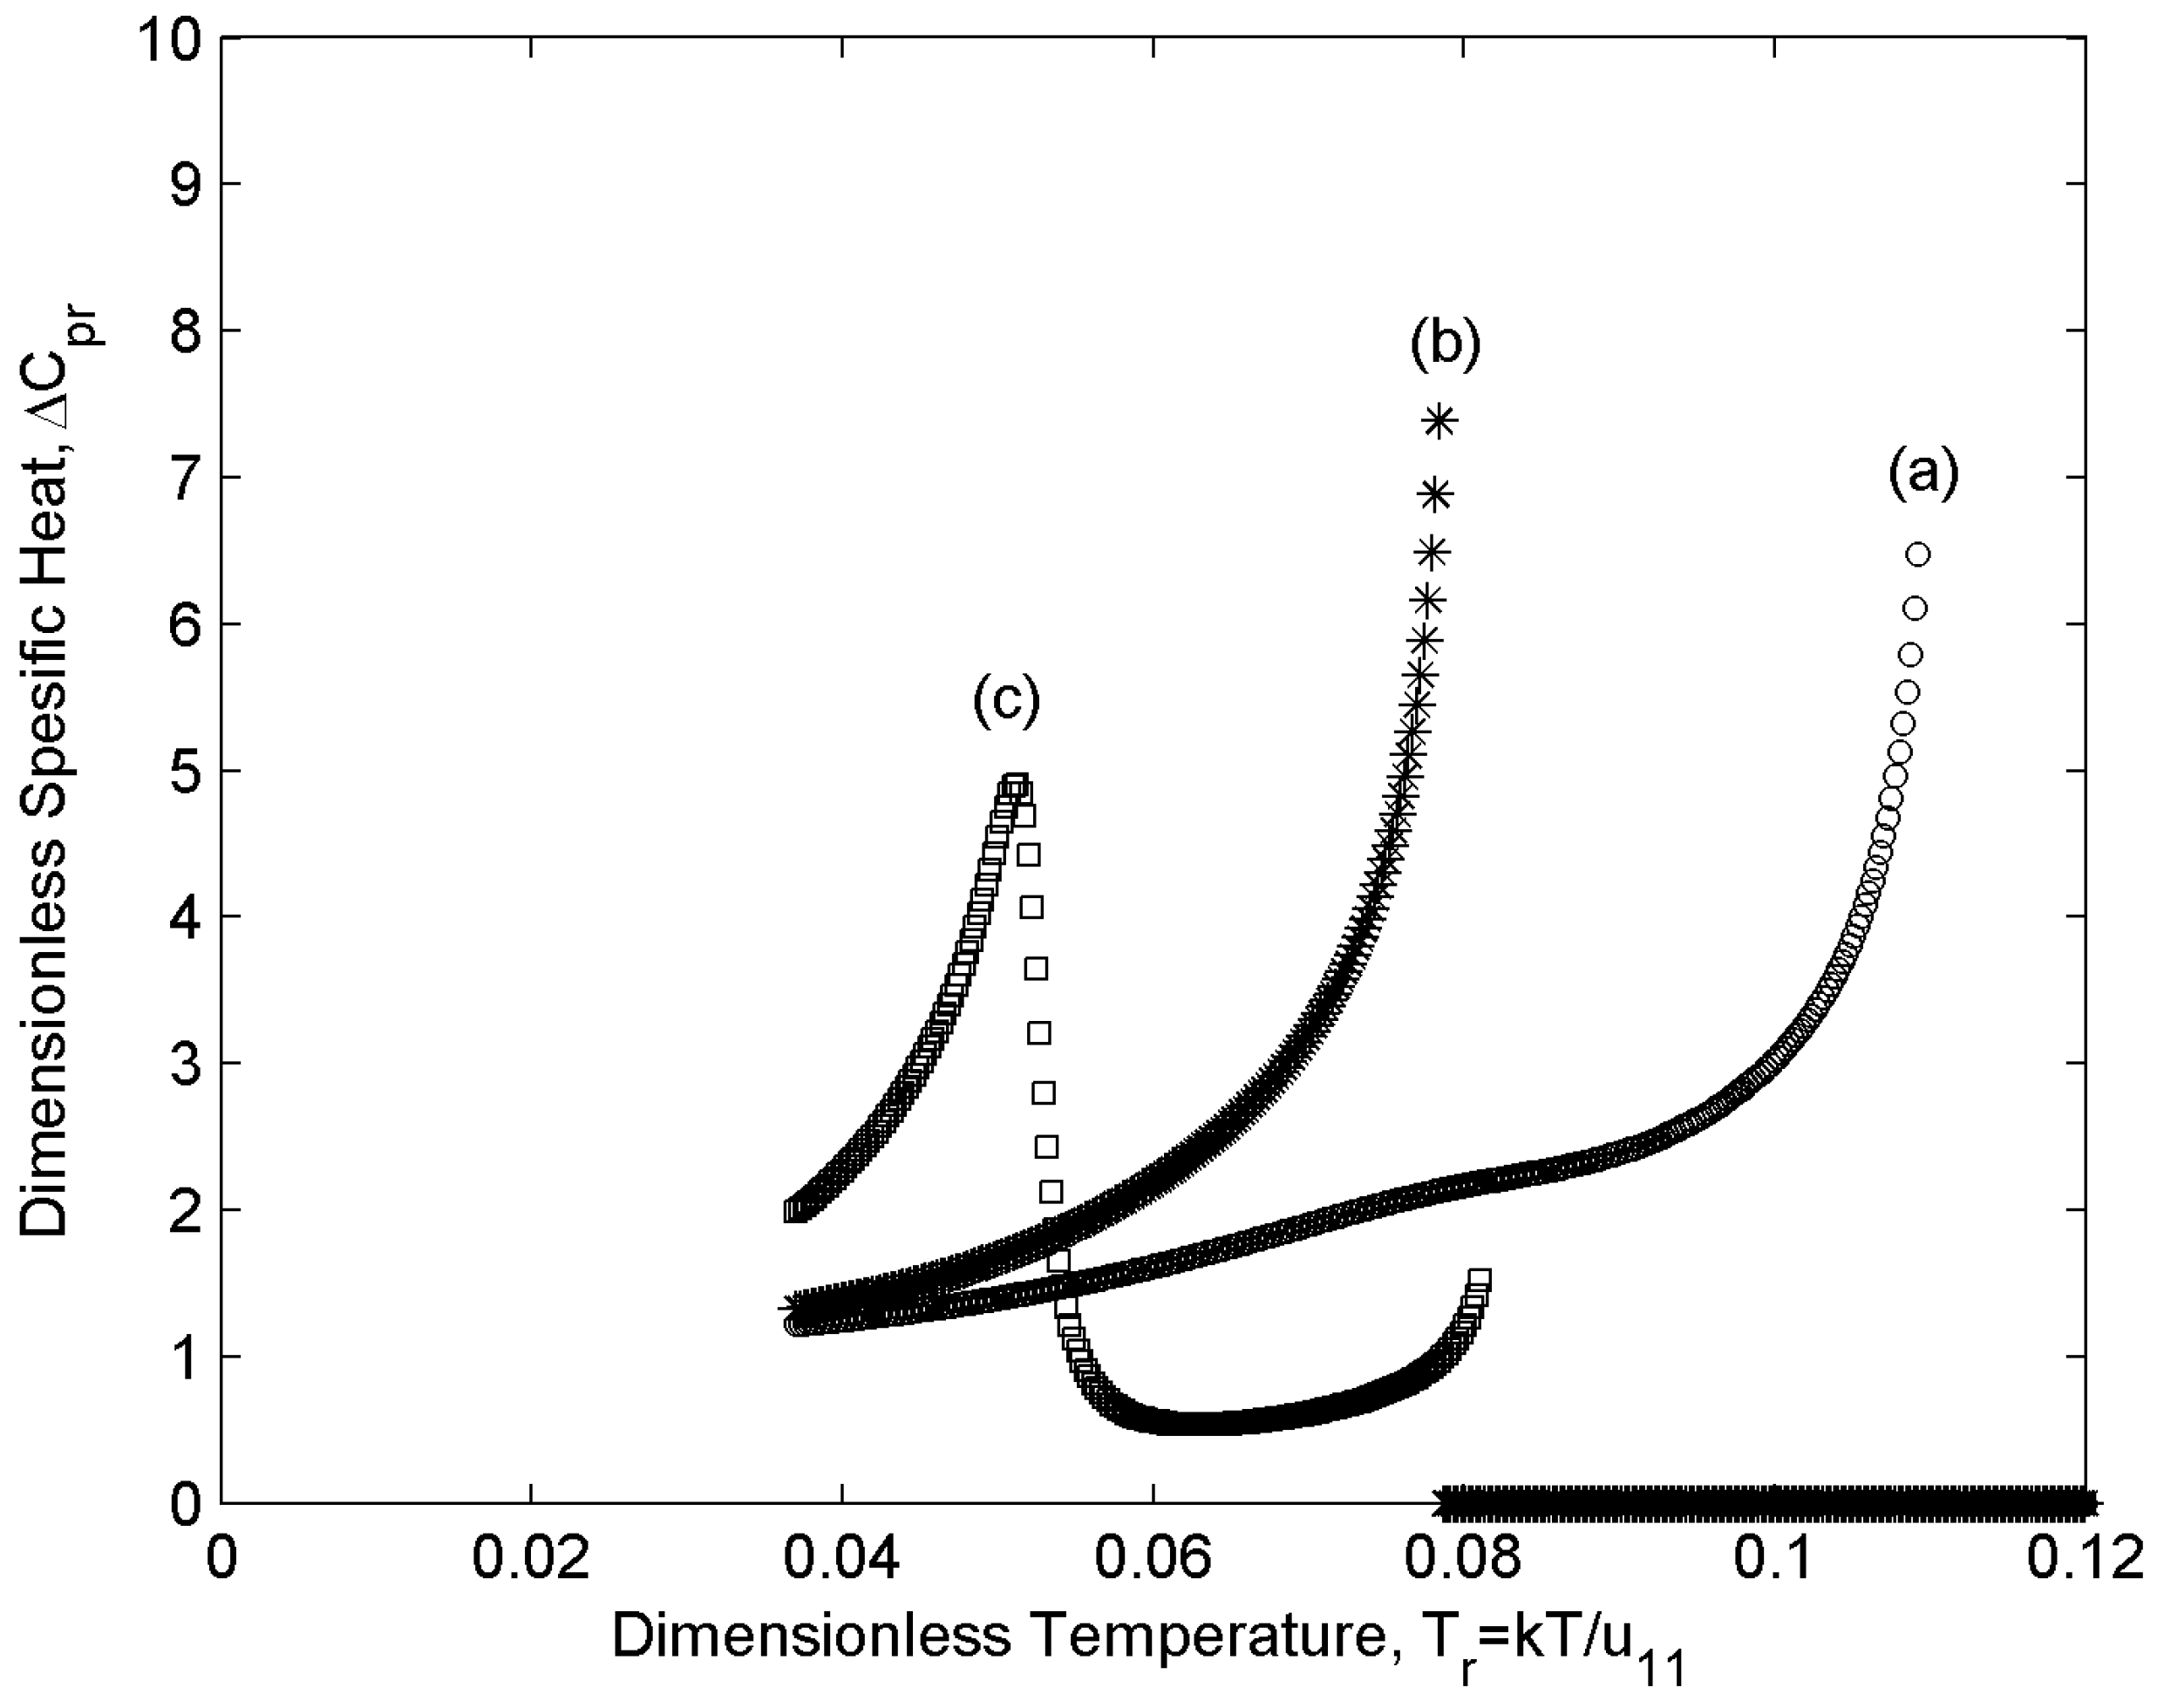
To better understand the effect of species relative population on ΔCpr values we investigate ΔCpr for three mixtures with different molecular weight differences (asymmetries) ΔMw = 400 (a), 600(b), and 800(c) for m1 = 0.2 and β = 0.1. The results are shown in Figure 8. Based on Figure 3 all three mixtures belong to the non-ideal type. The values of the critical concentration for these mixtures are: 0.31, 0.205 and 0.11 respectively [1]. As a result, for mixtures (a) and (b) component “2” is the majority species, so they exhibit a monotonic ΔCpr; however, in mixture (c) there is no majority component and hence ΔCpr exhibits an extremum.
The interaction parameter, as another intrinsic property changes the type of the mixture and the critical concentration (Figure 3); as a result, it also affects the ΔCpr values. For brevity the related graphs are not presented here.
Figure 7.
Specific heat ΔCpr as a function of dimensionless temperature for ideal (with ∆Mw = 800 and β = 1) (a) and non-ideal (with ∆Mw = 400 and β = 0.1) (b) mixtures for different concentrations. Ideal mixtures show monotonic behavior of specific heat while non-ideal mixtures display non-monotonicity with respect to dilution. Both cases show non-monotonicity with respect to temperature whenever the relative concnetration of the components is significant.
In partial summary, the higher Mw species always controls the overall ordering of the ideal mixture; as a result, the specific heat of ideal mixtures shows a decrease by increasing concentration at any given temperature; On the other hand, in non-ideal mixtures of weakly interacting species a transition in the trend of ΔCpr versus concentration is observed. This transition takes place within the nematic phase from N12 to the N12 state. For both ideal and non-ideal type, whenever there is no majority component in the mixture, the trend of specific heat versus temperature is non-monotonic because each component tends to show different ordering at different temperature range.
Figure 8.
Specific heat ΔCpr as a function of dimensionless temperature for m1 = 0.2 and β = 0.1 for three different molecular weight asymmetries: ∆Mw = 400 (a), 600 (b), and 800(c). All three cases are non-ideal mixtures; in case (c) the relative concentration of the components is significant, so it shows a non-monotonic trend with respect to temperature.
4.3. Entropy Jump at Transitions
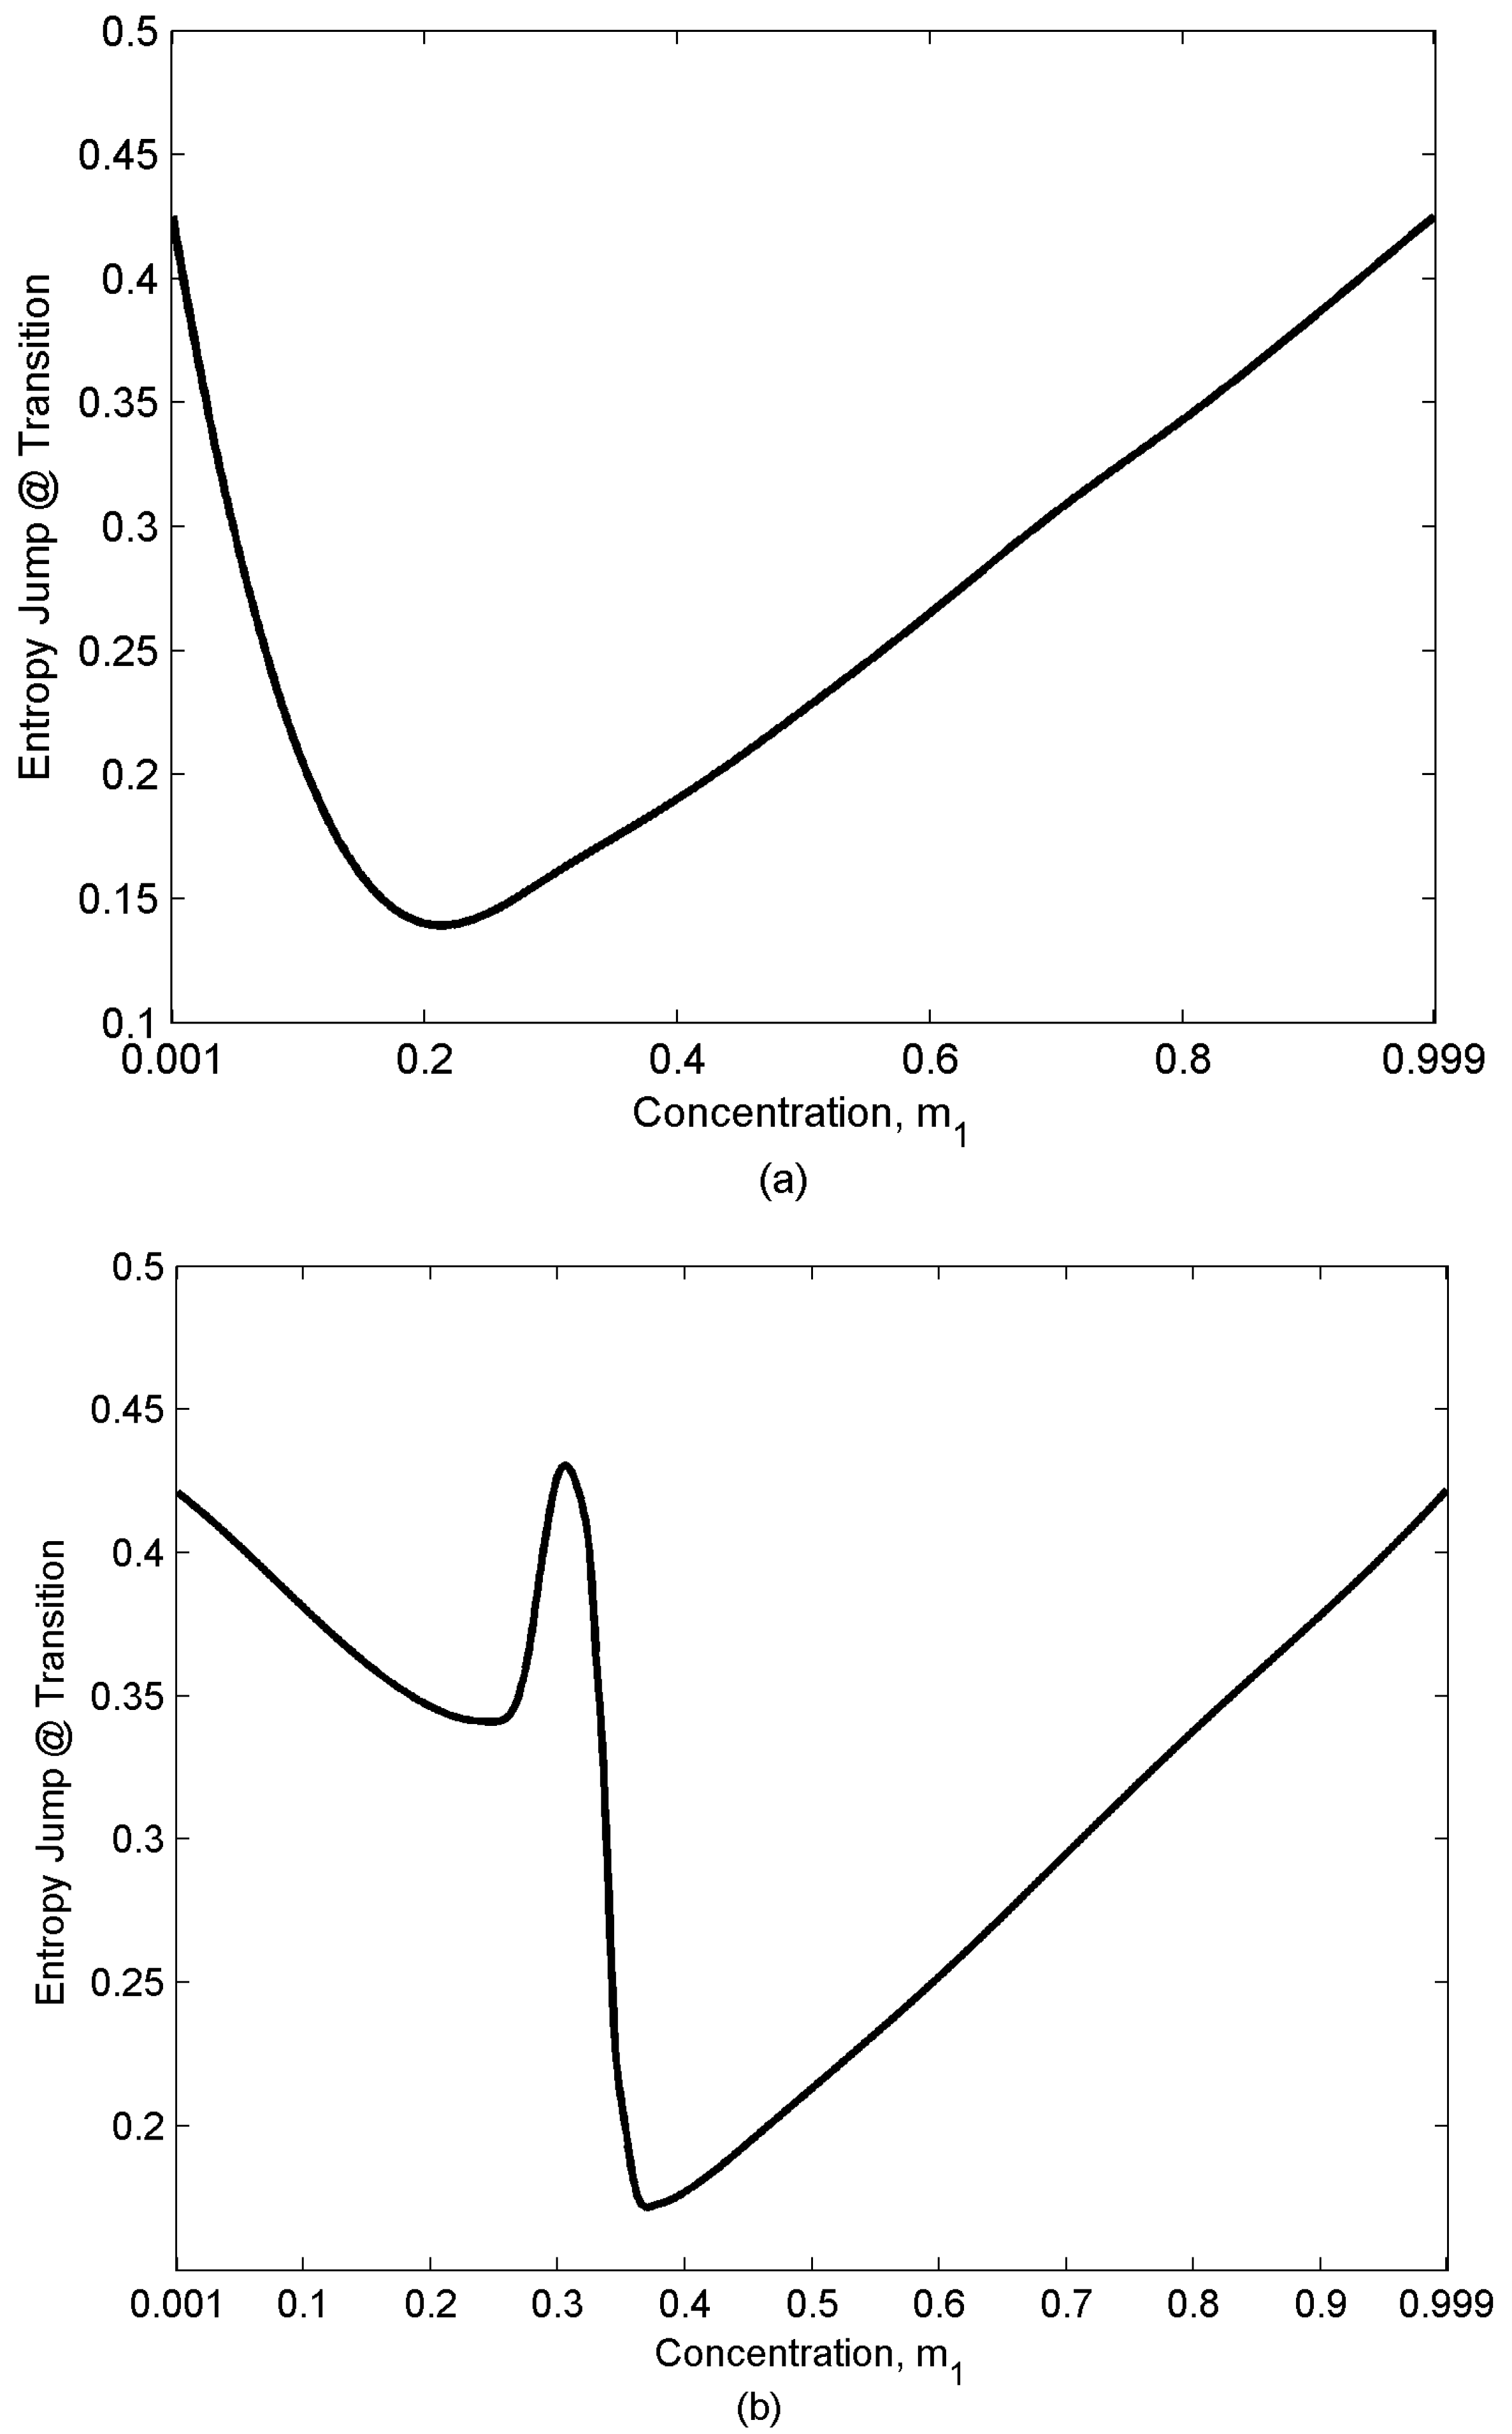
Figure 9a shows the entropy jump at the NI transition for an ideal case, ΔMw = 800 and β = 1. For the pure systems (two asymptotic limits m1 = 0, 1) the value of the entropy jump is the universal value 0.417 [19]. On the other hand, diluting the system disturbs the orientation and increases the entropy. As a result, there is a concentration which corresponds to the minimum entropy jump at NI transition. This concentration depends on the intrinsic properties of the mixture and is about 0.2 in the present case. Increasing dissimilarity of the components (larger ΔMw) enhances the dominancy of component ”1” and shifts the minimum into lower concentrations.
Figure 9b shows the values of the entropy jump at transition for a non-ideal case, ΔMw = 400 and β = 0.1. In this case a local maximum is observed in the graph. The concentration corresponding to the local maximum is the critical concentration where the mixture behaves like a single component NLC (pseudo-pure mixture). Therefore, the value of the entropy for this concentration is the universal value 0.417719 and identical to that of the pure systems. Like the ideal mixture, diluting the pure (or pseudo-pure) mixture increases the entropy. So, the first local minimum is observed between m1 = 0 (pure system) and m1c (pseudo-pure mixture) which is located in the N21 region and the second one is observed between m1= m1c (pseudo-pure mixture) and m1 = 1 (pure system) which is located in the N12 region.
Figure 9.
Entropic variations at NI transition as a function of concentration for ideal (with ∆Mw = 800 and β = 1) (a) and non-ideal (with ∆Mw = 400 and β = 0.1) (b) mixtures for different concentrations. Both pure and pseudo pure mixtures have the universal entropy at NI transition. A local minimum is observed for the ideal case, where there is only N12 state; however, two local minima (one in N21 and the other in N12) and a maximum (in N12→N21 transition, which corresponds to the critical concentration) are observed for the non-ideal case.

5. Conclusions
This paper uses the Maier-Saupe model for binary mixtures of discotic nematogenes to calculate the orientational entropy and orientational specific heat. These quantities are used to characterize the type of binary mixtures, ideal or non-ideal, which arise due to different intrinsic parameters, Mw asymmetry ΔMw and the interaction parameter β: (i) for ideal mixtures entropy and specific heat changes monotonically as a function of concentration at any given temperature. The entropic jump at NI transition exhibits a minimum for this kind of mixture. (ii) For non-ideal mixtures entropy and specific heat change non-monotonically as a function of concentration. A transition within the nematic phase from N21 to N12 is observed in this type of mixture. This transition takes place at the critical concentration and can be detected by the entropic and specific heat trend: the trend of these quantities in N21 is opposite to their trend in N12. The entropic jump at the NI transition exhibits two local minima; one located in the N21 region and the other in N12 region. It also has a local maximum between these two regions at critical concentration, where the mixture behaves like a single component system and shows the universal entropy jump at NI transition. For both type of mixtures whenever there is a distinct majority component, ΔCpr and entropy behaves monotonically versus temperature; however, when there is no majority component ΔCpr and entropic trends are non-monotonic with temperature.
In the summary, heat capacity and transition entropies are shown to be useful tools to characterize the type of the discotic nematic liquid crystal and carbonaceous mesophase mixtures, to determine nematic ordering and to asses the degree of molecular interaction and molecular weights using standard calorimetric methods.
Acknowledgements
Support was provided by the National Science Foundation under Award Number EEC-9731689.
References
- Golmohammadi, M.; Rey, A.D. A thermodynamic model for binary carbonaceous mesophases. J. Chem. Phys. 2008. (submitted). [Google Scholar]
- van der Veen, J.; de Jeu, W.H.; Wannlnkhof, M.W.M.; Tlenhoven, C.A.M. Transition entropies and mesomorphic behavior of para-distributed azoxy benzenes. J. Phys. Chem. 1973, 77, 2153–2155. [Google Scholar] [CrossRef]
- Hwang, D.K. Computational optical science of textured liquid crystals for biosensors, rheooptics, and carbon composites. PhD Thesis, McGill University, Montreal, Canada, 2006; p. 7. [Google Scholar]
- Rey, A.D. Capillary models for liquid crystal fibers, membranes, films, and drops. Soft Matter 2007, 3, 1349–1368. [Google Scholar] [CrossRef]
- Singer, L.S. The mesophase in carbonaceous pitches. Faraday Discuss. 1985, 79, 265–272. [Google Scholar] [CrossRef]
- Dubois, J.; Agache, C.; White, J.L. The carbonaceous mesophase formed in the pyrolysis of graphitizable organic materials. Mater. Charact. 1997, 39, 105–137. [Google Scholar] [CrossRef]
- Marsh, H. Carbonization and liquid-crystal (mesophase) development: Part 1. The significance of the mesophase during carbonization of coking coals. Fuel 1973, 52, 205–212. [Google Scholar] [CrossRef]
- Gupta, G.; Rey, A.D. Texture rules for concentrated filled nematics. Phys. Rev. Lett. 2005, 95, 127802:1–127802:4. [Google Scholar] [CrossRef]
- Edie, D.D.; Robinson, K.E.; Fleurot, O.; Jones, S.P.; Fain, C.C. High thermal conductivity ribbon fibers from naphthalene-based mesophase. Carbon 1994, 32, 1045–1054. [Google Scholar] [CrossRef]
- Hurt, R.H.; Hu, Y. Thermodynamics of carbonaceous mesophase. Carbon 1999, 37, 281–292. [Google Scholar] [CrossRef]
- Yoon, S.H.; Korai, Y.; Mochida, I. Spinning characteristics of mesophase pitches derived from naphthalene and methylnaphthalene with HF/BF3. Carbon 1993, 31, 849–856. [Google Scholar] [CrossRef]
- Naggapa, S.; Nataraju, S.K.; Marthandappa, M. Order parameter of mixtures of nematic compounds. Mol. Cryst. Liq. Cryst. 1991, 197, 15–20. [Google Scholar] [CrossRef]
- Rey, A.D.; Denn, M.M. Dynamical phenomena in liquid crystalline materials. Annu. Rev. Fluid Mech. 2002, 34, 233–266. [Google Scholar] [CrossRef]
- Yan, J.; Rey, A.D. Texture formation in carbonaceous mesophase fibers. Phys. Rev. E. 2002, 65, 031713:1–031713:14. [Google Scholar] [CrossRef]
- Yan, J.; Rey, A.D. Theory and simulation of texture formation in mesophase carbon fibers. Carbon 2002, 40, 2647–2660. [Google Scholar] [CrossRef]
- Hong, S.; Chan, P.K. Computational study of the texture formation in mesophase pitch-based carbon fibers. Liq. Cryst. 2006, 33, 295–306. [Google Scholar] [CrossRef]
- Hong, S.; Chan, P.K. Structure development and texture formation in carbonaceous mesophase fibers. Comput. Mater. Sci. 2006, 36, 310–318. [Google Scholar] [CrossRef]
- Sori, M. Calorimetric measurments in nematics. In Physical properties of liquid crystals: nematics; Dunmur, D.A., Fukuda, A., Luckhurst, G.R., Eds.; INSPEC: London, UK, 2001; pp. 14–50. [Google Scholar]
- Alapati, P.R.; Saran, D. An investigation of smectic a-nematic and nematic-isotropic phase transitions. Phys. Stat. Sol. B 1991, 168, 39–47. [Google Scholar] [CrossRef]
- Naggapa, S.; Mahadeva, J.; Somashekarappa, H.; Somashekar, R. Variation of the entropy of the transition in nemtaic mixtures. Indian J. Phys. A Proc. Indian. Assoc. Cultiv. Sci. 2000, 74A, 45–48. [Google Scholar]
- Grasso, D.; Gandolfo, C.; Fasone, S. Calorimetry of homologous p-n-alkoxybenzyliden-p′-n-pentyloxyanilines. Thermo. Acta. 1984, 77, 413–420. [Google Scholar] [CrossRef]
- Nagappa, S.; Jagadish, K.N.; Mahadeva, J.; Naveenkumar, S.K.; Somashekar, R. Variation of the entropy of the transition in nematic mixtures. Mol. Cryst. Liq. Cryst. 2001, 366, 239–246. [Google Scholar] [CrossRef]
- Stephen, M.J.; Straley, J.P. Physics of liquid crystals. Rev. Mod. Phys. 1974, 46, 617–702. [Google Scholar] [CrossRef]
- L'huillier, d.; Rey, A.D. Liquid crystalline nematic polymers revisited. J. Non-Newtonian Fluid Mech. 2004, 120, 85–92. [Google Scholar] [CrossRef]
- Chhandrasekhar, S. Liquid crystals, 2nd ed.; Cambridge University Press: New York, NY, USA, 1992; pp. 40–45. [Google Scholar]
- Humphrieps, R.L.; James, G.; Luckhurst, G.R. A molecular field treatment of liquid crystalline mixtures. Symp. Faraday Soc. 1971, 5, 107–118. [Google Scholar] [CrossRef]
- Bates, G.S.; Beckmann, P.A.; Burnell, E.E. Deuteron nuclear magnetic resonance and orientational order in binary mixtures of liquid crystals. Mol. Phys. 1986, 57, 351–357. [Google Scholar] [CrossRef]
- Muhoray, P.P.; Dunmur, D.A.; Miller, W.H. Orientational order in binary mixtures of nematic liquid crystals. Liq. Cryst. Ord. Fluids 1984, 4, 615–641. [Google Scholar]
- Muhoray, P.P.; de Bruyn, J.J. Mean field theory of binary mixtures of nematic liquid crystals. Mol. Cryst. Liq. Cryst. 1985, 127, 301–319. [Google Scholar] [CrossRef]
- Hu, Y.; Hurt, R.H. Thermodynamics of carbonaceous mesophase II. General theory for non ideal solutions. Carbon 2001, 39, 887–896. [Google Scholar] [CrossRef]
- Bates, G.S.; Burnell, E.E.; Hoatson, G.L.; Muhoray, P.P.; Weaver, A. Orientational order of rod-and disk-like solutes in the nematic liquid crystal 5CB. Chem. Phys. Lett. 1986, 134, 161–165. [Google Scholar] [CrossRef]
- Cervo, E.G.; Thies, M.C. Control of the molecular weight distribution of petroleum pitches via dense-gas extraction. Chem. Eng. Technol. 2007, 30, 742–748. [Google Scholar] [CrossRef]
- Huebner, K.H.; Dewhirst, D.L.; Smith, D.E.; Byrom, T.G. The finite element methods for engineers, 4th ed.; John Wiley & Sons, Inc.: New York, NY, USA, 2001; pp. 61–62. [Google Scholar]
- Prausnitz, J.M.; Lichtenthaler, R.N.; Azevedo, E.G. Molecular thermodynamics of fluid-phase equilibrium; Prentice Hall Inc.: Englewood Cliffs, NJ, USA, 1986; p. 13. [Google Scholar]
© 2008 by the authors; licensee Molecular Diversity Preservation International, Basel, Switzerland. This article is an open-access article distributed under the terms and conditions of the Creative Commons Attribution license (http://creativecommons.org/licenses/by/3.0/).
Share and Cite
MDPI and ACS Style
Golmohammadi, M.; Rey, A.D. Entropic Behavior of Binary Carbonaceous Mesophases. Entropy 2008, 10, 183-199. https://doi.org/10.3390/entropy-e10030183
AMA Style
Golmohammadi M, Rey AD. Entropic Behavior of Binary Carbonaceous Mesophases. Entropy. 2008; 10(3):183-199. https://doi.org/10.3390/entropy-e10030183
Chicago/Turabian StyleGolmohammadi, Mojdeh, and Alejandro D. Rey. 2008. "Entropic Behavior of Binary Carbonaceous Mesophases" Entropy 10, no. 3: 183-199. https://doi.org/10.3390/entropy-e10030183